Usage Analysis with App Insights
Users are reporting slow response times on the PartsUnlimited website. None of our current telemetry is logging custom events. We want to track what items are being removed from the cart and how long it is taking from the site. We also want to dive a bit deeper in to our current analytic reports and dig up some useful data to provide a better experience for our users.
DevOps MPP Course Source
- This lab is used in course Application Monitoring and Feedback Loops - Module 2.
Pre-requisites:
- .Net Core SDK
Lab Tasks:
-
Set up Application Insights for PartsUnlimited
-
Create a custom telemetry event on the client side
-
Create a custom telemetry event on the server side
-
Trigger some events
-
Build a custom query to view performance metrics and data
Estimated Lab Time:
- approx. 60 minutes
Task 1: Set up Application Insights for PartsUnlimited
This will walk through creating an Application Insights instance in Azure and connecting it to the PartsUnlimited solution.
Configure Application Insights with PartsUnlimited solution by following these steps: Application Insights - Getting Started
Task 2: Create a custom telemetry event on the client side
In this task you will set the App Insights key and create a custom event tracker, so that client side’s JavaScript can start logging events.
Let’s say we want to see how often people are removing items from the cart and how long it is taking for the system to complete this action.
Step 1. We need to make sure we have the Application Insights script included in the application. This should already exist in the PartsUnlimited solution under wwwroot/Scripts/AppInsights.js
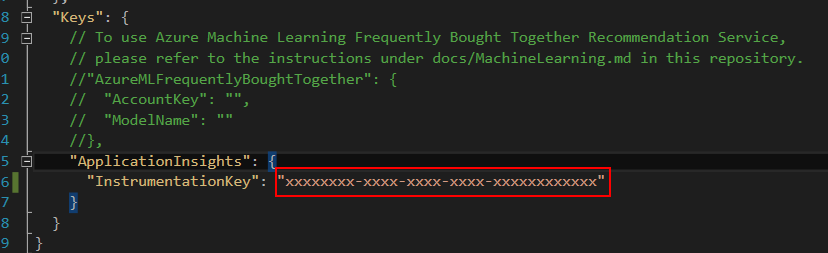
We also want to check the config.json and ensure our Application Insights InstrumentationKey is correct. This file should be sitting under the root of the PartsUnlimitedWebsite project.
Step 2. Now we want to track when users click remove items from the cart. This could provide valuable information around how the UI is responding for the user.
It’s really easy to add tracking for this in our cart. If you open the template file for the shopping cart found at Views -> ShoppingCart -> Index.cshtml you will be able to find some custom event logging already in action! The startTrackEvent will start a timer and reference the record the user wants to remove from the cart. Once stopTrackEvent is called the timer log the time taken from start to finish and add a custom measurement of ‘duration’.
...
window.appInsights.startTrackEvent(recordToDelete);
...
// ajax call to remove item from the cart
...
 window.appInsights.stopTrackEvent(recordToDelete);
...
Task 3: Create a custom telemetry event on the server side
In this task you will create an Application Insights telemetry provider which will log data on the server side of the PartsUnlimited’s website.
Step 1.
Firstly we need an Application Insights telemetry provider. This will essentially wrap up any Application Insights specific calls inside an common interface. This means we can swap out specific tracing implementations either before or at runtime. Add a new class to “Telemetry” folder, name it ApplicationInsightsTelemetryProvider.cs.
Step 3. Implement the already existing ITelemetryProvider and wire up the methods to use the application insights telemetry client.
public class ApplicationInsightsTelemetryProvider : ITelemetryProvider
    {
        private readonly TelemetryClient _telemetry;

        public ApplicationInsightsTelemetryProvider()
        {
            _telemetry = new TelemetryClient();
        }

        public void TrackTrace(string message)
        {
            _telemetry.TrackTrace(message);
        }

        public void TrackEvent(string message)
        {
            _telemetry.TrackEvent(message);
        }

        public void TrackEvent(string message, Dictionary<string, string> properties, Dictionary<string, double> measurements)
        {
            _telemetry.TrackEvent(message, properties, measurements);
        }

        public void TrackException(Exception exception)
        {
            _telemetry.TrackException(exception);
        }
    }
public class VersionedTelemetryInitializer : ITelemetryInitializer
{
    public void Initialize(ITelemetry telemetry)
    {
        // you could possibly pull this from the assembly version
        telemetry.Context.Properties["Version"] = "1.0.0.1";
    }
}
Note: You can add context here for the TelemetryClient to use. This could be used to filter results to a specific version. If we released a new version with some features in a pilot sample of users, we could see if this has inadvertently impacted other parts of the solution.
public class ApplicationInsightsTelemetryProvider : ITelemetryProvider
{
    private readonly TelemetryClient _telemetry;

    public ApplicationInsightsTelemetryProvider()
    {
          TelemetryConfiguration telemetryConfiguration = new TelemetryConfiguration
          {
              TelemetryInitializers = { new MyTelemetryInitializer() }
          };

          _telemetry = new TelemetryClient(telemetryConfiguration);
    }
    ...
Step 4. In Startup.cs we need to rewire out dependency injector. Currently it’s using an EmptyTelemetryProvider. We want to swap this out with our newly created ApplicationInsightsTelemetryProvider. Locate the line where the ITelemetryProvider is bound. It should look something like this
(Before)
public void ConfigureServices(IServiceCollection services)
{
    ...
    services.AddSingleton<ITelemetryProvider, EmptyTelemetryProvider>();
    ...
}
(After)
public void ConfigureServices(IServiceCollection services)
{
    ...
    services.AddSingleton<ITelemetryProvider, ApplicationInsightsTelemetryProvider>();
    ...
}
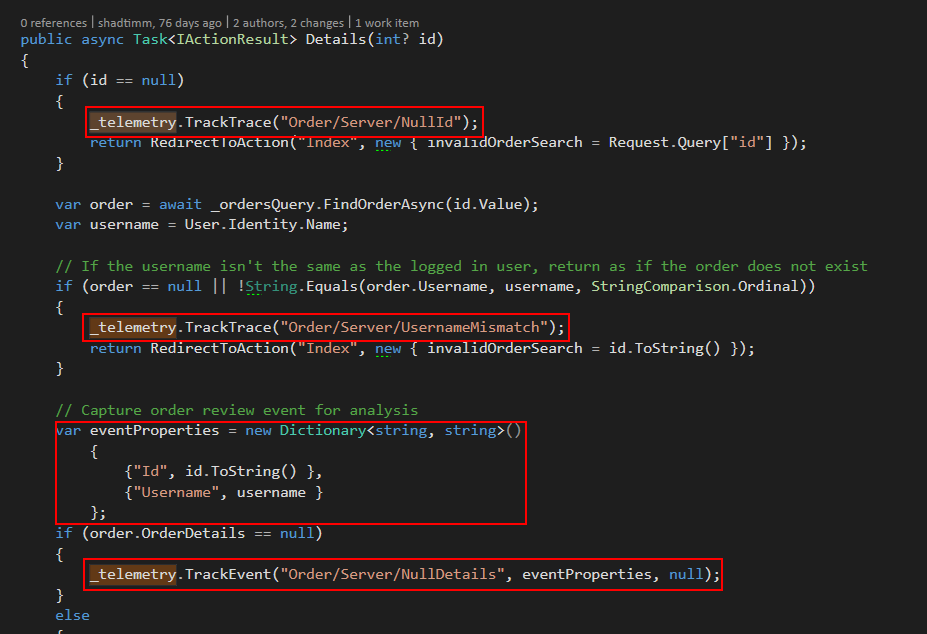
Step 5. Locate the OrdersController class at Controllers -> OrdersController.cs . Here you will see our telemetry client already in action! The only difference here is that we’re now using Application Insights. You can also see the different types of tracing. We’re using TrackTrace to log paths taken through the application. This is useful for checking when a null id is supplied or a username miss match is triggered. We’re also using TrackEvent - with this method we can supply extra parameters to provide better context when surfacing this error in the management portal. This could be used to resolve issues faced by a specific user or order.
Also check out the ShoppingCartController class at Controllers -> ShoppingCartController.cs . Here you can see the measurements parameter being used to check the time taken for the order process. This could be used to display performance issues with the database.
public async Task<IActionResult> AddToCart(int id)
{
    ...
    // Start timer for save process telemetry
    var startTime = System.DateTime.Now;
    ...

    ...
    // Trace add process
    var measurements = new Dictionary<string, double>()
    {
       {"ElapsedMilliseconds", System.DateTime.Now.Subtract(startTime).TotalMilliseconds }
    };
    _telemetry.TrackEvent("Cart/Server/Add", null, measurements);
    ...
}
Task 4: Trigger some events
This task will walk you through generating some data for the next task based on the logging we have set up in the previous task.
Step 1.
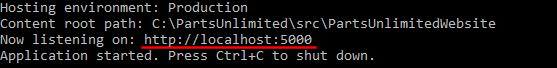
Firstly, we’ll need to fire up the application. Open up a command line, navigate to your repository and then to src > PartsUnlimitedWebsite>. Run the following command to host the website locally:
dotnet run
Note: The project will be compiled, then hosted on the URL specified in your command line (e.g. http://localhost:5000).
Step 2. Open the website’s URL in a browser. Now we want to trigger some of the custom events described earlier. Lets add some items to our shopping cart.
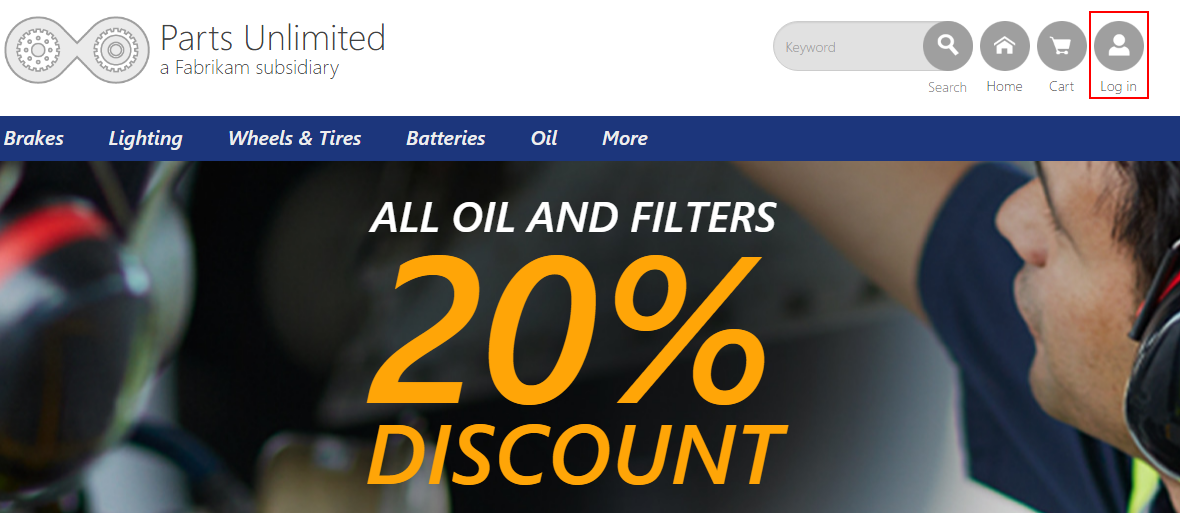
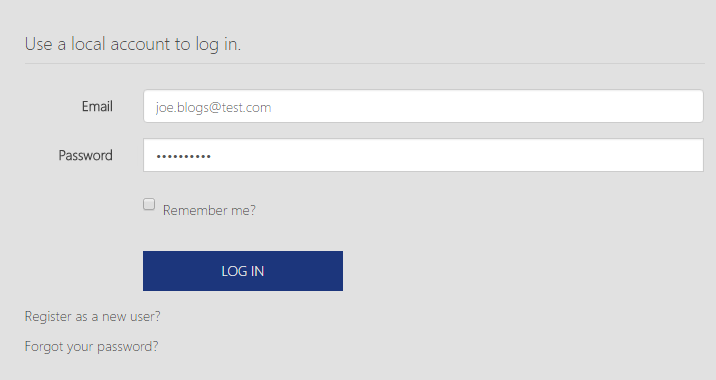
First we need to set up a new account.
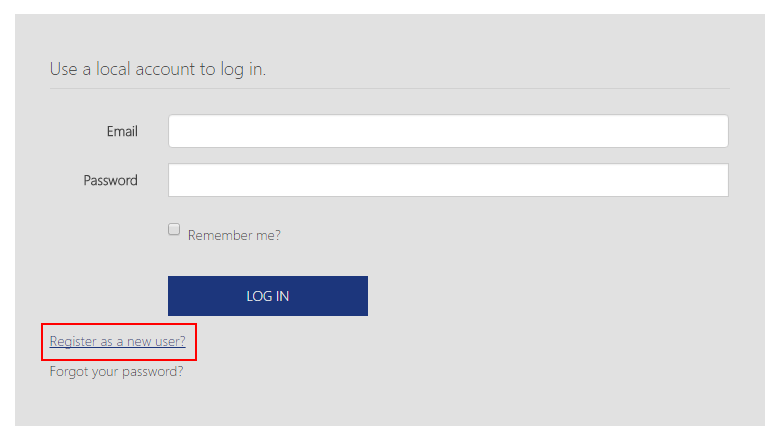
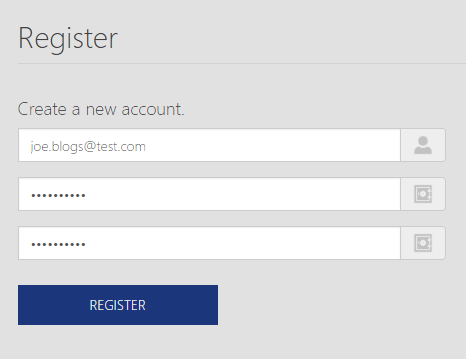
Follow these steps to register an account.
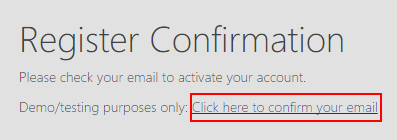
You will need to confirm the email provided.
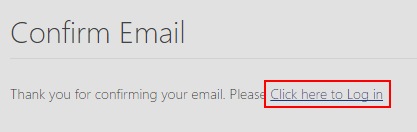
We will then need to log in again.
Now that we’re logged in, lets add something to our cart.
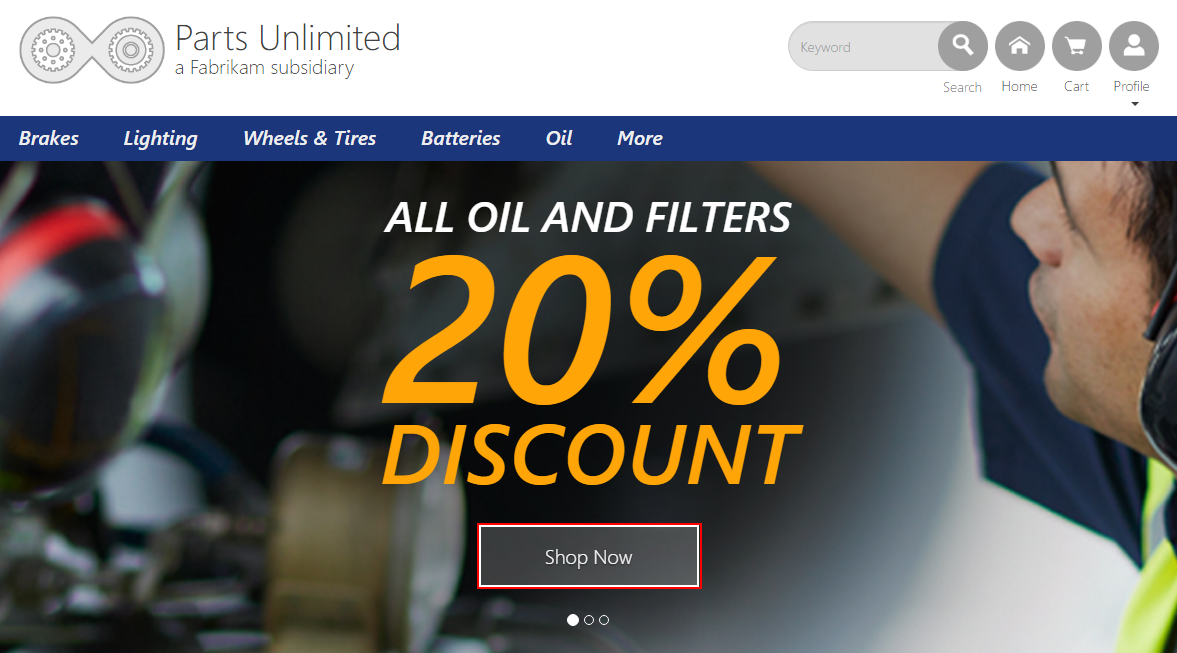
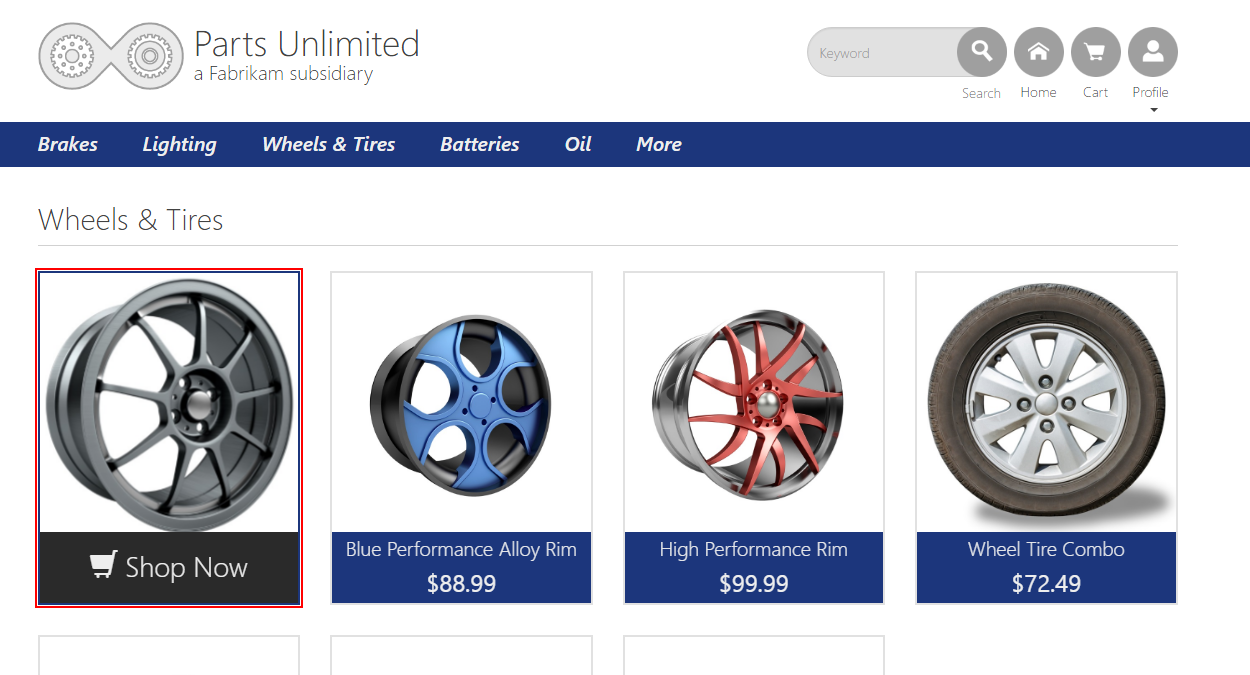
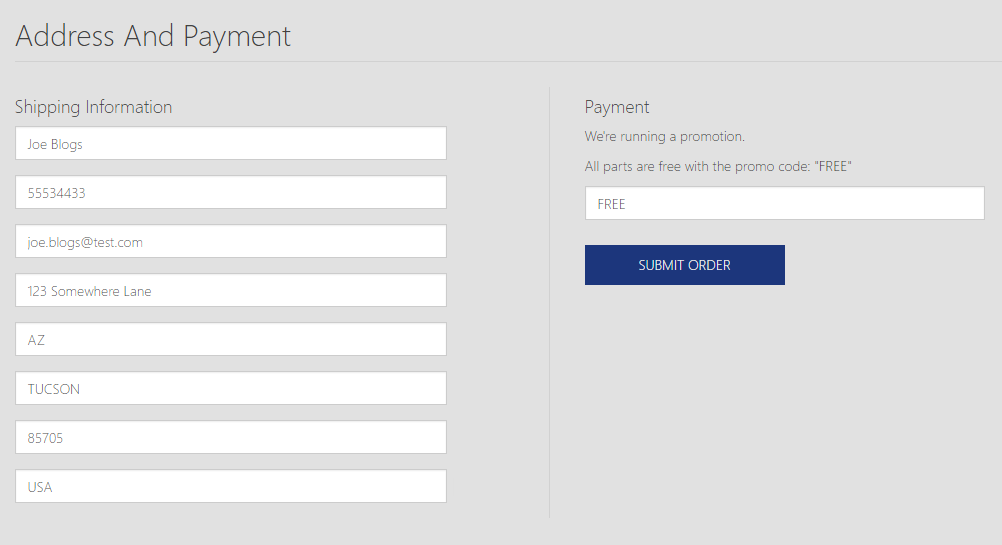
Select one of the products.
For the payment page, specify the ‘FREE’ promotional code to ensure the order goes through.
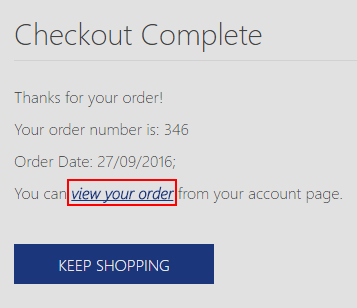
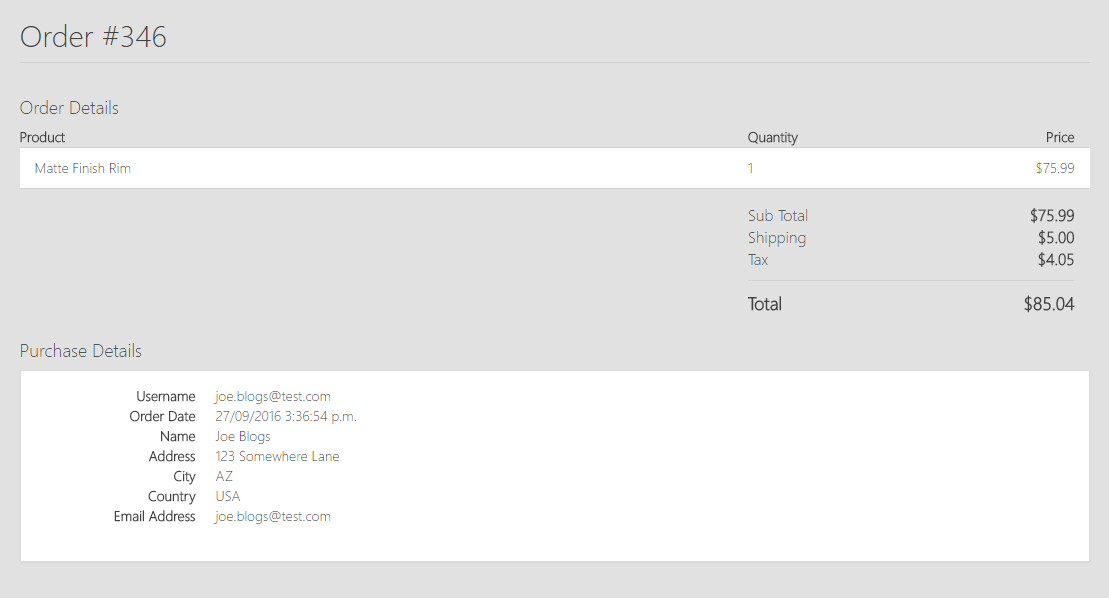
Now lets go check and make sure our order went through.
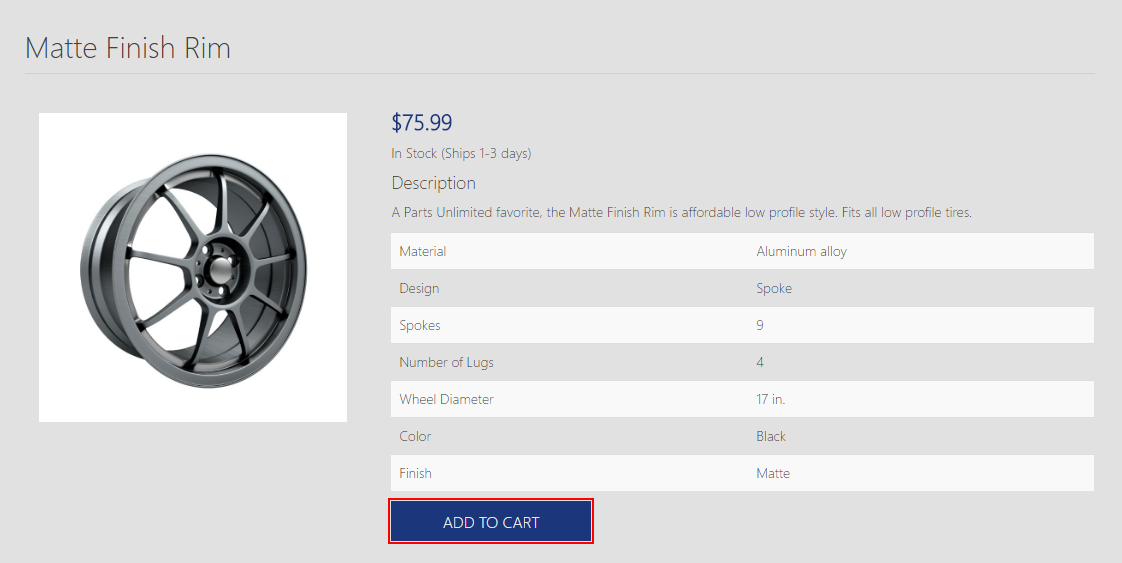
Now to trigger the remove product client side tracing. Add another product to your cart and then remove it.
Task 5. Build a custom query to view performance metrics and data
Once you have generated data to work with, this step will walk you through where this data can be found and how to query it.
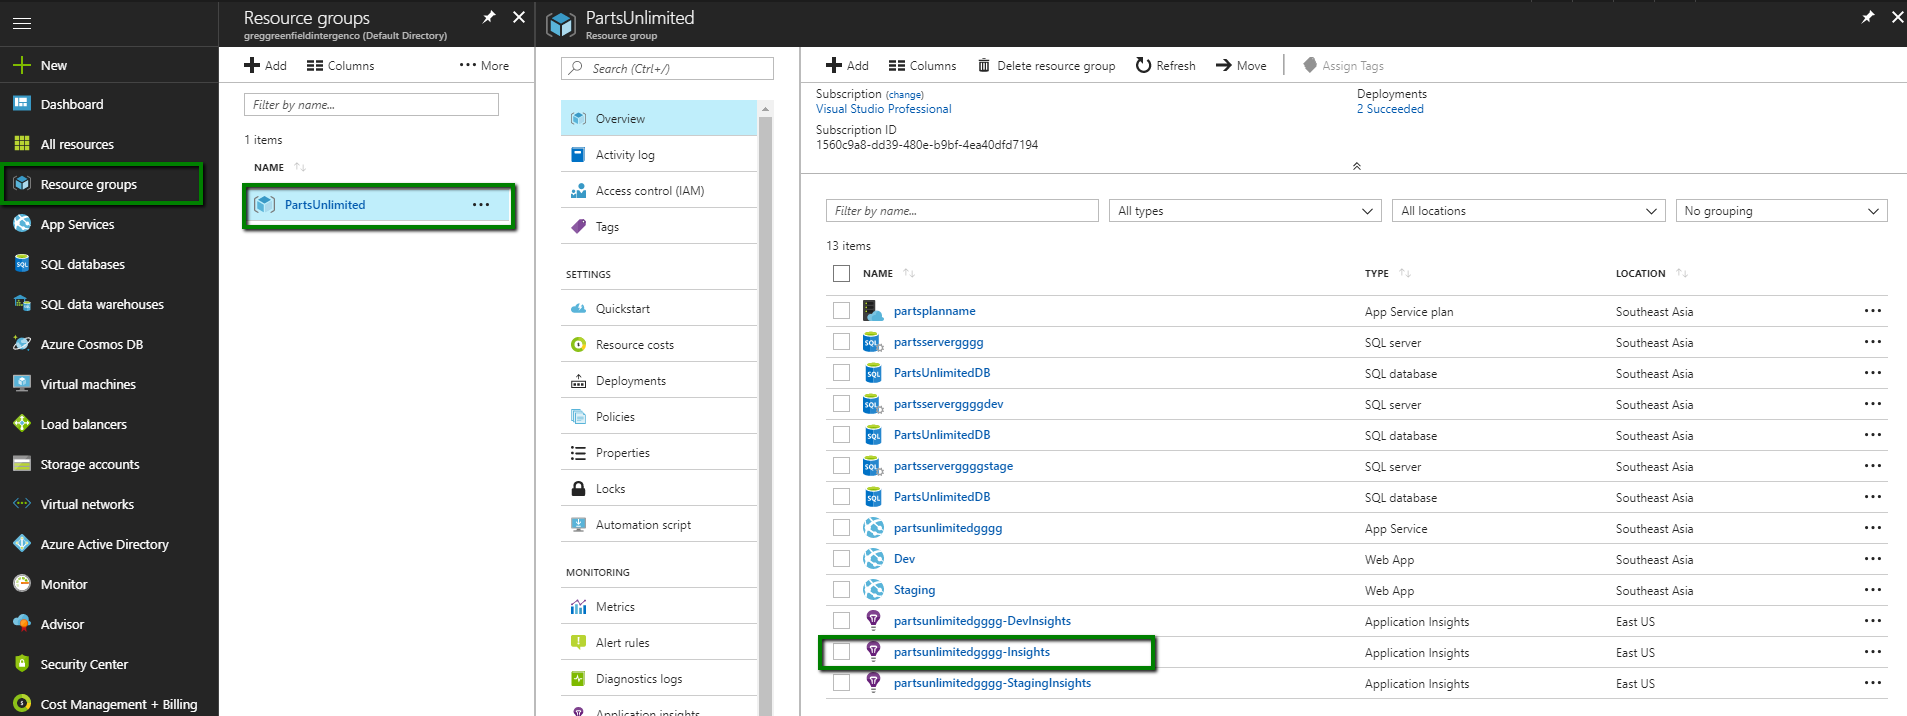
Step 1. Lets go back to the Azure portal, navigate to http://portal.azure.com and sign in with your credentials.
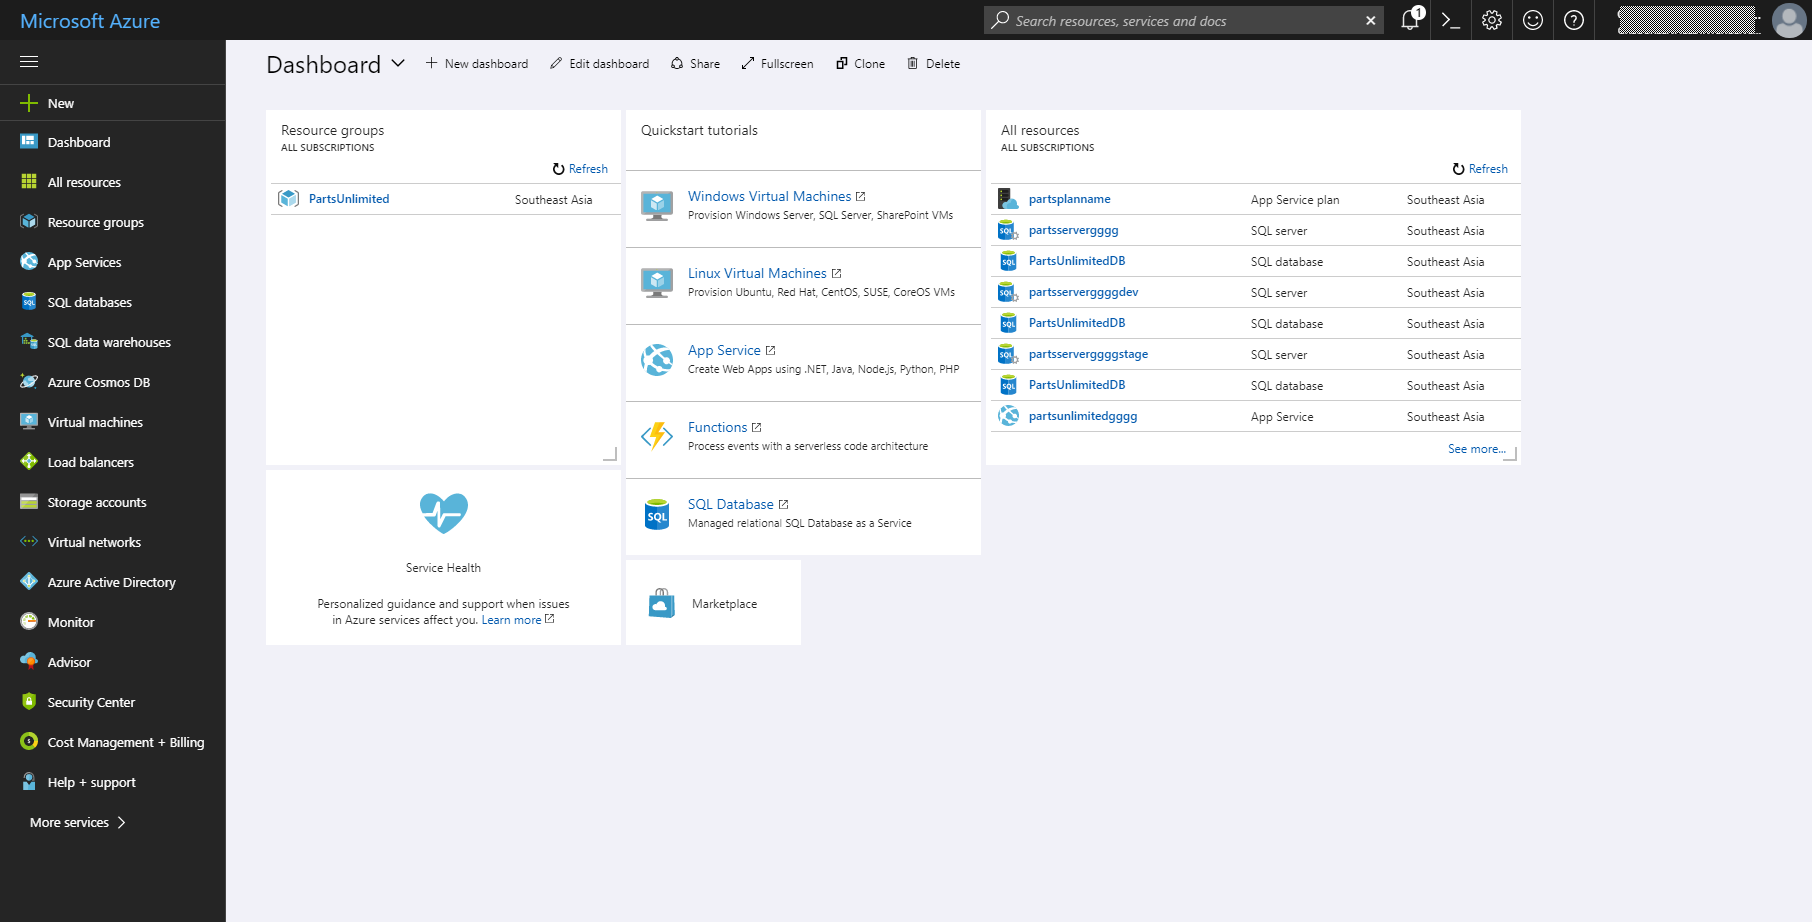
Step 2. Click on the Resource groups, then select the option you have for PartsUnlimited, and then select the option for the application insights that you have already setup.
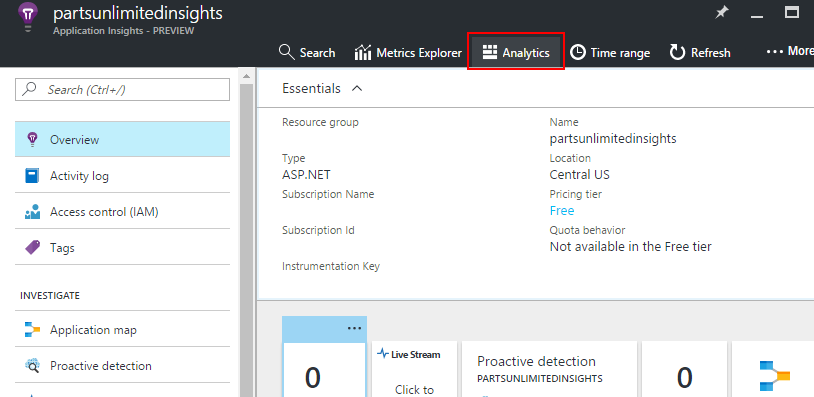
Step 3. Select the Analytics link in the portal
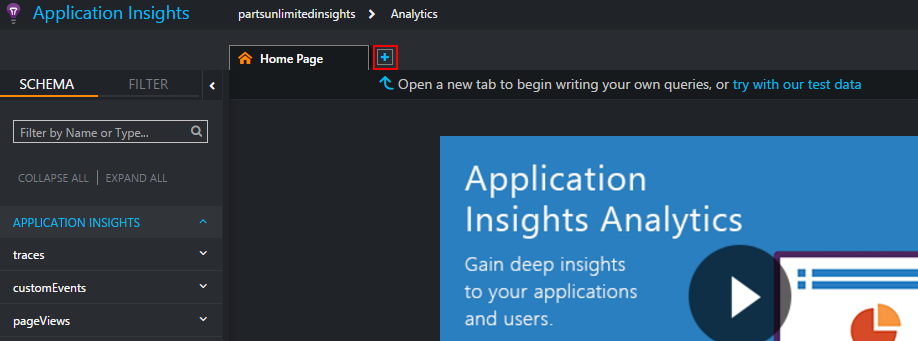
Step 4. Now we want to create a new query. Hit the ‘+’ icon as shown below.
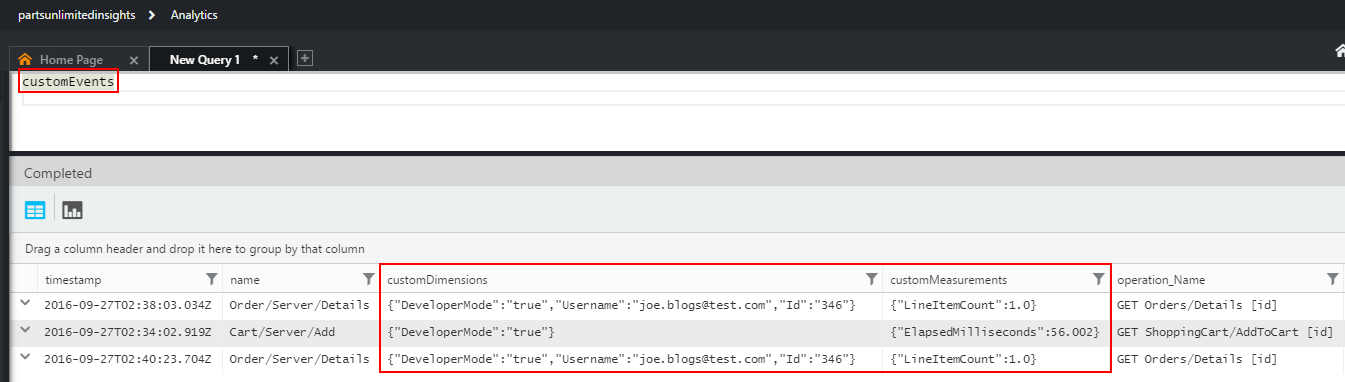
Step 5. Let us check and see if our analytics are pushing through from the application. In the query window simply type ‘customEvents’, then hit go. We can see the custom dimensions and measurements we sent through when navigating around the site.
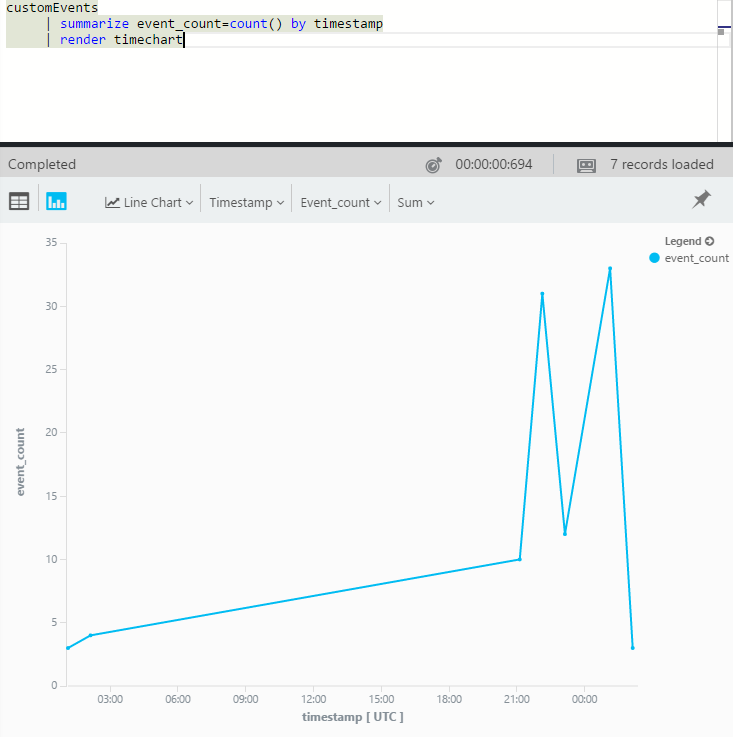
Step 6. Lets see the last couple hours of custom events on a line chart. Here we will use the ‘summarize’ function. This applies a specified aggregation function over groups of rows, in our case the aggregation function is to count the number of custom events ‘by’ the time they occurred. Then we simply use the render function and add the chart we want to be rendered.
customEvents
     | summarize event_count=count() by timestamp
     | render timechart
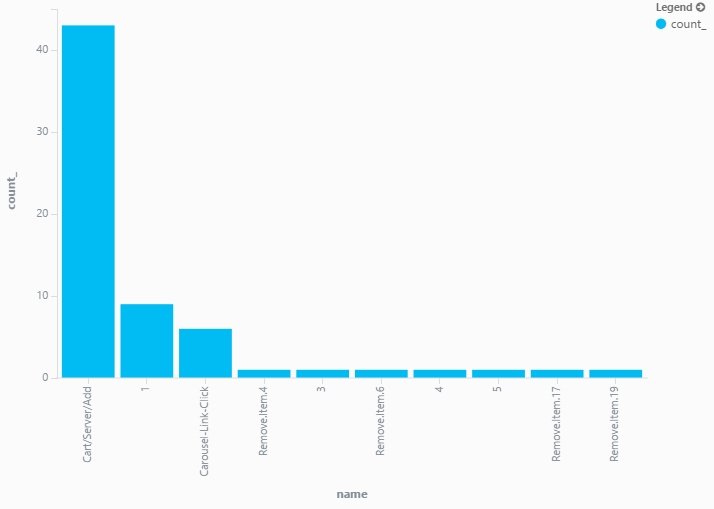
Step 7. Lets have a look at the top 10 custom events of our application. Copy and run the query below. This will filter the result set to the last 24hrs. It’s good practice to ensure query result sets are always filtered down to a manageable set. We then aggregate the event count by the time the events occurred. We then want to grab the top 10 results and render a barchart.
customEvents
 | where timestamp >= ago(24h)
 | summarize count() by name
 | top 10 by count_
 | render barchart
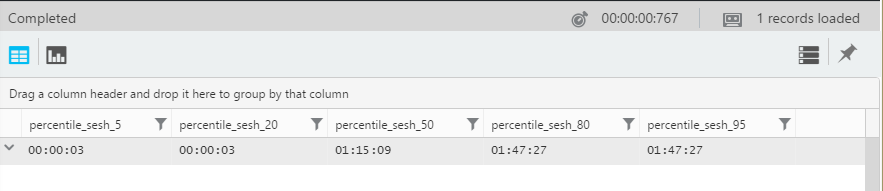
Optional Hardcore mode, skip this step if you don’t want to dive this deep! What if we want to find out the ranges of durations cover different percentages of sessions?
- Here we want to get all requests where a valid session id exists. This is to filter out requests unrelated to session data.
- We then want to perform the aggregate function of grabbing the min and max timestamp for each request.
- We leverage the ‘extend’ function to add columns to the existing ones. In the example below we are creating a new column called ‘sesh’ which is the subtraction of the summarized min and max values we got earlier in the query.
- We add an extra ‘where’ clause to filter out sessions that are under one second in length.
- We then perform another aggregate function of grouping the count of sessions by the rounded down (floor) value grouped in to three second ‘bins’
- We finally group the result set in to percentiles of 5, 20, 50 80 and 95.
requests
   | where isnotnull(session_Id) and isnotempty(session_Id)
   | summarize min(timestamp), max(timestamp) by session_Id
   | extend sesh = max_timestamp - min_timestamp
   | where sesh > 1s
   | summarize count() by floor(sesh, 3s)
   | summarize percentiles(sesh, 5, 20, 50, 80, 95)
Note you may see different data depending on the interaction you had with the application. From the data we can see that 50% of sessions lasted around 1 minute and 15 seconds. 5% of sessions lasted only 3 seconds! At the other end 5% of sessions lasted 1 minute and 47 seconds.
Summary
In this lab, you learnt how to get up and running with Application Insights. You also learnt how to leverage the power of the Analytics suite and build custom queries to gain insight in to how your application is running.