Monitor Wait Statistics By Using Power BI
Wait statistics are a measure of what Microsoft SQL Server spends time waiting for. Reducing waits is important in keeping performance high. Waits should be monitored regularly. Not all waits are relevant. In the following lab, you will use a common wait-stats query to produce a chart in Microsoft Power BI, to make it easy to visualize.
DevOps MPP Course Source
- This lab is used in course DevOps200.6x: DevOps for Databses - Module 4.
Prerequisites:
- No prerequisites
Lab Tasks:
In this lab, we will begin releasing our changes to downstream databases by using Azure SQL Database.
- Install Power BI Desktop
- Configure a Restricted Login
- Chart Wait Statistics Using Power BI
- (Optional) Publish a Wait Statistics Dashboard to Power BI
Estimated Lab Time:
- approx. 40 minutes
Task 1: Install Power BI Desktop
We will install Power BI Desktop if it is not already installed.
If you already have Power BI Desktop installed, just open it and skip this first task.
-
In a browser, open the Power BI portal at www.powerbi.com.

-
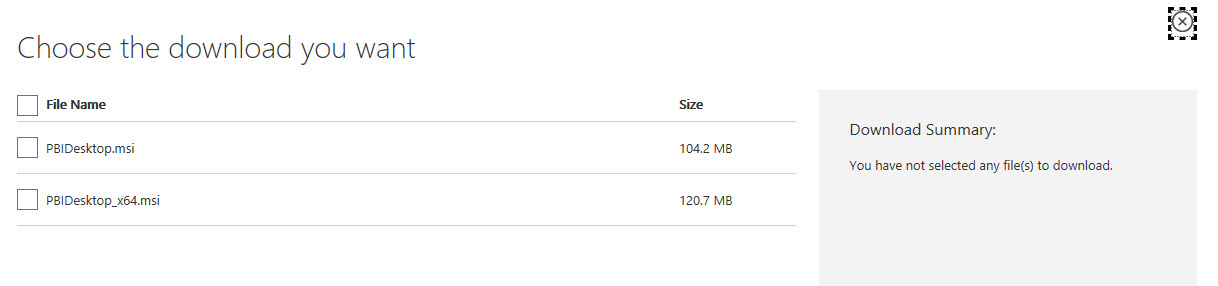
From the Products menu, click Power BI Desktop. On the download page, click Advanced download options, then on the page that appears, click Download.
-
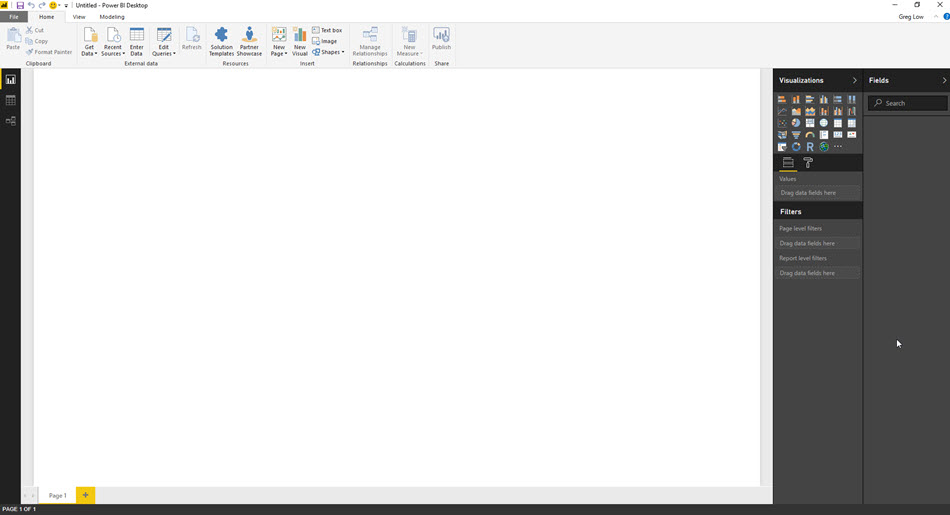
Download and install the version for your machine. (Use the x64 option for 64 bit systems). Then launch Power BI Desktop. If you have a Power BI account, click Sign In and then log on. (If you don’t have an account, consider returning to the portal and setting up a trial account).
Task 2: Configure a Restricted Login
We will create a login that has permission to view server state.
-
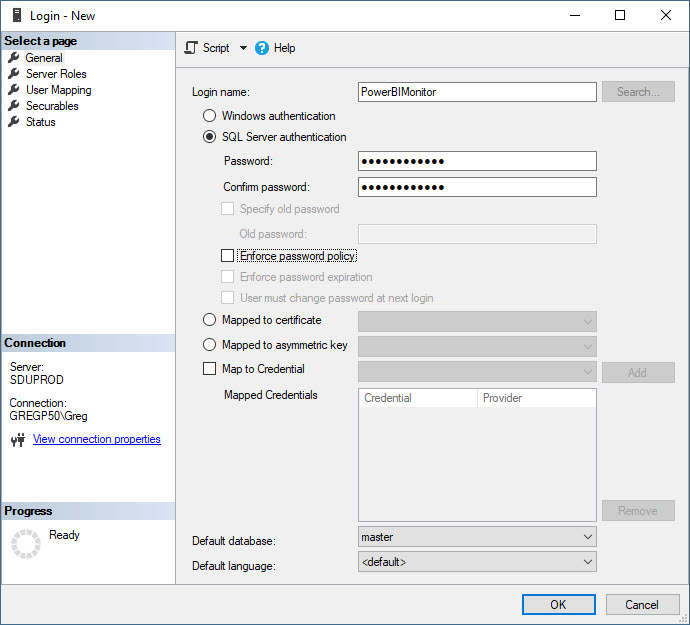
In SQL Server Management Studio, connect to your local server. In Object Explorer, expand Security (at the server level), right-click Logins, and click New Login. Assign the login name as PowerBIMonitor, set an appropriate password for SQL Server authentication, and clear Enforce password policy.
-
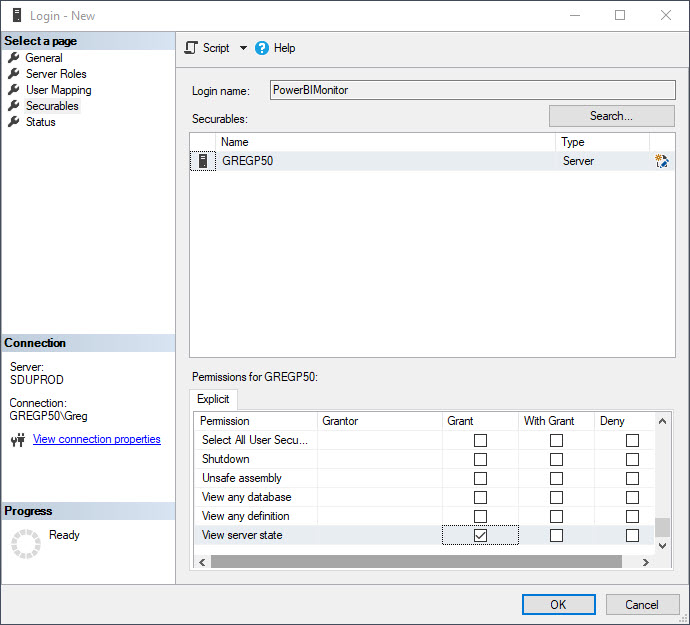
On the Securables page, click Search, then in the Add Objects pop-up, select your server, then click OK. In the Explicit permissions list, check the Grant column for View server state. Then click OK to create the login.
Task 3:Chart Wait Statistics Using Power BI
We will create a chart that shows SQL Server wait statistics using Power BI.
-
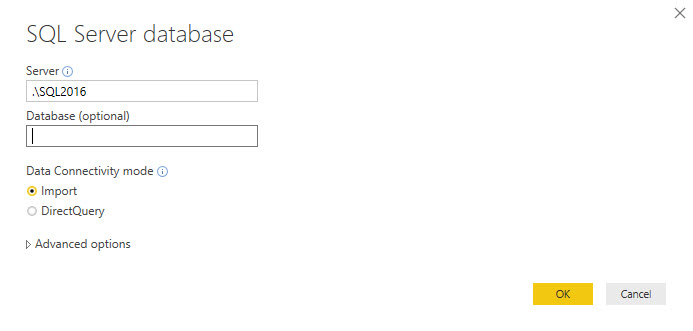
From the Get Data menu, click SQL Server. In the SQL Server database window, enter your server’s details, enter master for the database, and enter the copy the following wait stats query from the following webpage: https://www.sqlskills.com/blogs/paul/wait-statistics-or-please-tell-me-where-it-hurts/ (note: do not copy the batch separator word GO), then click OK.
There are many queries that can be used to retrieve wait stats. Paul Randal from SQL Skills has provided the one that is most commonly used at the time of writing. You could adapt this lab to use any other query that returns similar data.
-
When prompted for credentials, select the Database page, enter PowerBIMonitor for the User name, and the password that you assigned to the user, then click Connect.
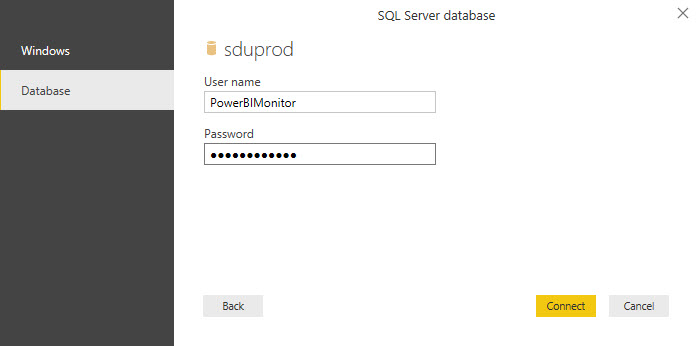
If prompted about encryption support, click OK.
-
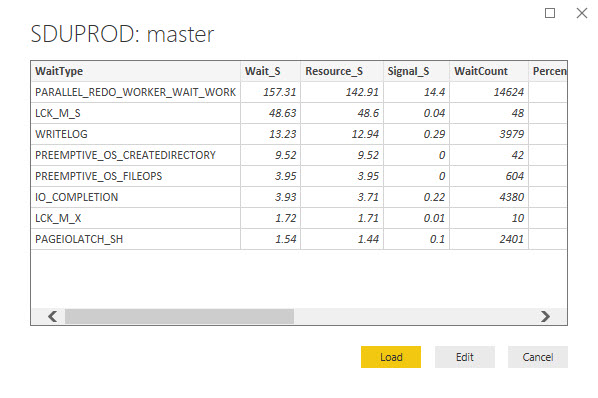
When the query preview appears, click Edit.
-
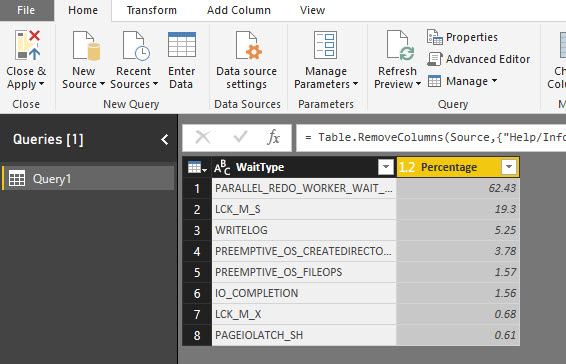
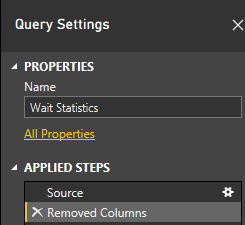
In the Query Editor (separate window that should open), click to select the column heading for WaitType. While holding the Control key, also select the Percentage column, right-click it, and click Remove Other Columns. You should be left with just two columns.
-
In the Query Settings pane, change the Name to Wait Statistics.
-
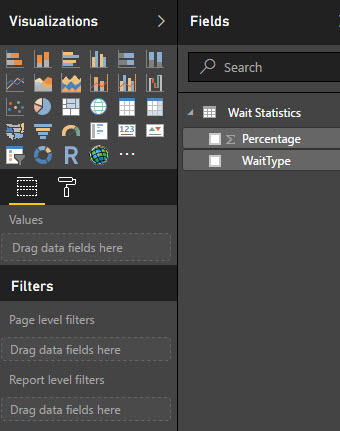
From the Close & Apply drop-down list, click Close & Apply. Your Fields list should then show the fields from the query that you have configured.
-
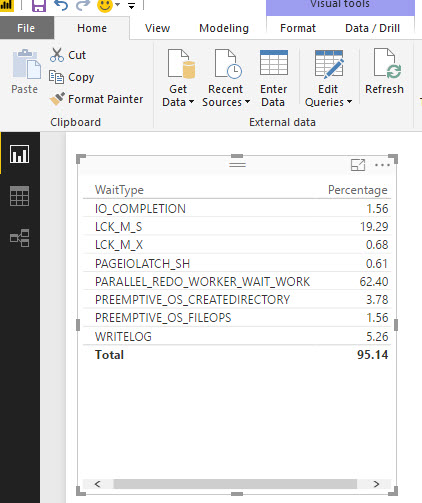
Check the check box beside WaitType, then also check Percentage. A table of waits should appear. (The values shown will differ depending upon your server)
-
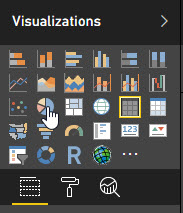
Make sure the table of waits is selected, then in the Visualizations section, click Pie chart.
-
Drag the chart to increase its size until it occupies about half the screen. From the File menu, click Save. Choose an appropriate folder, set the File name to CurrentServerWaits, and click Save.
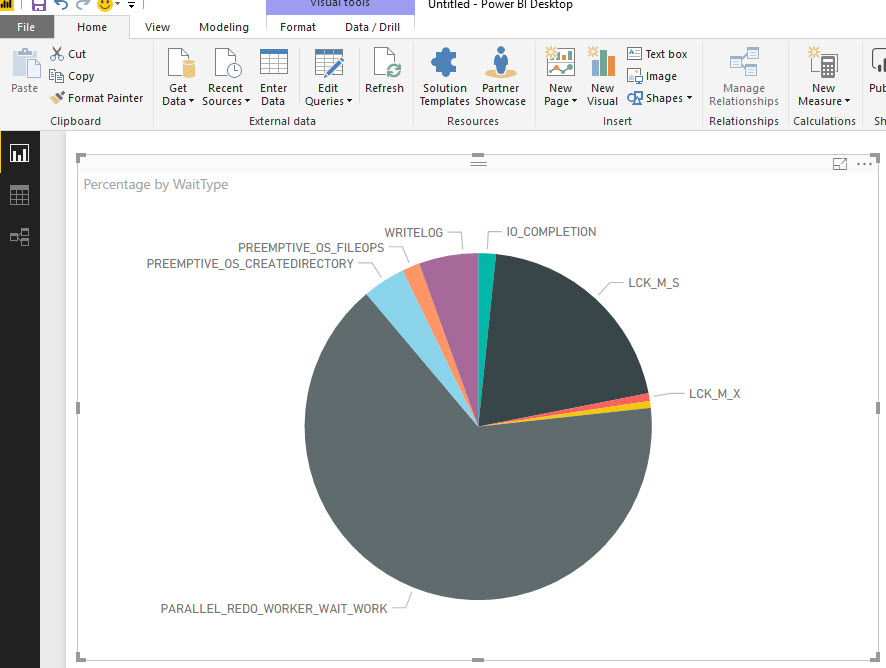
-
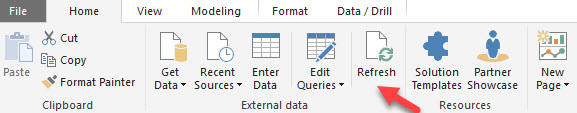
Note that the data can be refreshed by clicking Refresh on the toolbar.
Task 4: (Optional) Publish a Wait Statistics Dashboard to Power BI
We will publish the dashboard to Power BI and view it on a phone, tablet, or PC.
-
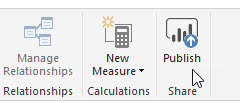
If you have signed onto Power BI, click Publish in the toolbar.
-
When the Publishing to Power BI window indicates success, click Got it.
-
Log on to the Power BI site.
-
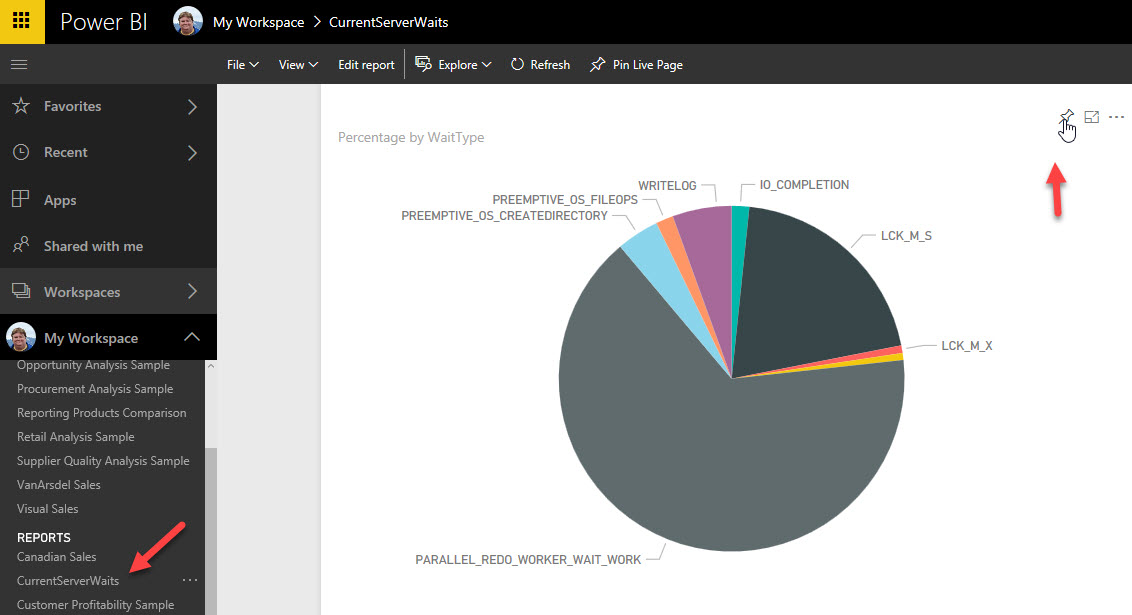
In the left-hand pane, expand My Workspace (if necessary).
-
You should see CurrentServerWaits in your REPORTS list. Click to select it, then in the top right of the report, hover until the Pin Visual option appears. Select it.
-
In the Pin to dashboard window, configure the options as follows, then click Pin.
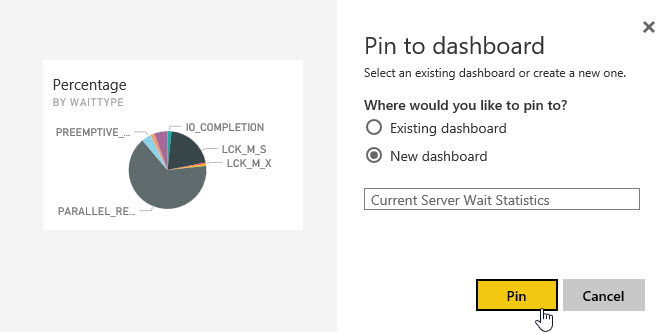
-
In the left-hand pane, select the Current Server Wait Statistics entry in the DASHBOARDS section.
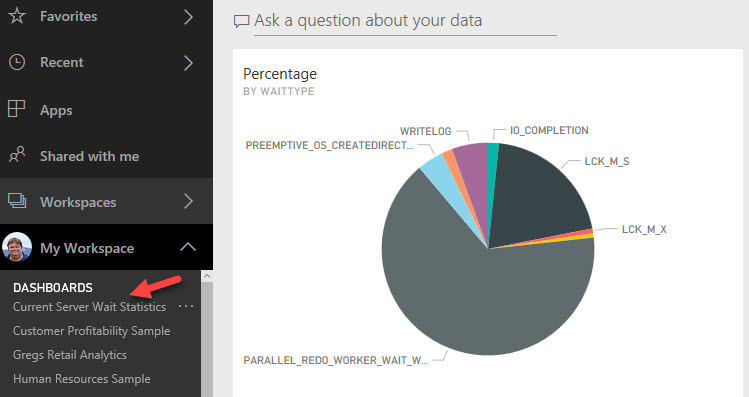
-
Note that natural language query would also work with this data. Click Ask a question about your data, and enter the following query:
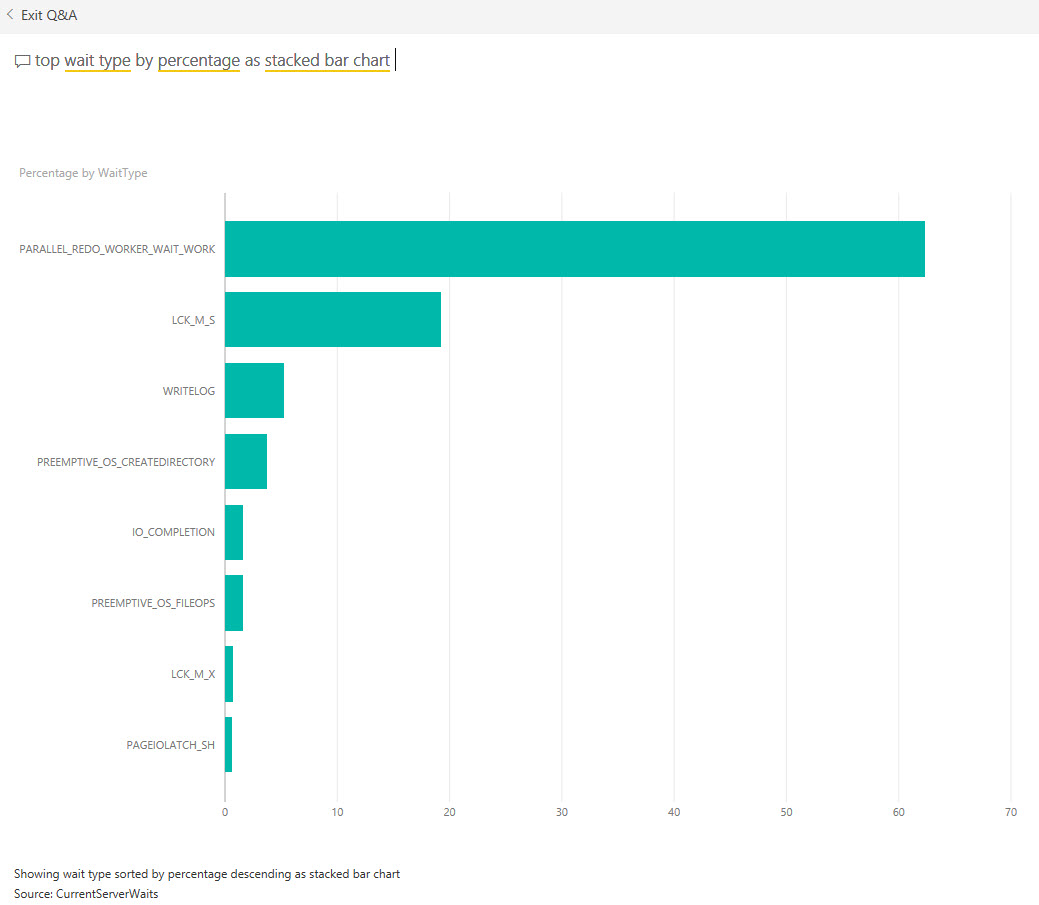
-
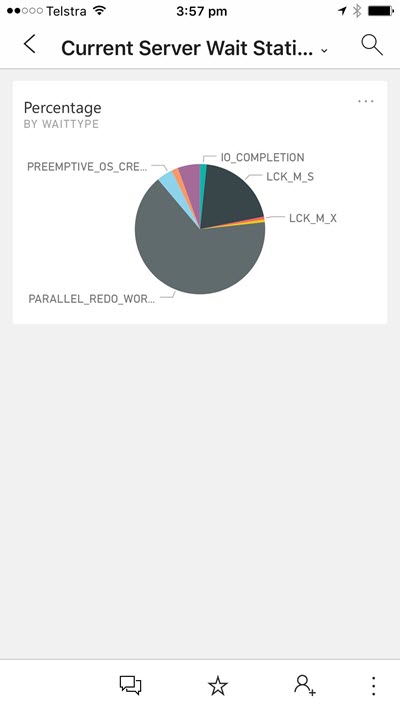
If you have a phone connected with the Power BI app, browse the dashboard on the phone.
Final thoughts
We have published static data. If you want this data to periodically refresh, you would need to do the following additional steps (not described here):
- Install the Power BI Gateway (certificate based and secure). Details are here: https://powerbi.microsoft.com/en-us/documentation/powerbi-gateway-getting-started/
- Configure the Gateway to provide this data source.
-
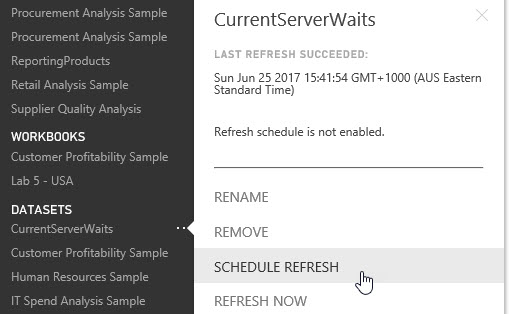
Schedule the query to refresh periodically. (In the DATASETS section in the Power BI portal, choose the SCHEDULE REFRESH option.)
Summary
In this lab you have completed the following tasks:
- Installed Power BI Desktop
- Configured a Restricted Login
- Charted Wait Statistics Using Power BI
- (Optional) Published a Wait Statistics Dashboard to Power BI