
TIP
🔥 Checkout our new Azure Developer page at azure.com/developer (opens new window).
📺 Watch the video : How to query Azure Storage logs in Azure Monitor Log Analytics (opens new window).
💡 Learn more : Overview of log queries in Azure Monitor (opens new window)
# Query Azure Storage analytics logs in Azure Log Analytics
Azure Storage (opens new window) is one of the fundamental services in Azure that you probably use for a lot of different things in your applications. In Azure Storage, you can enable diagnostics logs, to be able to understand which operations where executed against the items in your storage account and how that went.
You can visualize the diagnostics logs in the Metrics menu of Azure Storage. This enables you to create charts from the metrics in the diagnostics logs. This is great, however, there isn't a way to query the data to actually analyze the logs out-of-the-box. We can use a slightly more complicated solution to query the diagnostics logs, by loading them into Azure Log Analytics. Let's take a look at how to do that.
# 1. Enable Azure Storage Diagnostics logs
To capture diagnostics from Azure Storage, we first need to enable diagnostic logging. This is very easy to do.
- In The Azure portal, in your Azure Storage account, go to the Diagnostic logs (classic) menu
- Per storage service that you want to enable diagnostics for (Blob, File, Table or Queue), turn the Status to On
- Choose which metric you want to log and if and when you want to delete the log data (note that it doesn't cost anything to store diagnostic log data)
- Click Save
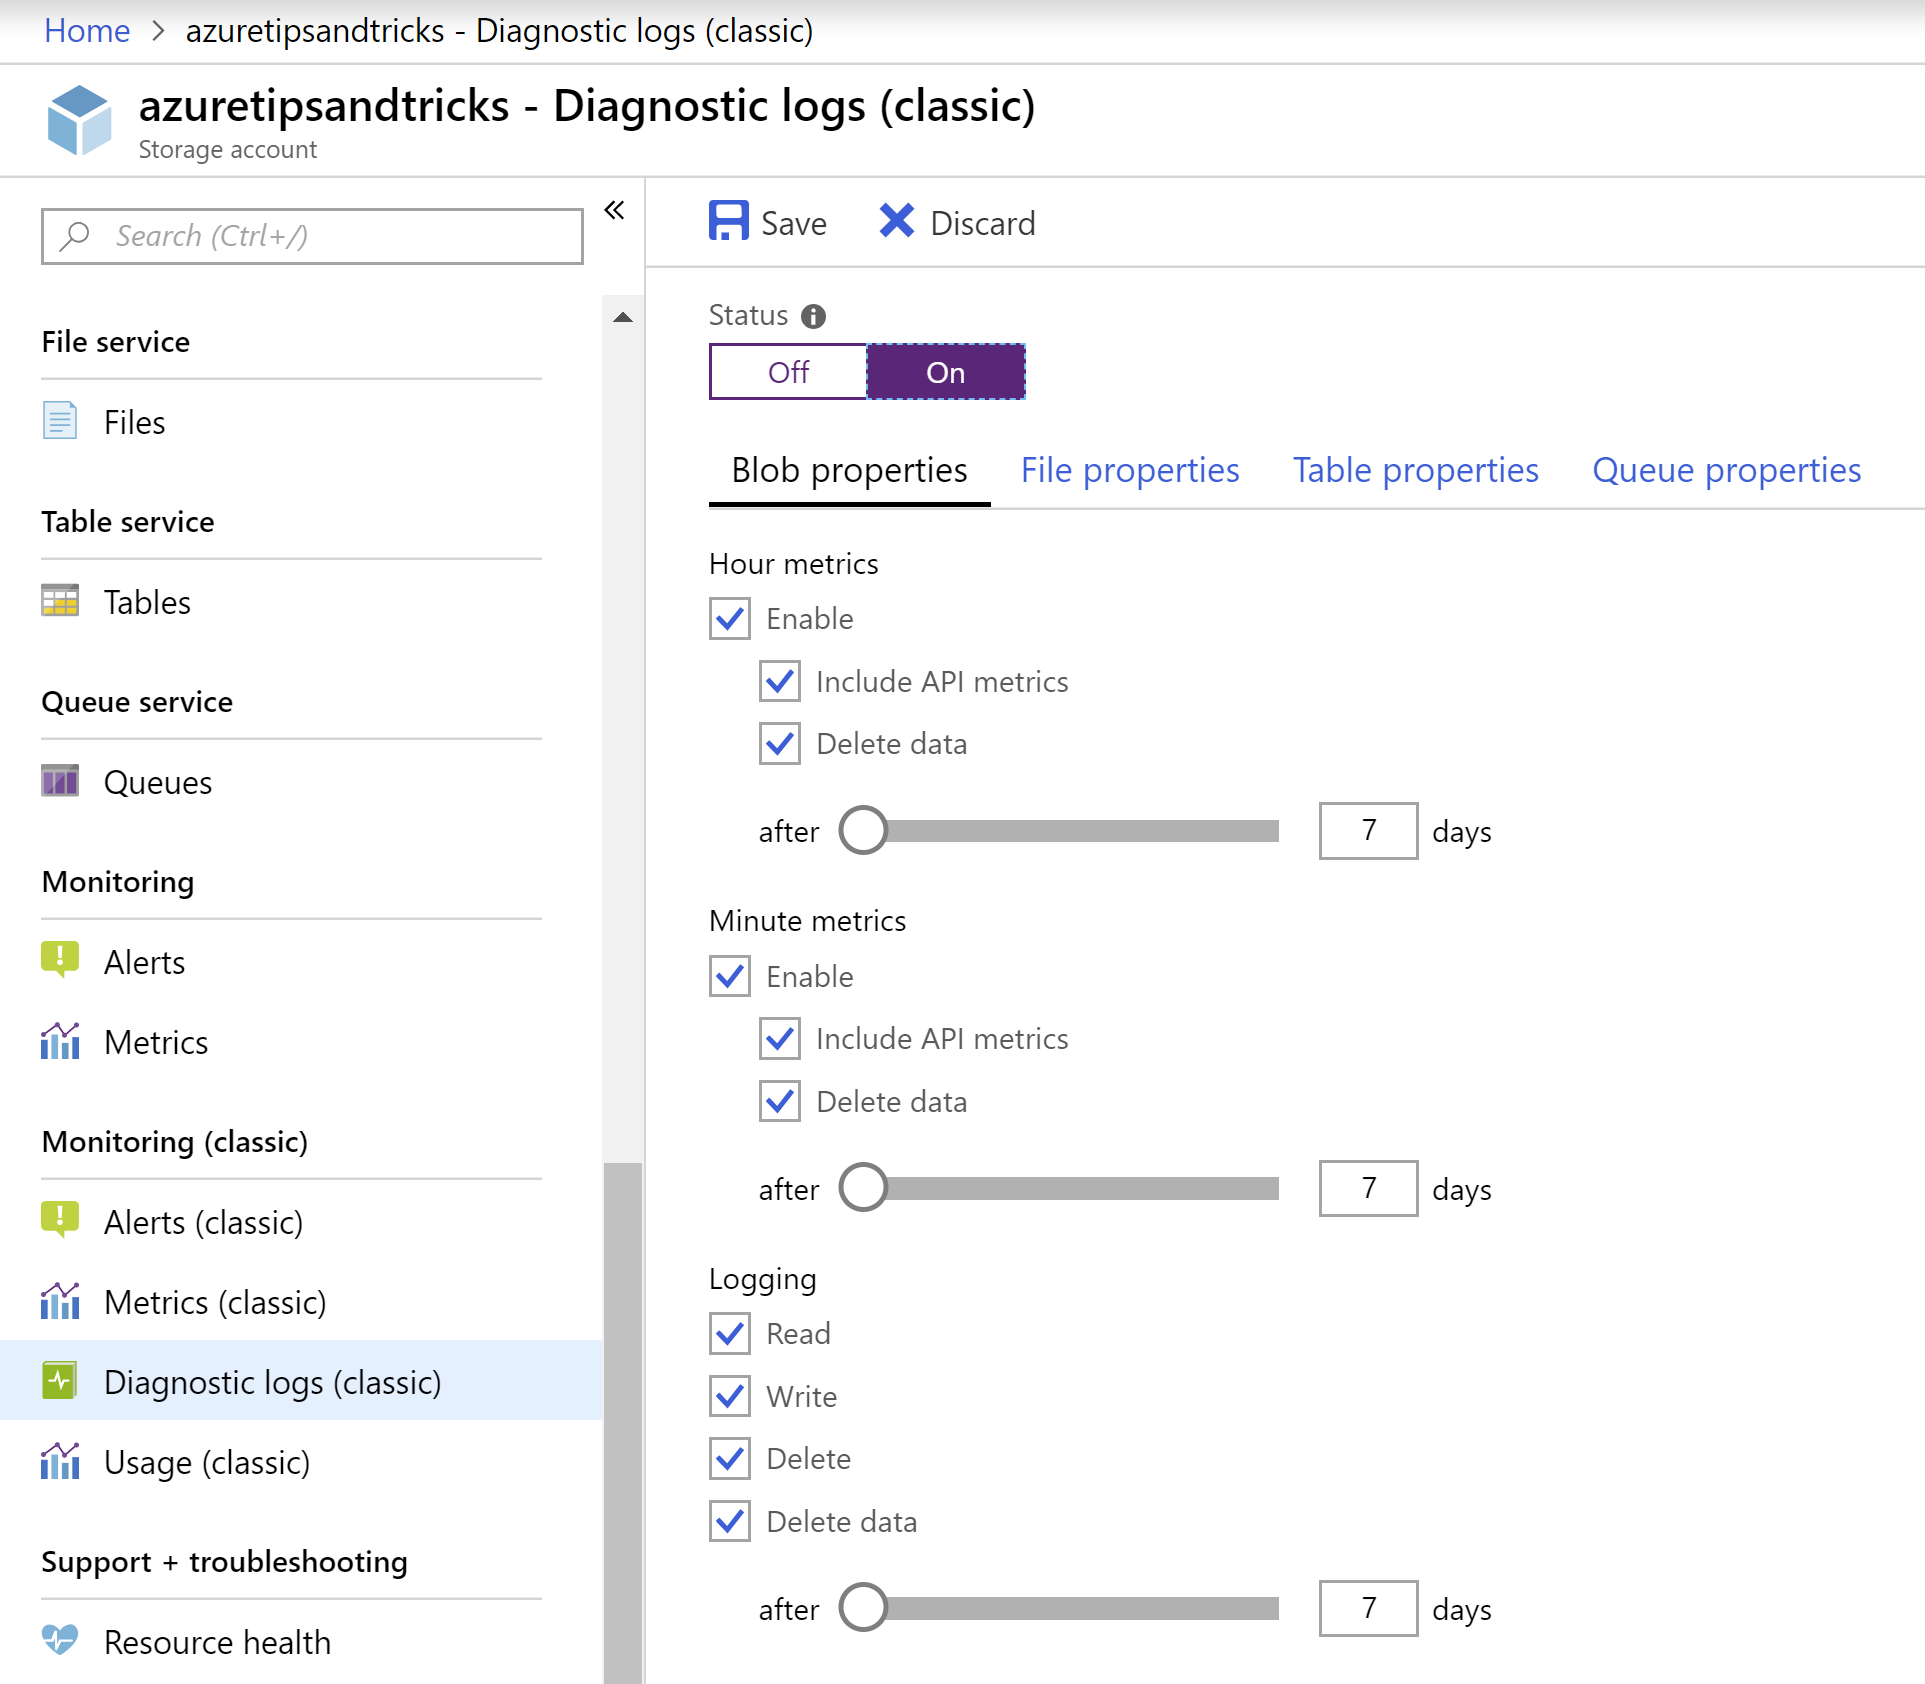
(Enable Azure Storage diagnostic logs in the Azure portal)
You can now see the logs in the Azure Storage Explorer (opens new window). For instance, when you've enabled logging for Blobs, the logs will appear in a $logs container and are organized in folders that represent the log date. When you drill down on them and open a log file, you can see that each log entry is written as a separate line and that its values are separated by semicolons.
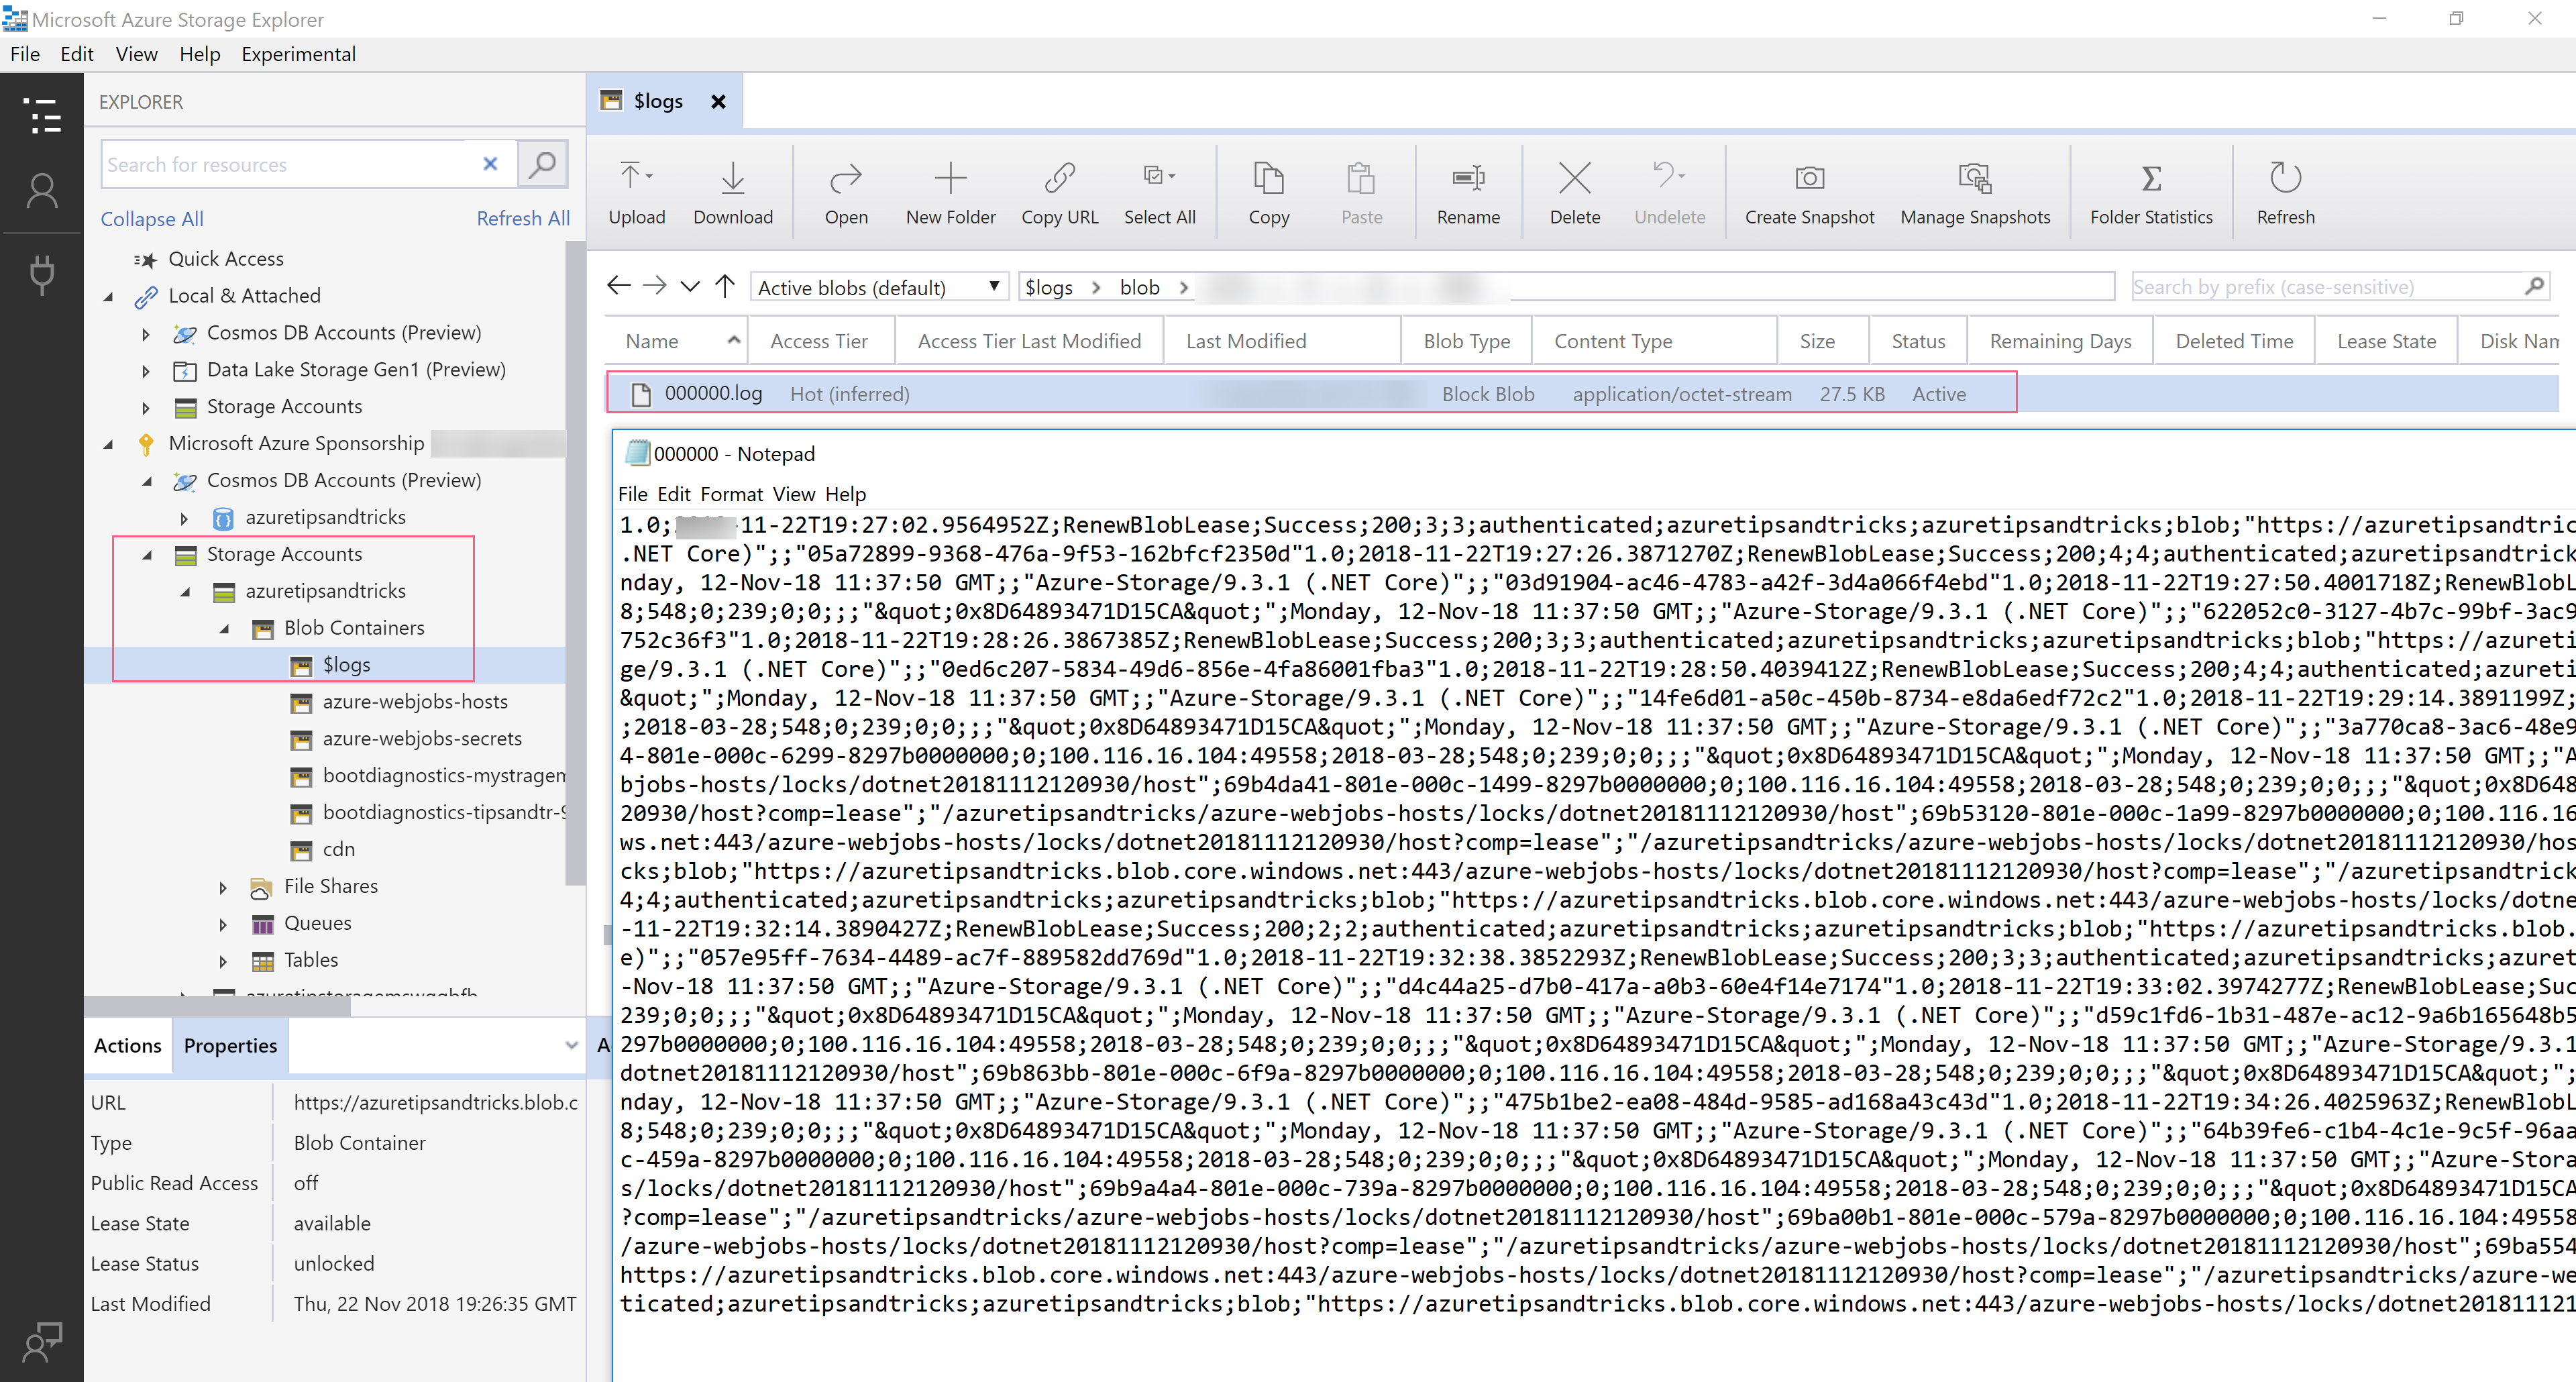
(Blob storage diagnostic logs in the Azure Storage Explorer)
# 2. Create a Log analytics workspace
Now that we have logs in Azure Storage, let's create a Log Analytics workspace to load them into and query them.
- In the Azure portal, click on the "Create a new resource" button (the green plus sign in the top-left corner)
- Search for "log analytics"
- The search results will now show Log Analytics workspace. Click on it and click on Create
- The Create Log Analytics workspace blade shows up
- Fill in the name of a new or existing OMS workspace (Log Analytics is part of the Operating Management Suite, or OMS)
- Pick or create a Resource group
- Pick a Location
- Click OK to create the Log Analytics workspace
(Create a new Log Analytics workspace in the Azure portal)
# 3. Load the Azure Storage diagnostic logs into Log Analytics
Azure Log Analytics is a place where you can connect all sorts of services and diagnostic sources to, in order to monitor and analyze them. Out-of-the-box, you can connect most Azure resources to Log Analytics, including Azure Storage. However, at the time of writing this post, there is no out-of-the-box option to load the diagnostics logs into Log Analytics, so we have to do that ourselves.
We can load custom data into Log Analytics using the HTTP Data Collector API (opens new window). But before we do, we need to convert the diagnostic logs into JSON format, as that is what the API expects. Luckily, there is a PowerShell script that we can use for that. This PowerShell script (opens new window) downloads the logs from Azure Storage, converts them into JSON and uploads them to Azure Log Analytics.
Before you execute the PowerShell script, you need to fill in the parameters that it needs. The script explains in detail what you need to fill in. You can execute the script locally or in the Azure Cloud Shell (opens new window). You can use the Azure Cloud Shell from any OS, including from Mac OS, you just need a browser and an Azure subscription. And once you do, it starts downloading the logs, converting them into JSON and uploading them. This can take a while, depending on how many log files you have.
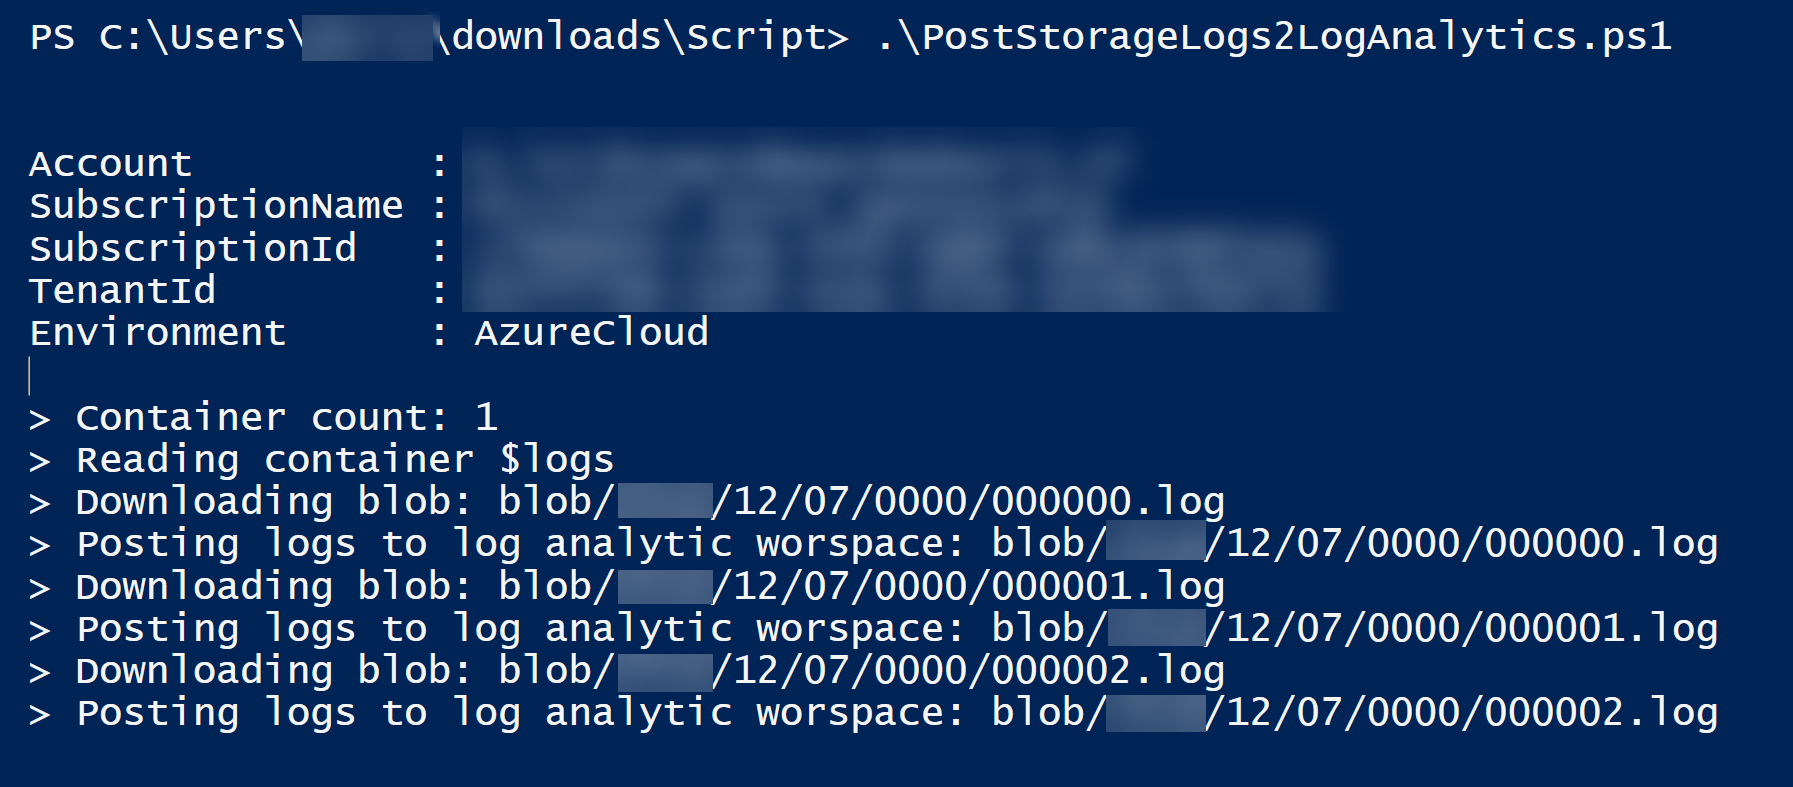
(Execute the PowerShell script)
# 4. Query the diagnostic data in Azure Log Analytics
Now that all of the data is in Azure Log Analytics, you can take advantage of its ability to query data.
- In the Azure portal, in your Azure Log Analytics workspace, click on the Logs menu
- Here, you can create queries that analyze logs within Log Analytics. Our custom logs are saved in the MyStorageLogs1_CL log stream. Create a query like this:
MyStorageLogs1_CL
| where request_start_time_t > datetime("2019-11-21")
| where request_start_time_t < datetime("2019-11-23")
| where request_status_s != "Success"
| project request_start_time_t, request_status_s, operation_type_s, request_url_s
2
3
4
5
This query gets all of the operations that weren't successful within a certain time slot.
- Click Run to get the results
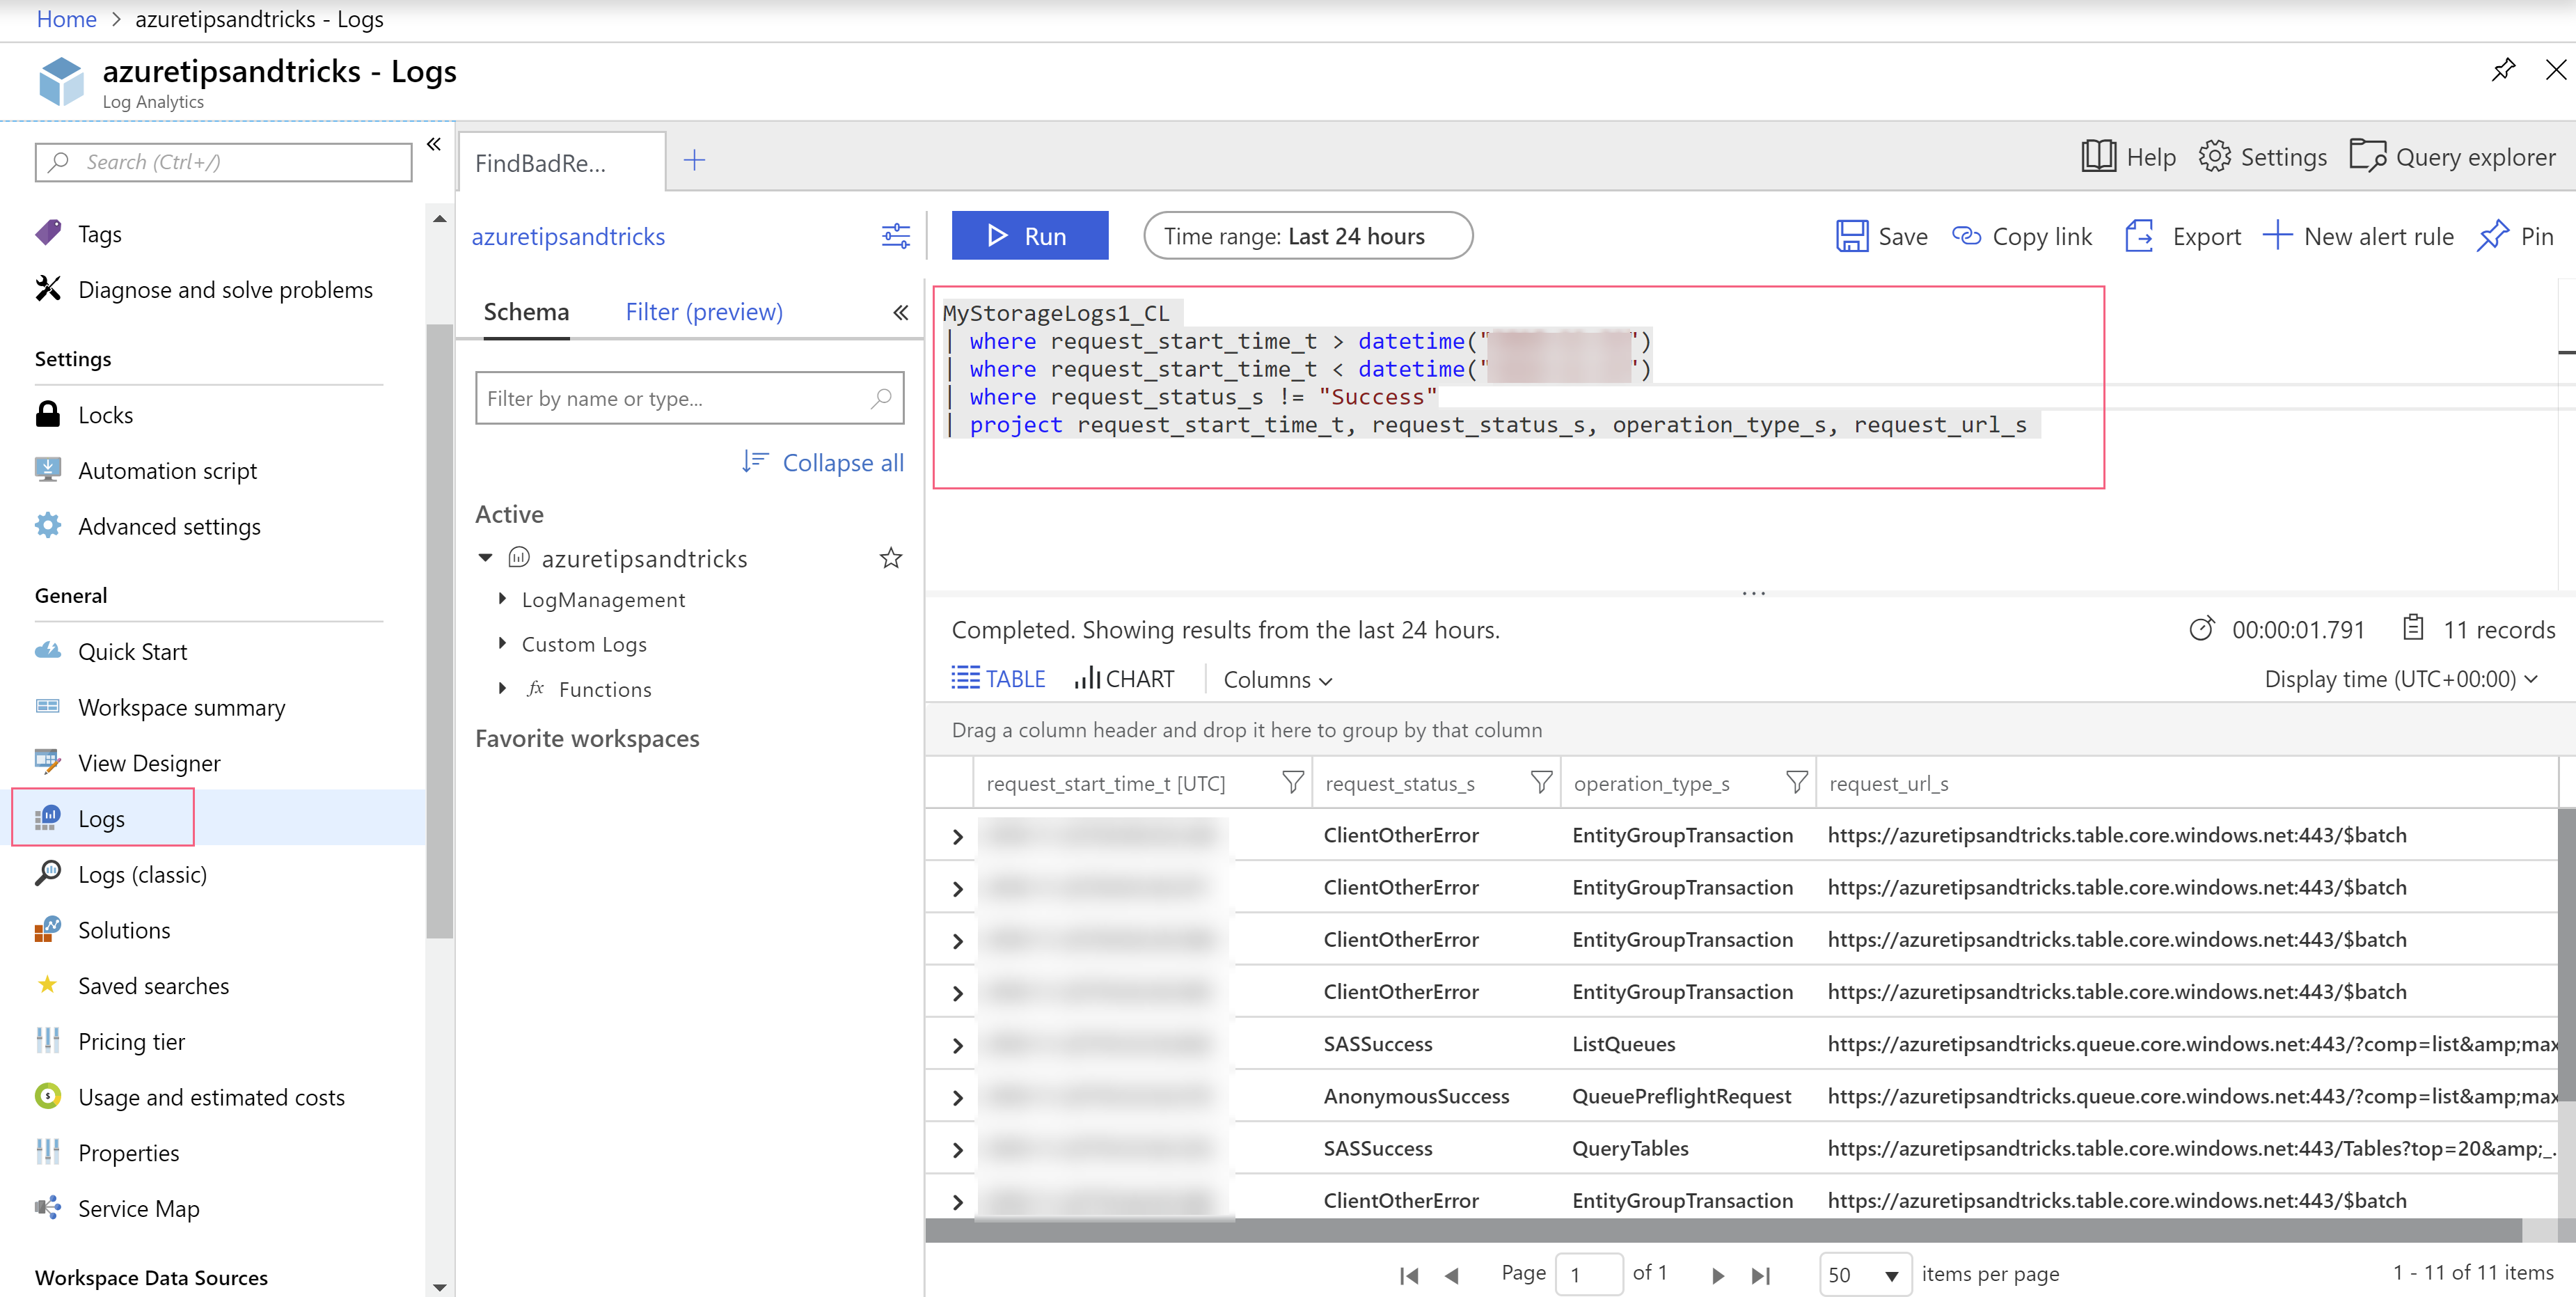
(Query log data in Azure Log Analytics in the Azure portal)
You can see the results as a list or render them into a chart (which requires you to include other columns in the results, like a number of total requests).
# Conclusion
Azure Storage diagnostic logs contain a lot of valuable information, which isn't easy to extract without the right tools. When you use the querying capabilities of Azure Log Analytics, you can get valuable insights about Azure Storage, which you wouldn't get otherwise. Unfortunately, loading the storage logs into Log Analytics is a bit clumsy and requires a custom script. In the future, the logs might be a first-class citizen that can be connected to Log Analytics directly. For now, just follow the steps above. You can also automate running the script, by running it, let's say, every 24 hours using an Azure Logic App, so that you have the latest logs in Log Analytics every day. Go and try it out!