What’s new in R Tools for Visual Studio 0.3 (May, 2016 release)
There are new features in 0.3 that we would like you to try out and give us feedback on, in addition to numerous bug fixes. This page summarizes what’s new.
Package Manager
The Package Manager is a UI for working with packages. It has three tabs, which let you browse, install, and visualize the list of loaded packages in your R session.
Installed Packages
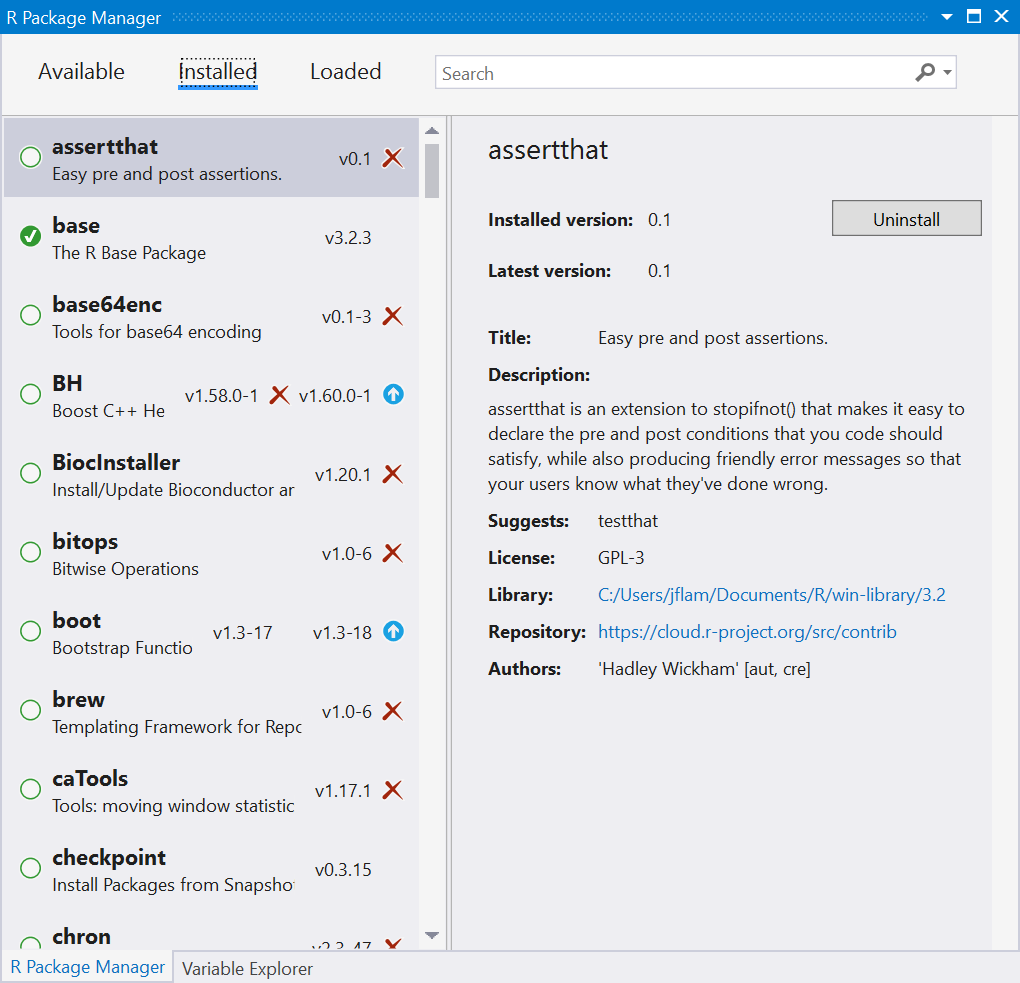
The default tab is the Installed Packages tab, which provides a list of all installed and loaded packages. If there is a green dot next to a package, it indicates that the package is also loaded into your R session.
Installed packages can also be uninstalled by clicking on the red “x” to the right of each listed package. The presence of a blue up arrow to the right of each installed package indicates that there is a newer version of your currently installed package. You can click on that arrow to download that package.
Available Packages
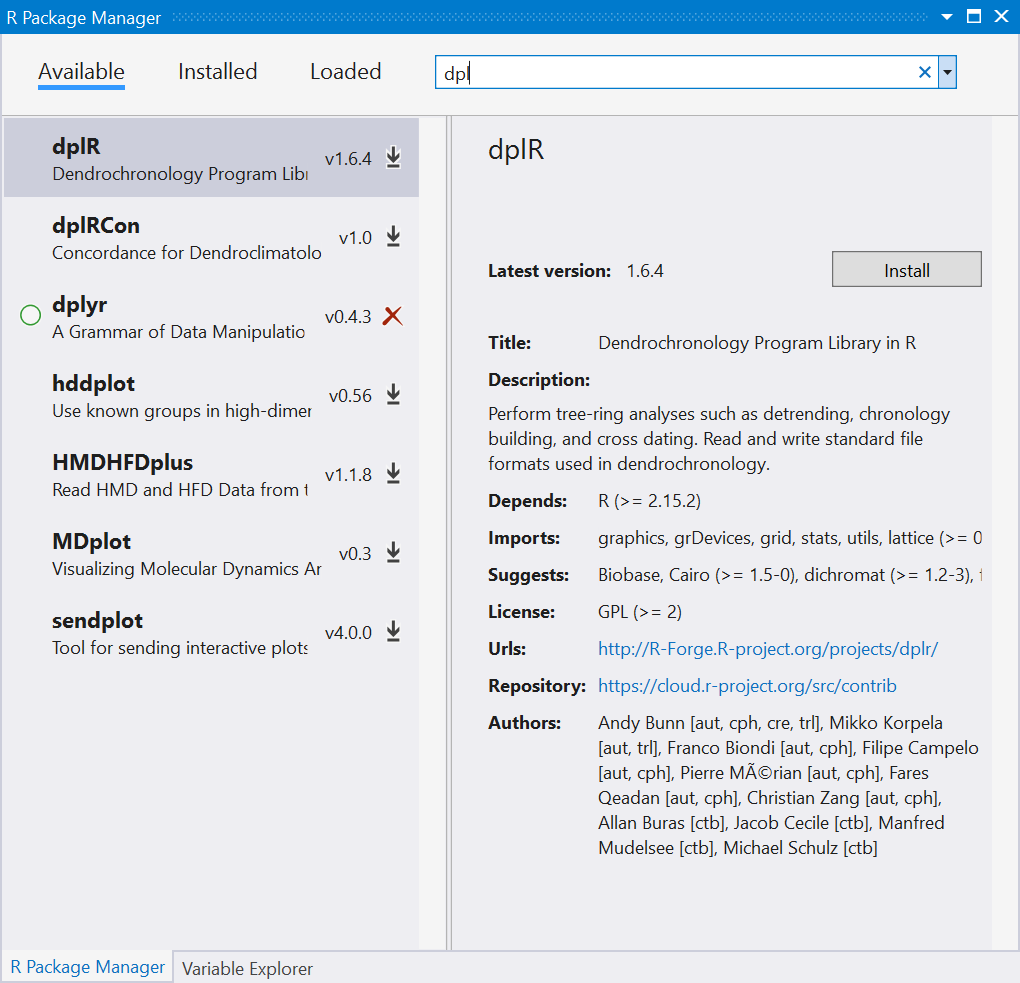
The Available Packages tab lets you browse and search for packages. You can use the search box in the top-right corner to filter the list of available packages by name. When you select a package, the right hand pane provides you with some summary information about the package, along with hyperlinks to let you read more about the package before installing it.
Loaded Packages
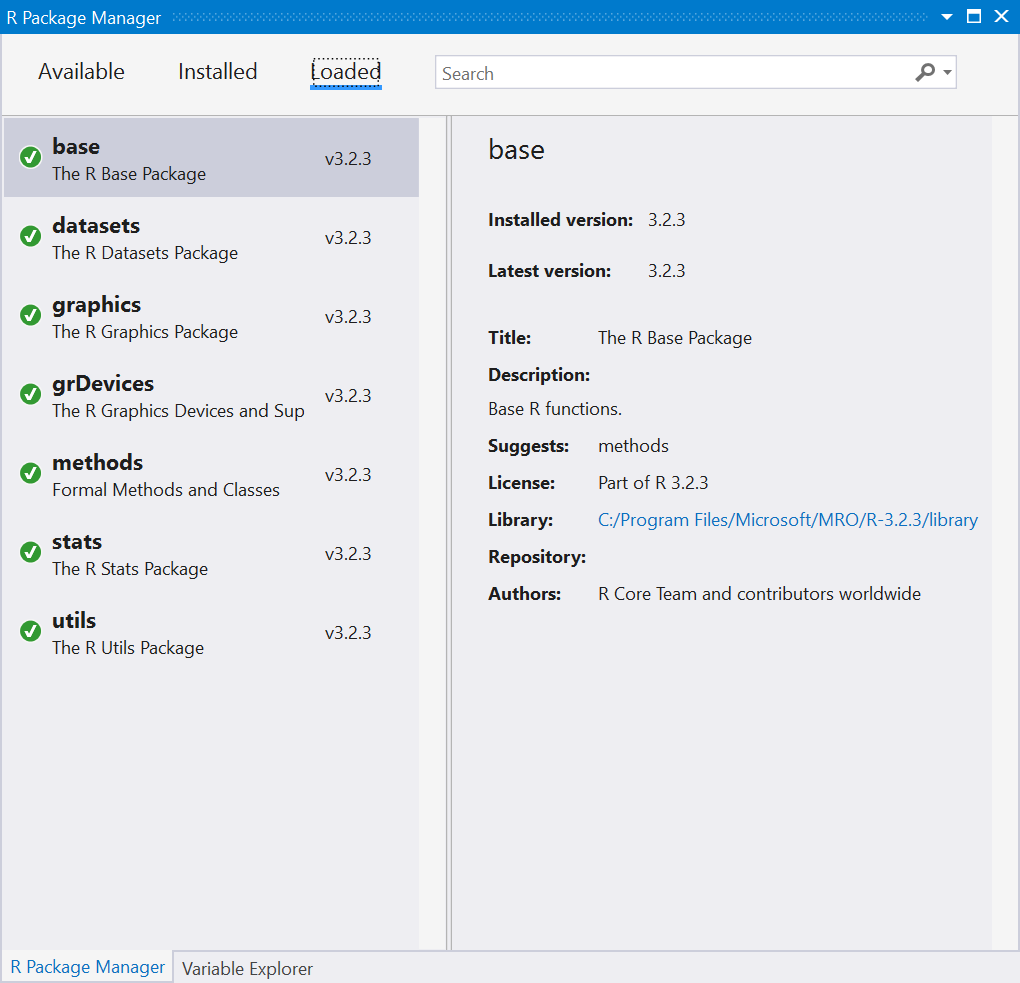
The Loaded Packages tab lets you examine all of the packages loaded into your R session. All of the packages on this tab should have a green dot next to them which indicates that they are loaded. You can also see details about the package along with the path to where the package is installed on your machine.
Editor
We have made a lot of new improvements to the editor in this release.
IntelliSense improvements
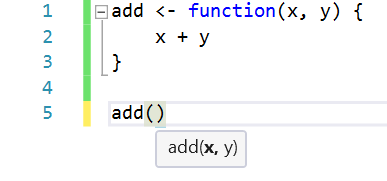
The editor now supports IntelliSense for user-defined functions in the same file:
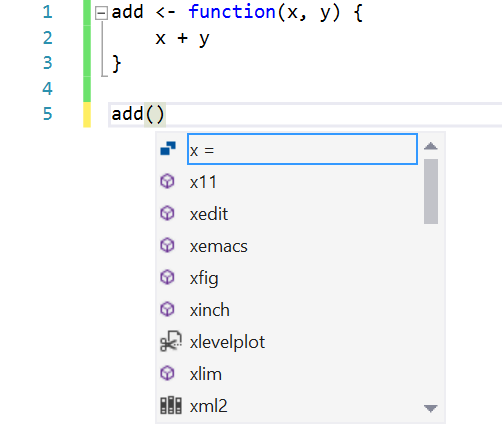
IntelliSense also assists in named parameter completion for functions defined in the same file:
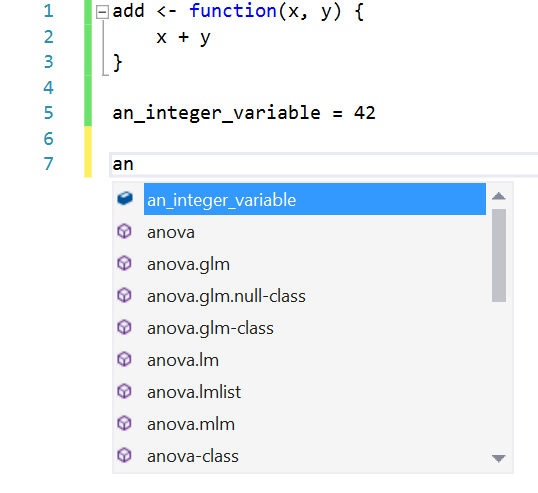
This also works for variables defined in the file:
Code Snippets
Perhaps the biggest everyday productivity boost that you’ll get in Preview 0.3 is Code Snippets. These are pieces of code that expand when you type the code snippet (which appears in the IntelliSense list) and press TAB.
Some simple examples:
- type =TAB and VS expands to the <- assignment operator.
- type >TAB and VS expands to the %>% pipe operator
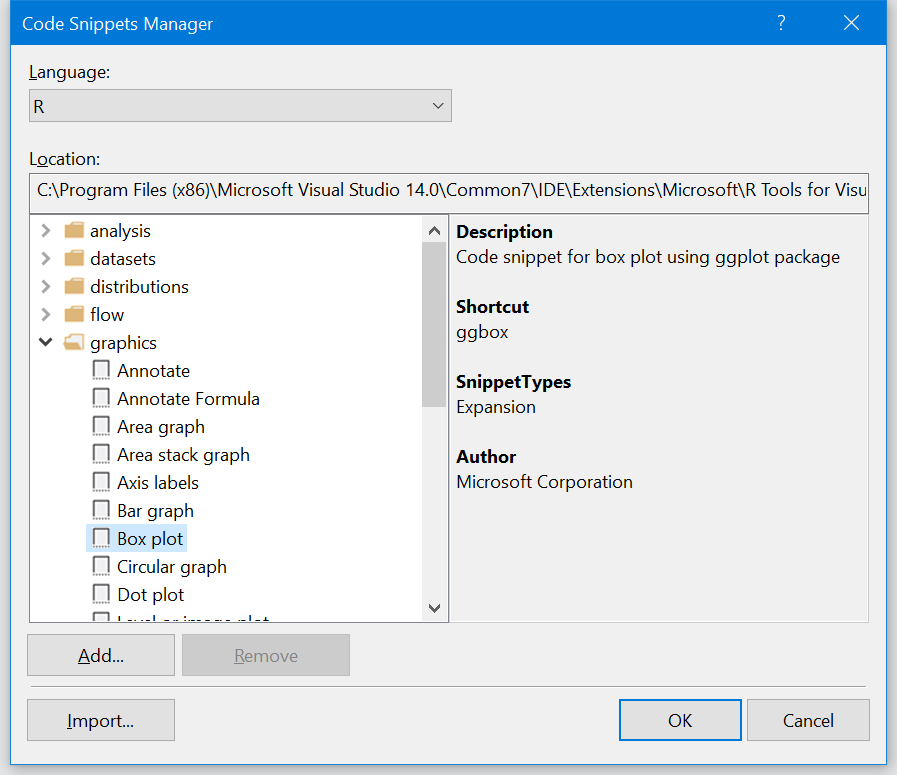
If you want to examine the Code Snippets in Visual Studio, use the Tools/Code Snippets Manager menu to bring up the UI. Select R from the list of languages in the drop-down to see all of the snippets that we’ve defined for R.
Snippets can be much more than just completion of characters. They can save you
from having to remember the names of parameters in complex function calls.
Here’s an example of a snippet for reading a CSV file via the read.csv
function:

You can create your own Code Snippets as well; this is well-documented in this MSDN article.
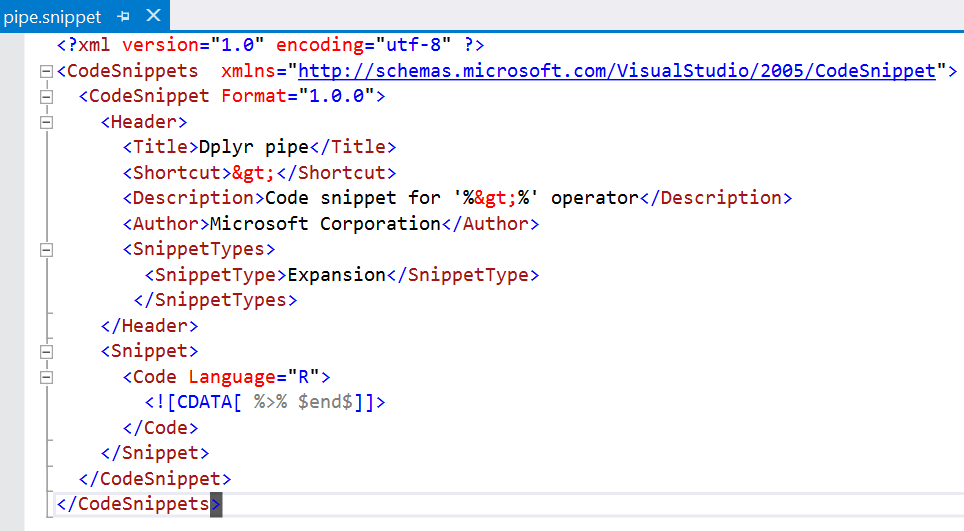
A code snippet is just an XML file; here’s the Code Snippet for the pipe operator:
Code Navigation
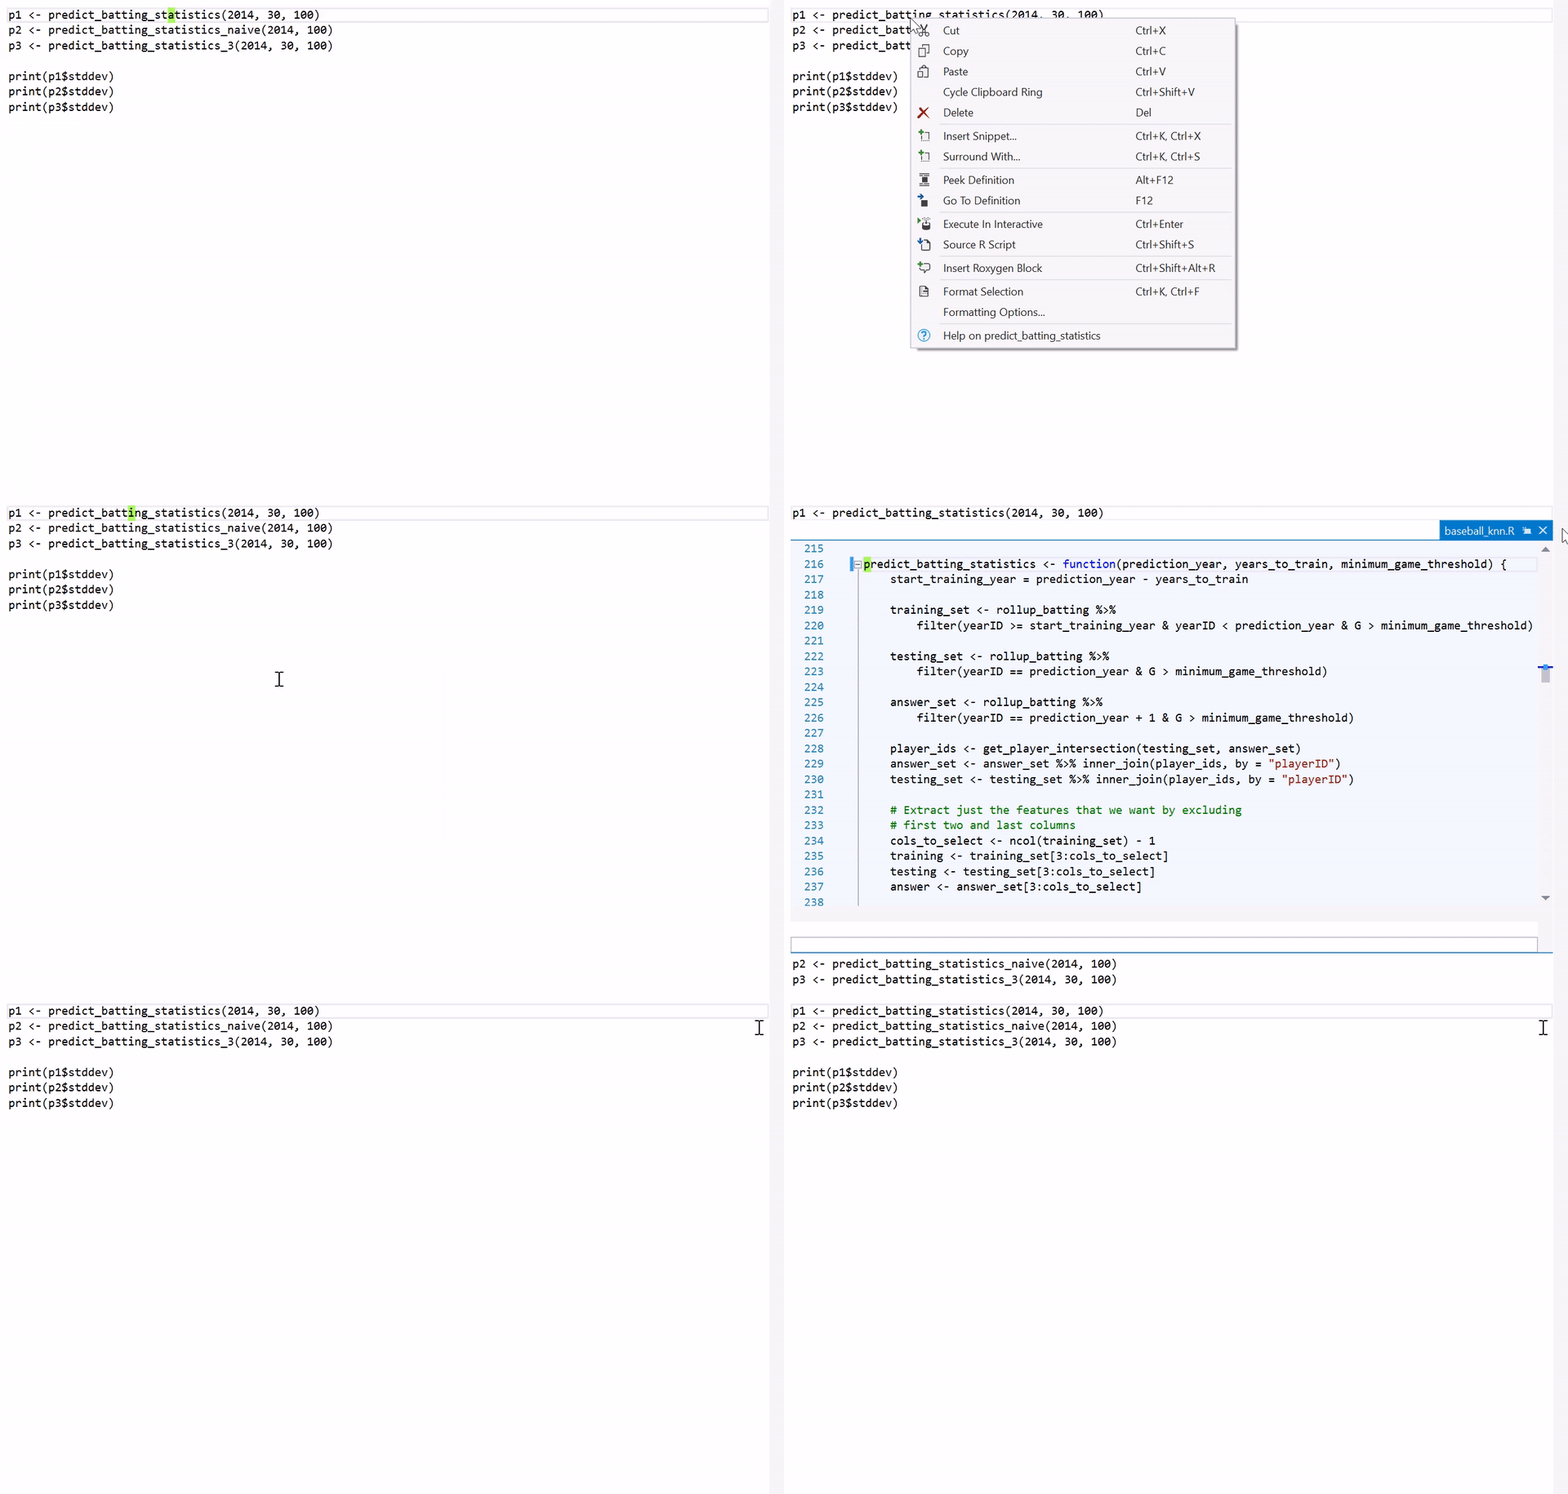
You can now navigate to the definition of another function within the same file using the GoTo Definition command from the context menu, or by placing your cursor over a call to the function and pressing F12. Note that this feature only works today within the same file; send us feedback if you feel multi-file navigation is an important feature and we will prioritize and add to a future release.
If you would prefer instead to peek at the definition of a function, you can do so by using the Peek Definition command from the context menu, or by placing your cursor over a call to the function and pressing ALT+F12:
Code formatting
We have added a few additional features to make it easier to format / select your code.
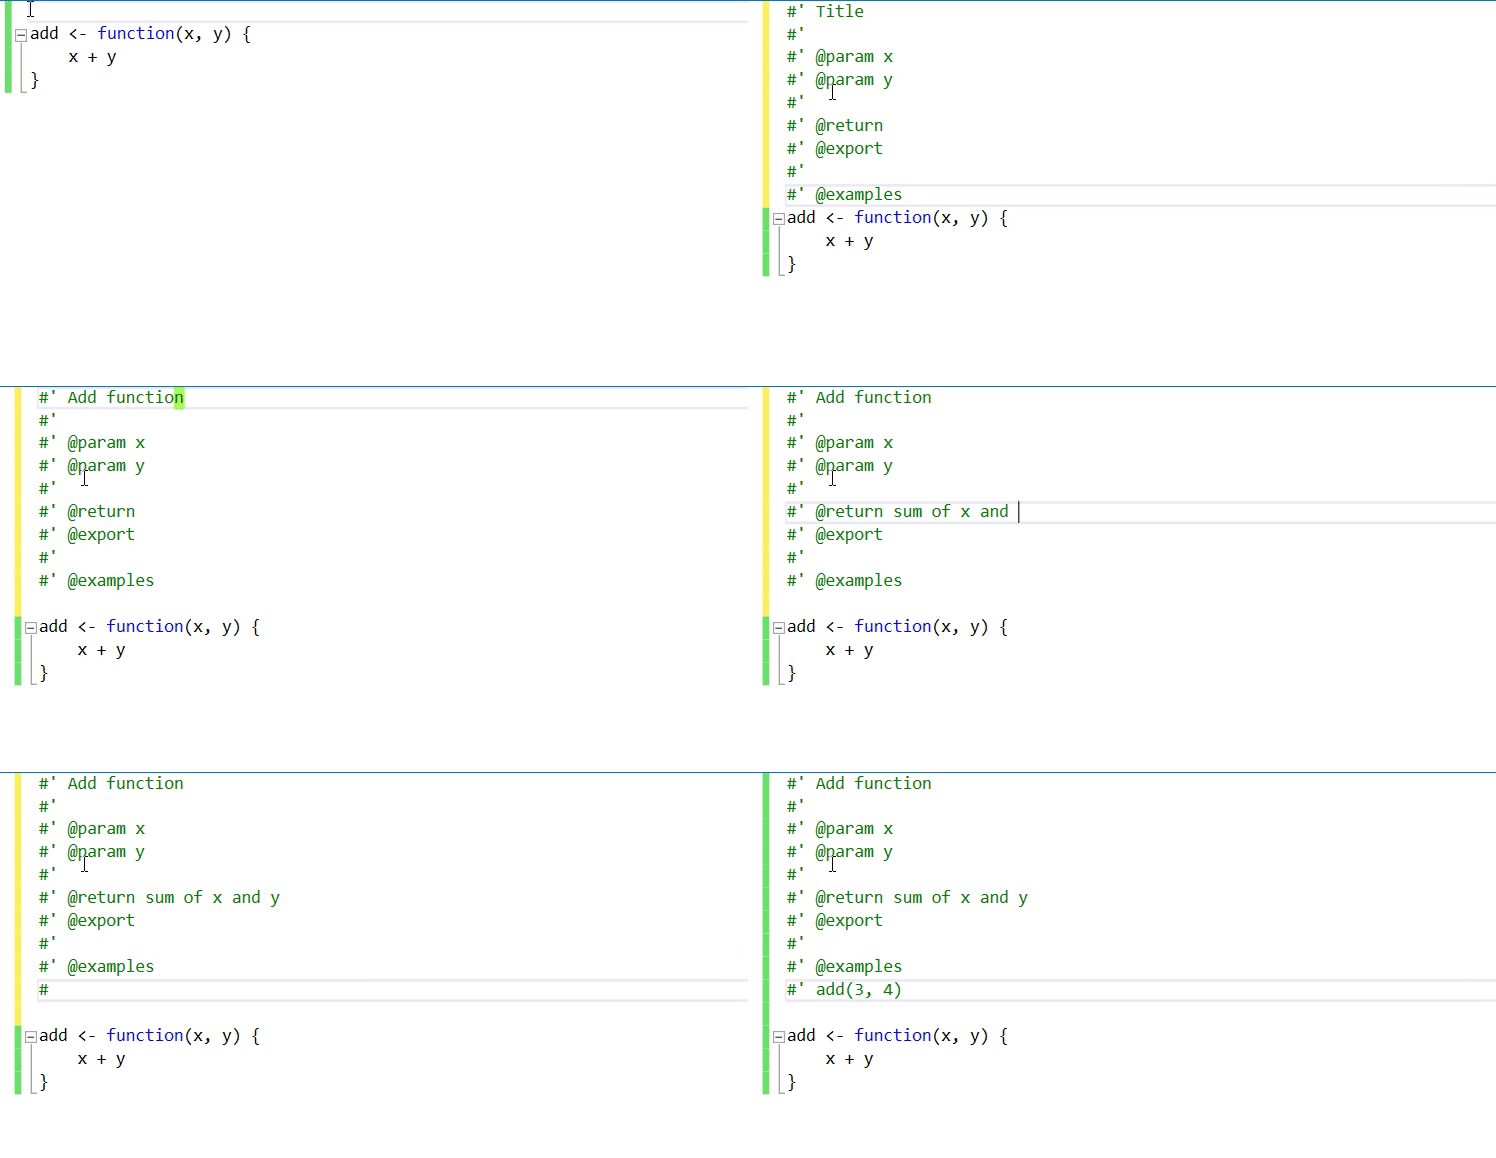
You can insert a Roxygen comment block by typing ### at the start of a line:
Auto-formatting of parameters lets you align based on function arguments:

We have also fixed the behavior of double-click to correctly select words within the editor.
Debugger
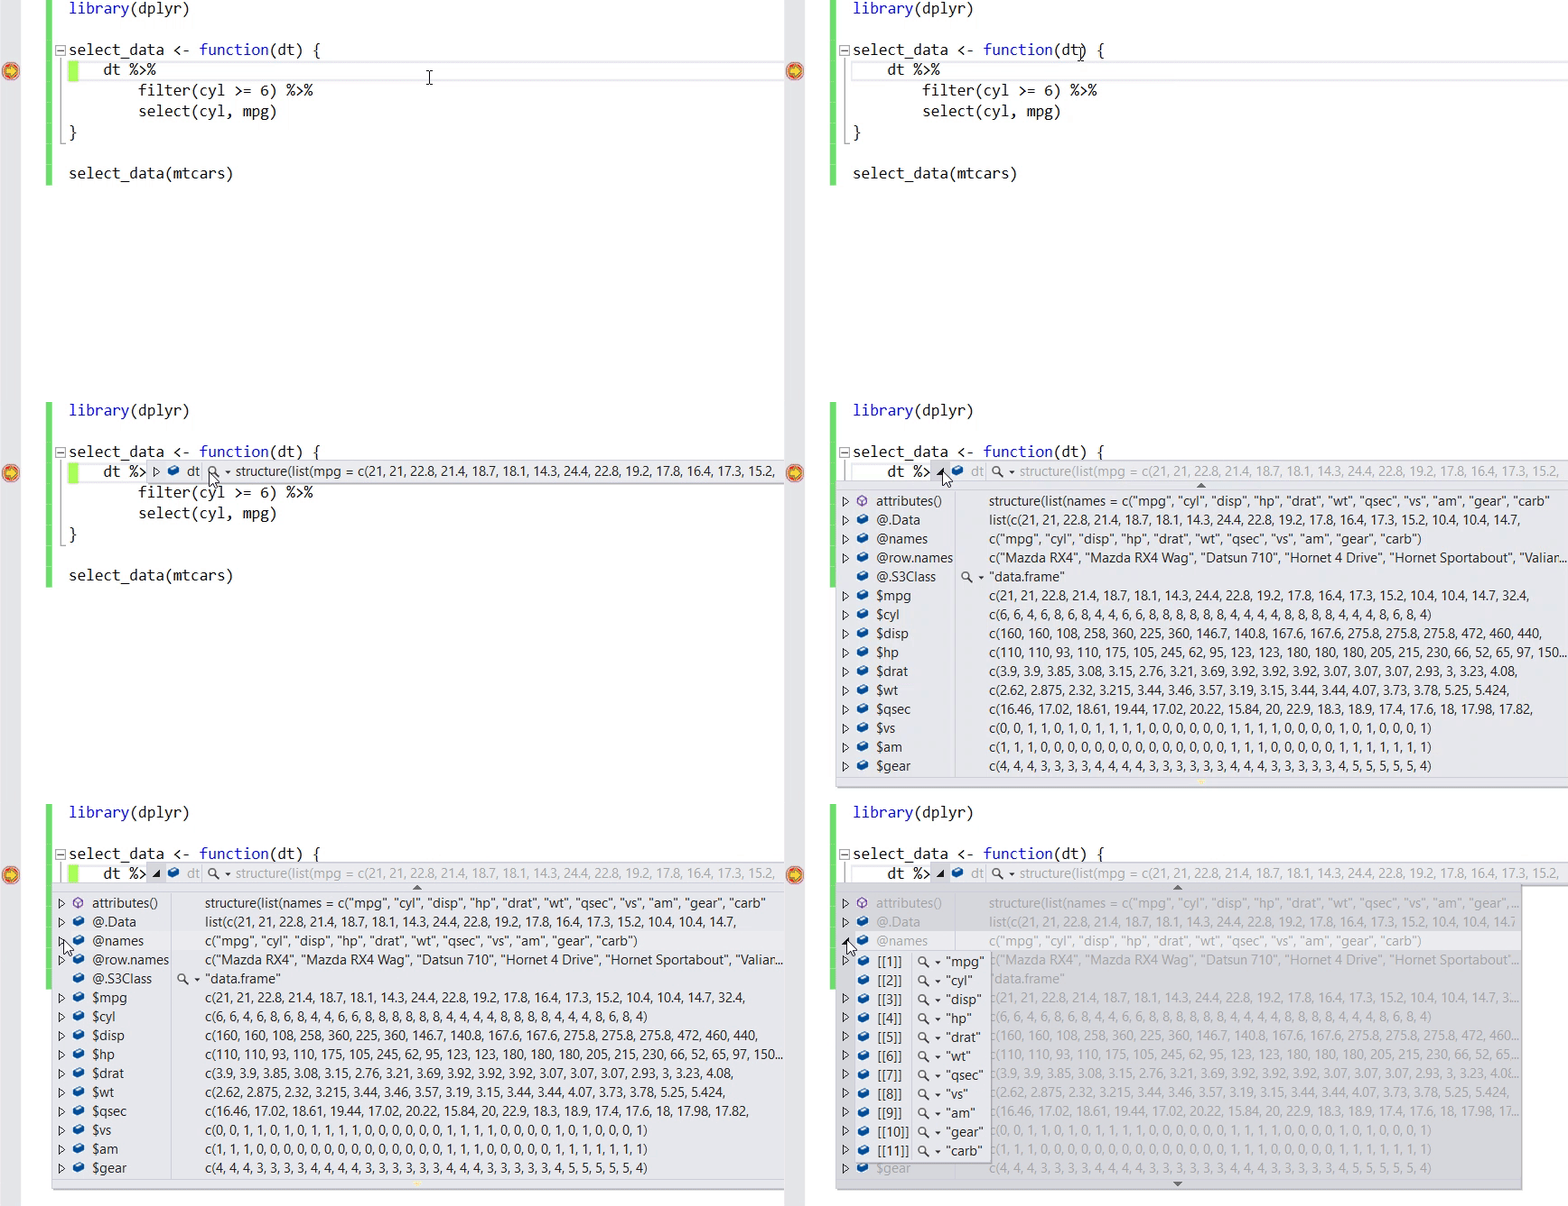
We have now enabled tooltips in the debugger. This lets you hover over a variable that you want to inspect, and then drill down into the objects within that variable. This lets you inspect arbitrary variables in-place while stopped in the debugger without having to resort to using other windows like the locals window.
Variable Explorer
The variable explorer also has numerous improvements in this release. While the data table viewer is a great tool, sometimes you want to be able to take your data frame and export it to Excel. We’ve made it easy to do that in this release by adding a small Excel icon to the variable explorer:
![]()
When you click on it, it will take your data frame and export it to a new Excel Workbook:

We also added toolbar buttons to the variable explorer to make it easier to import data from either a local file or from a web URI:

We now let you pick different scopes for the variables in the variable explorer; previously you could only examine variables at global scope. Now, with package level scope, we give you a view over all of the variables (including functions, which are just values of type function that are bound to variables) defined within a package:

When you are debugging, variable explorer also recognizes the current execution
scope (i.e., when you are debugging code within a function). Here, local
variables that you define within that function can now be inspected using
variable explorer. In the picture below, you can see that the current execution
scope is within a function called renderUI, and that there are two
local variables defined at the current execution point: country_data and
max_destinations:

IDE
Finally, we have a bunch of additional small improvements in the IDE:
A dedicated toolbar with buttons for:
- Executing selection in R interactive window
- Source current script
- Run/Stop Shiny app
- Import data from a web URI
- Import data from a text file
- Preview HTML
- Preview PDF

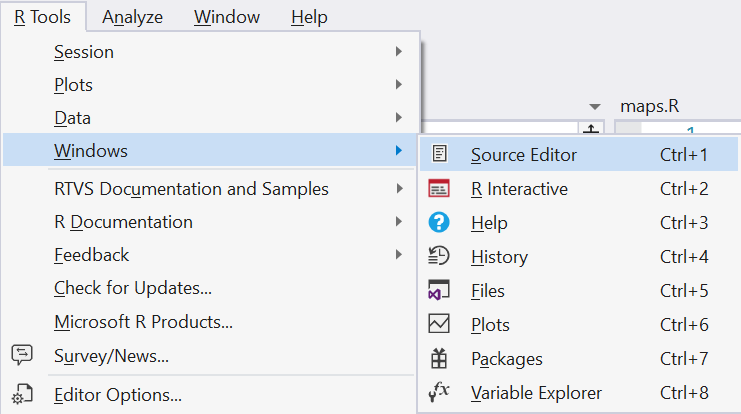
We’ve made the shortcuts that users are familiar with from other IDEs the default key bindings in RTVS (e.g., CTRL+8 maps to Variable Explorer):
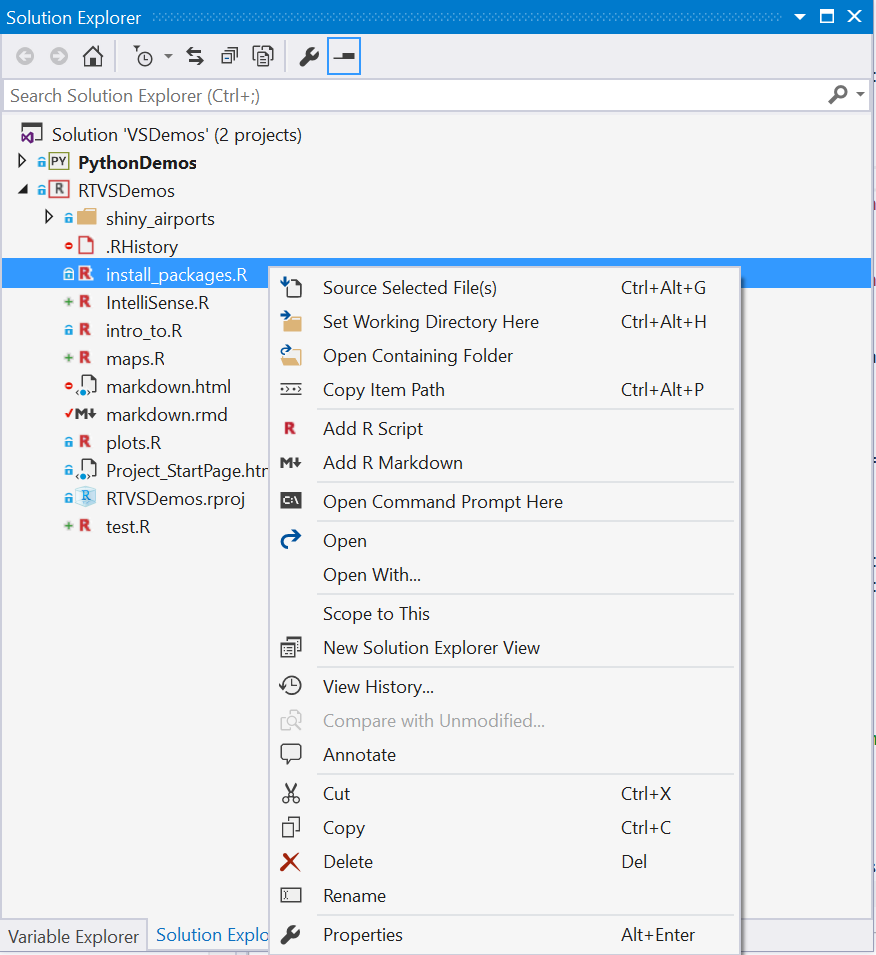
We’ve added some additional commands to the context menu in the Solution Explorer so that you can quickly source the selected file or set the current working directory.
