
Challenge 2: Coach’s Guide - Monitoring for SAP in Azure
< Previous Challenge - Home - Next Challenge >
Notes & Guidance
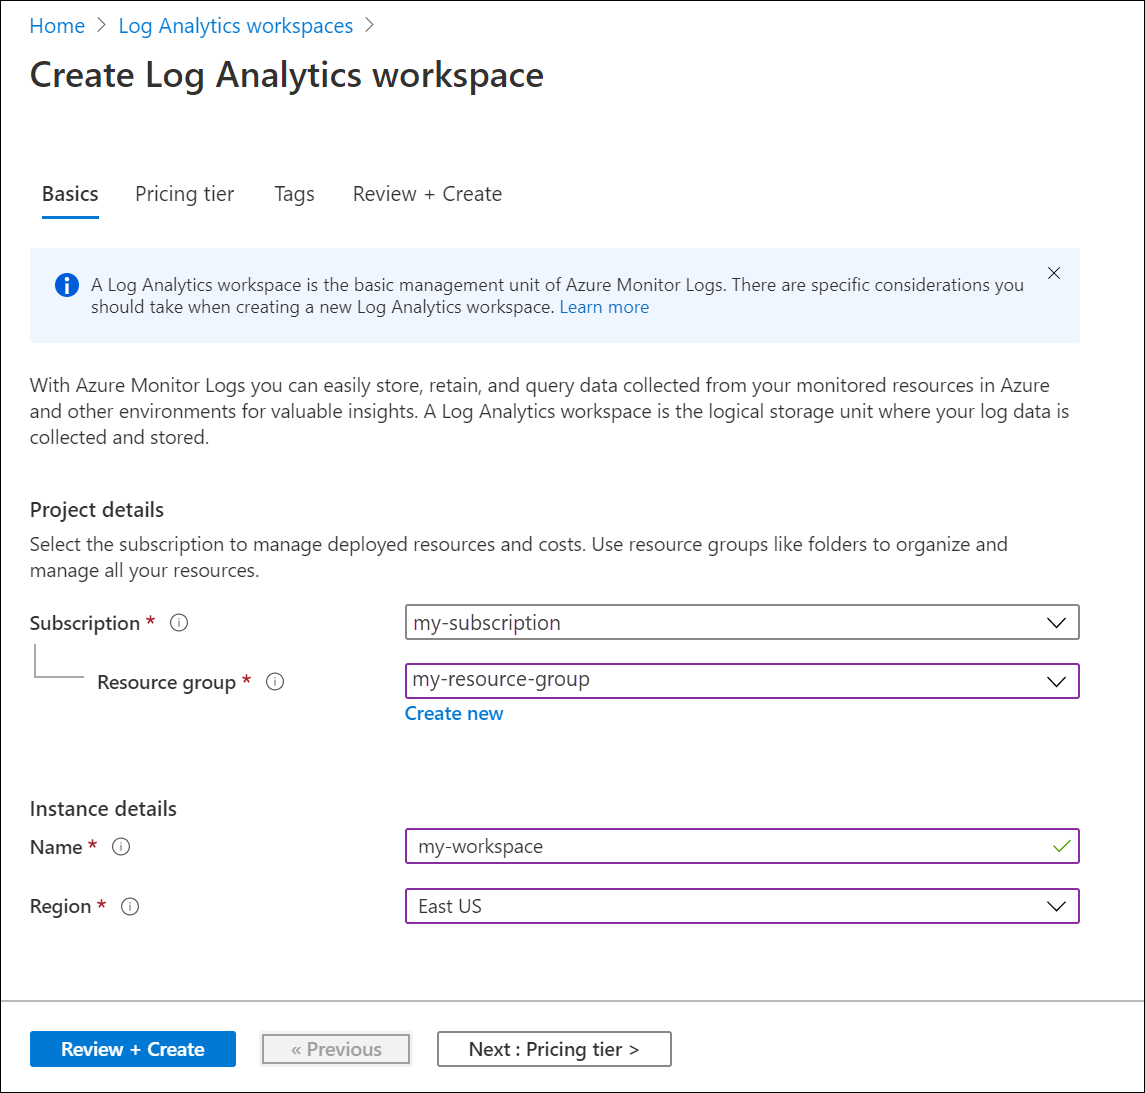
Step 1 - Create Log Analytics workspace
In the Azure portal, click All services. In the list of resources, type Log Analytics. As you begin typing, the list filters based on your input. Select Log Analytics workspaces.
 Click Add, and then provide values for the following options:
- Select a Subscription to link to by selecting from the drop-down list if the default selected is not appropriate.
- For Resource Group, choose to use an existing resource group already setup or create a new one.
- Provide a name for the new Log Analytics workspace, such as DefaultLAWorkspace. This name must be unique per resource group.
- Select an available Region. For more information, see which regions Log Analytics is available in and search for Azure Monitor from the Search for a product field.
Click Review + create to review the settings and then Create to create the workspace. This will select a default pricing tier of Pay-as-you-go which will not incur any changes until you start collecting a sufficient amount of data. For more information about other pricing tiers, see Log Analytics Pricing Details.
Step 2 - Deploy Azure Monitor for SAP.
- Select Azure Monitor for SAP Solutions from Azure Marketplace.

- In the Basics tab, provide the required values. If applicable, you can use an existing Log Analytics workspace.
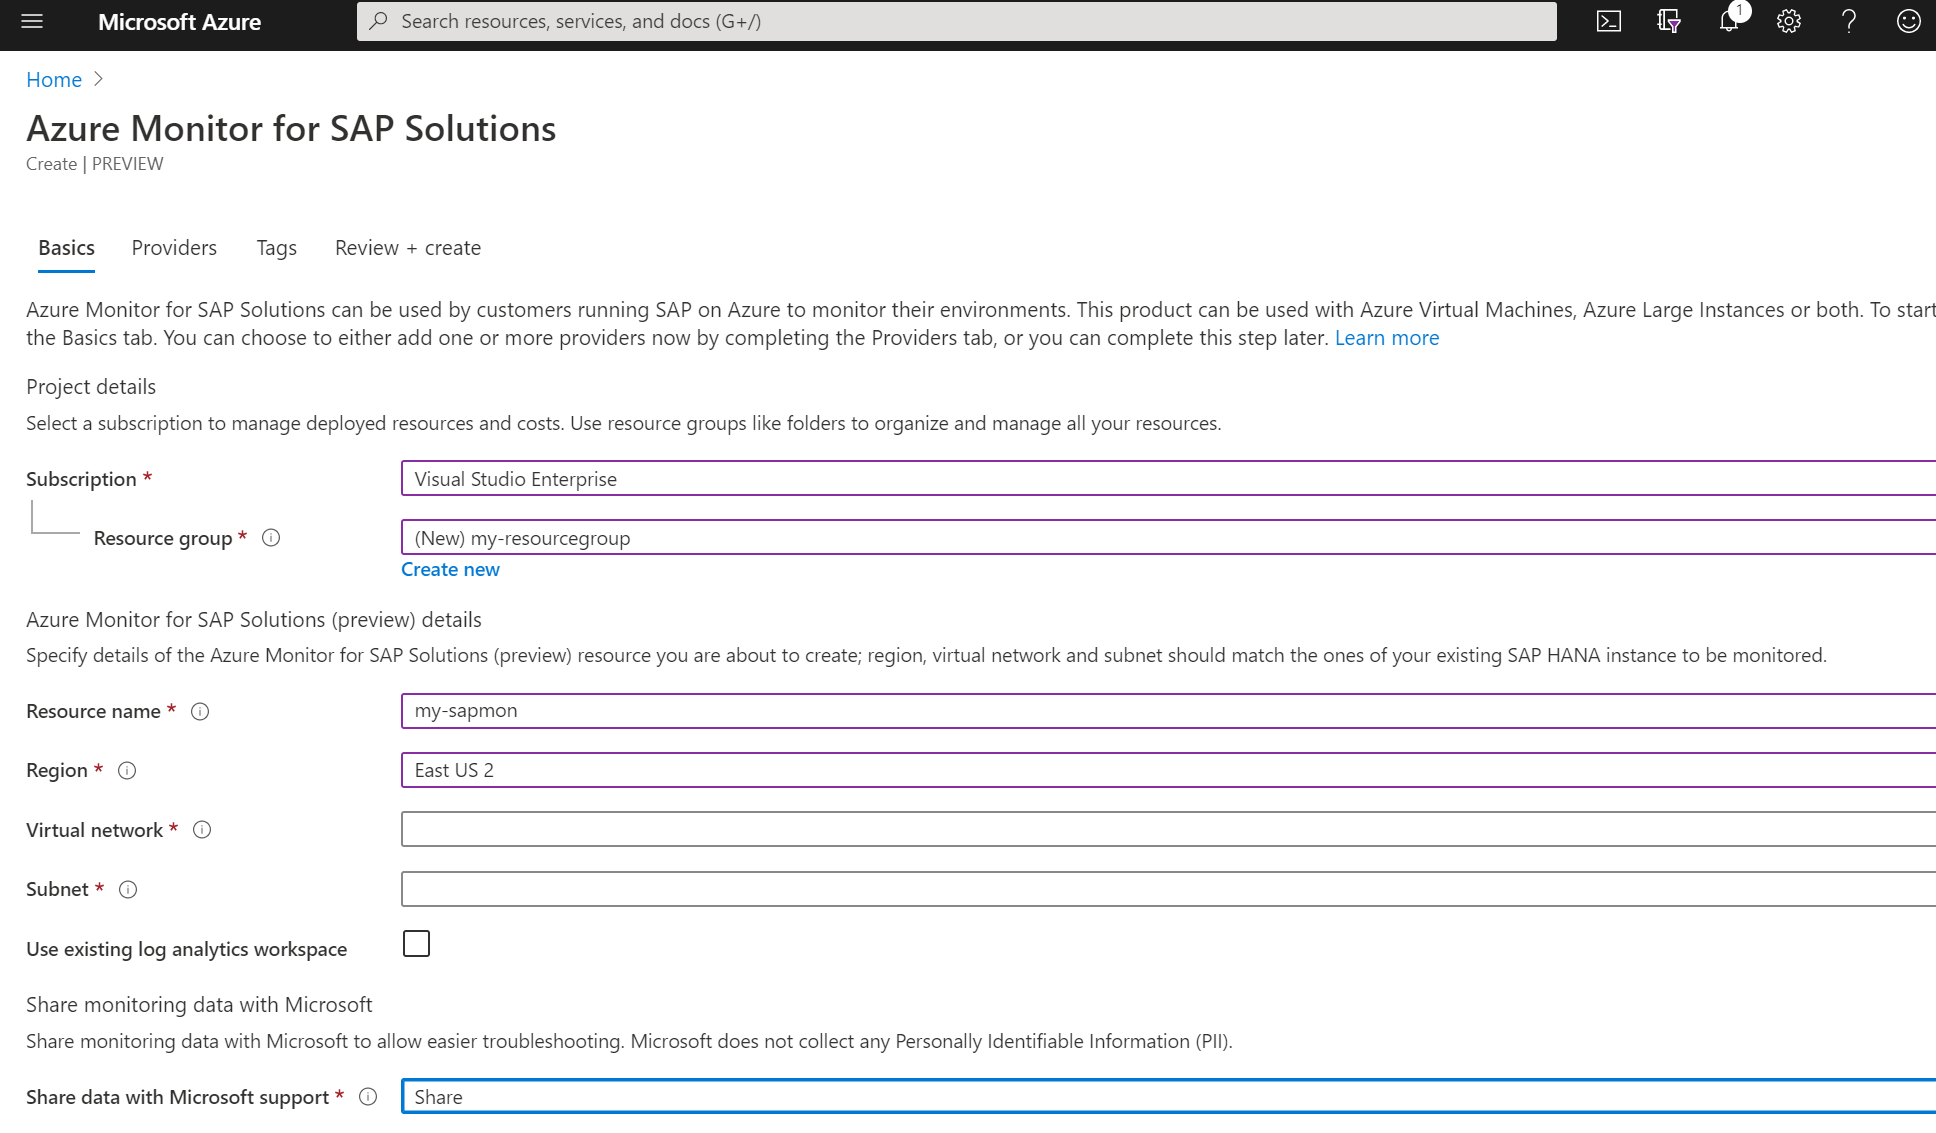
- When selecting a virtual network, ensure that the systems you want to monitor are reachable from within that VNET.
Step 3 - Enable VM Insights on Virtual Machines running SAP Workloads and connect to log analytics workspace created as part of Task1/Step1.
From the Azure portal, select Virtual machines and select a resource from the list. In the Monitoring section of the menu, select Insights and then Enable.
- Enable VM Insights
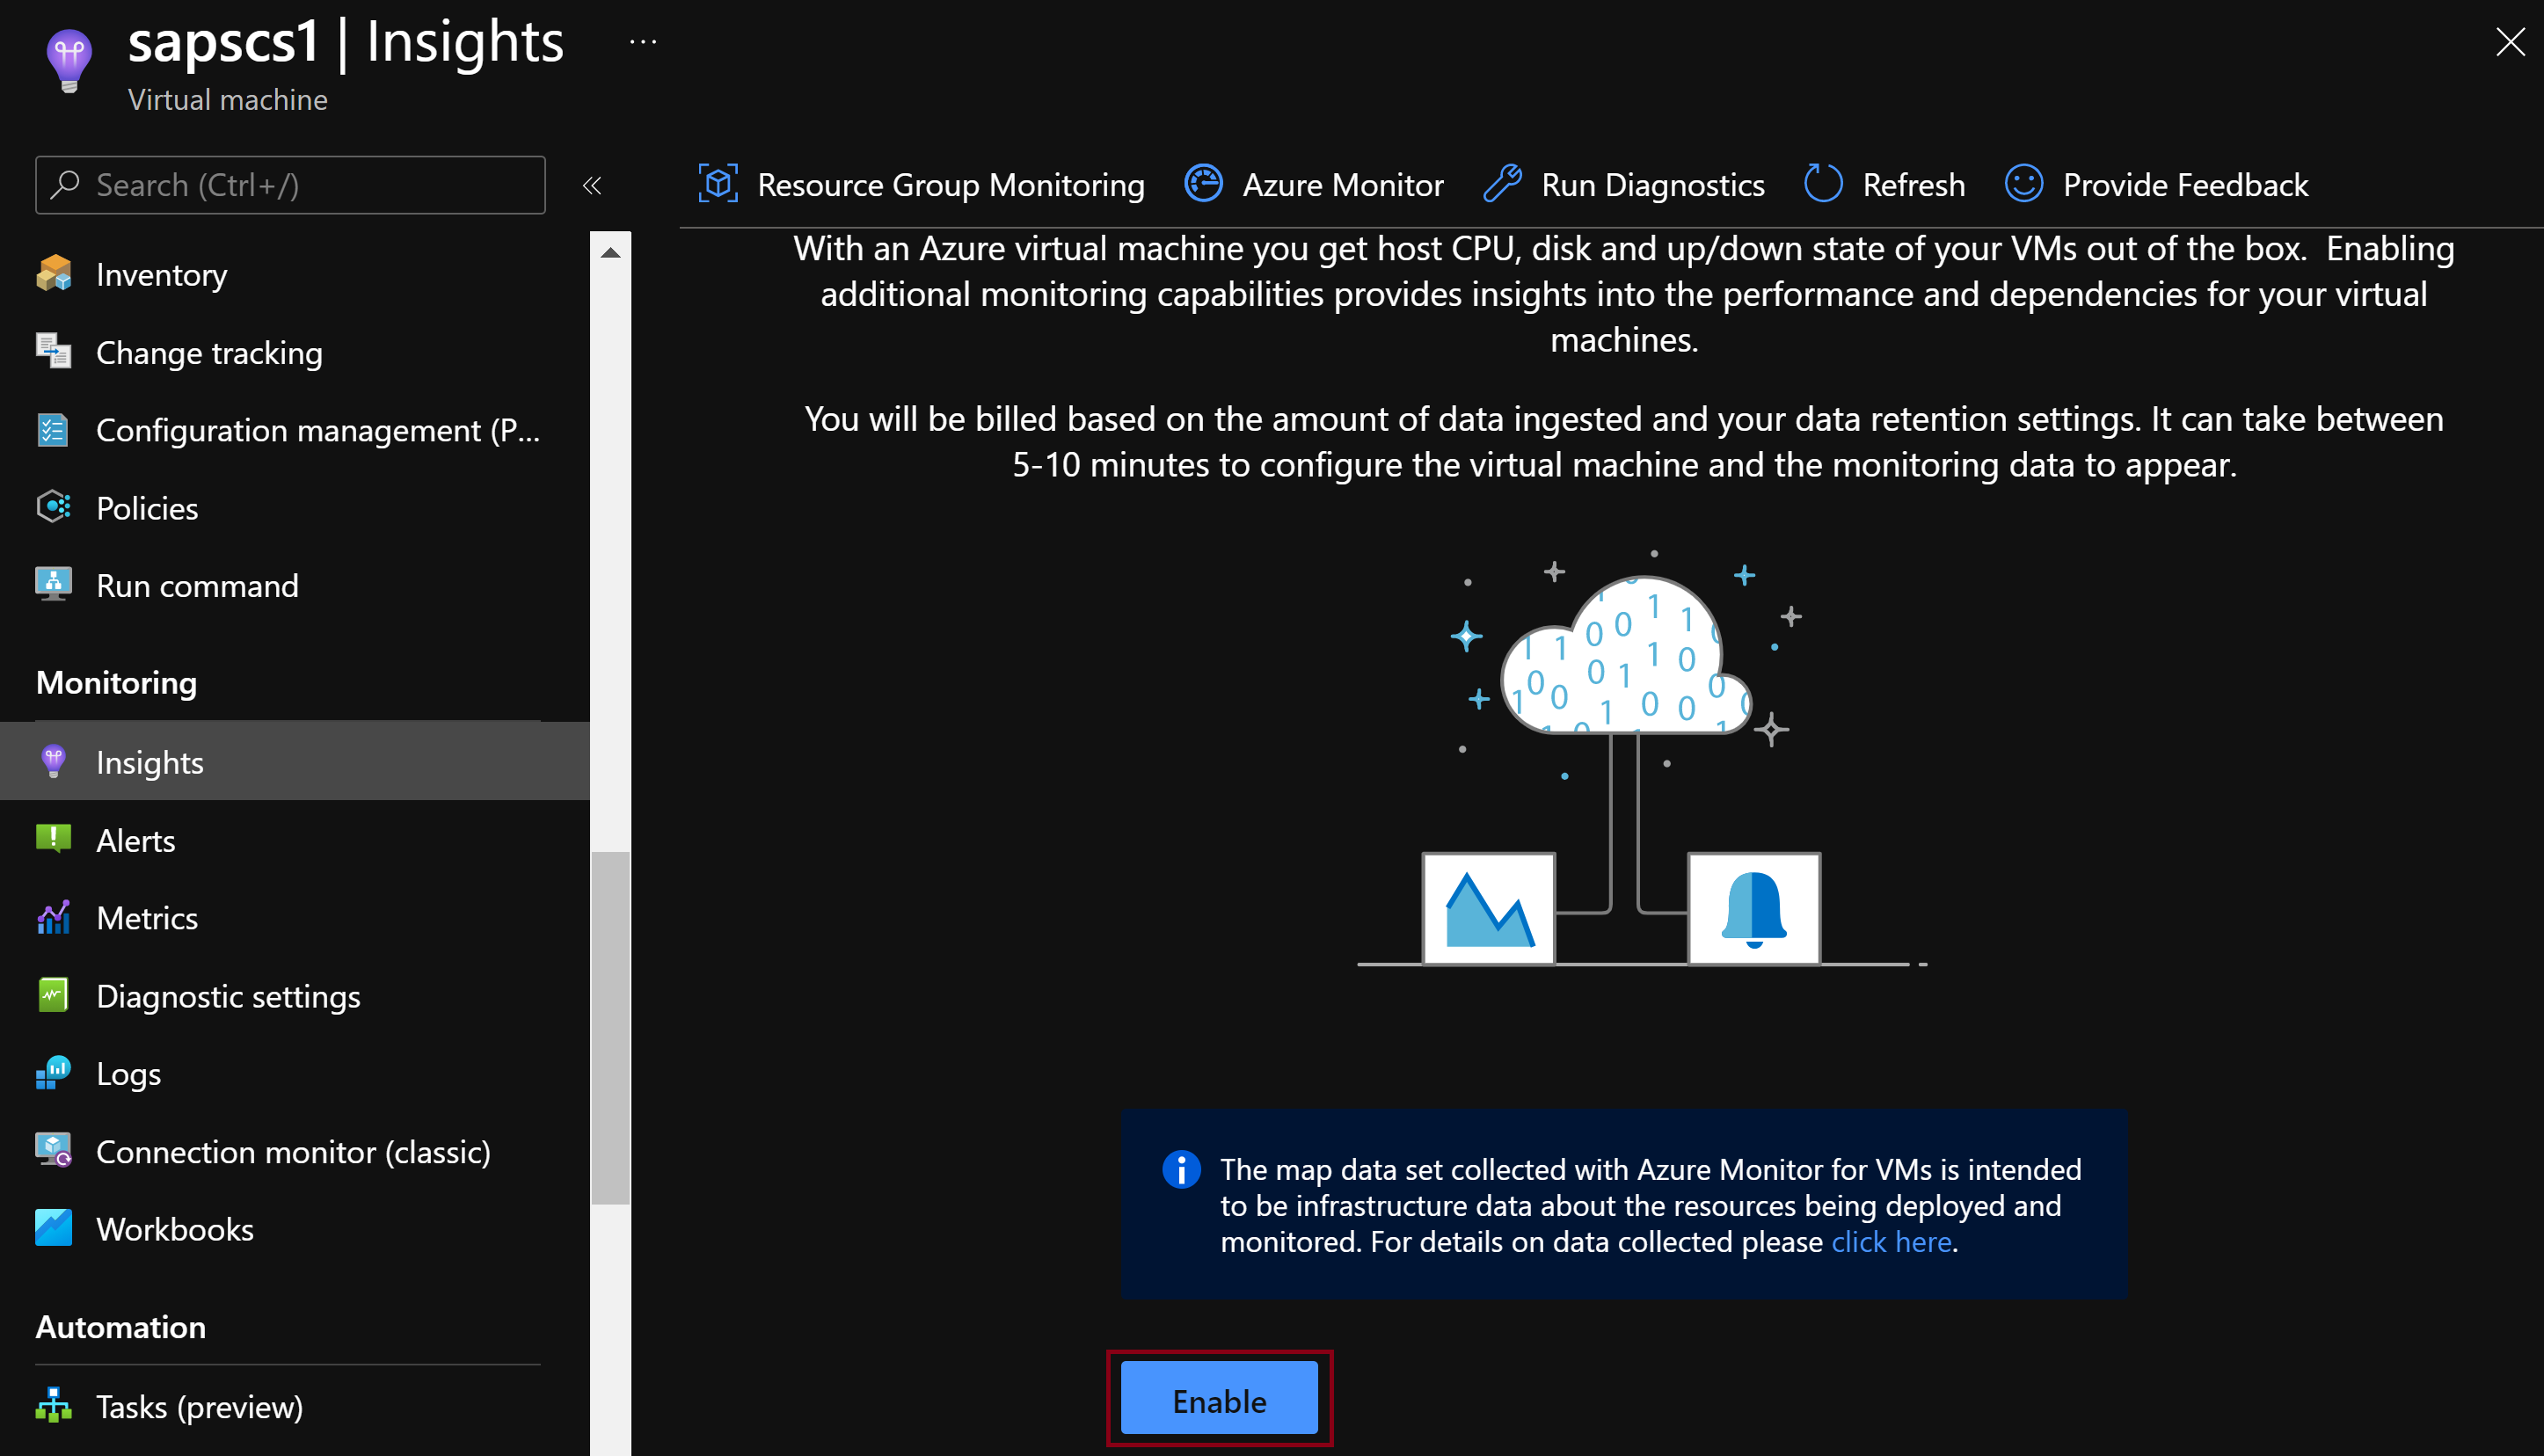
- Select correct workspace.
Step 4 - Configure SAP NetWeaver providers.
- Prerequisites for adding NetWeaver provider
- Open an SAP GUI connection to the SAP server
- Login using an administrative account
- Execute transaction RZ10
- Select the appropriate Profile (DEFAULT.PFL)
- Select ‘Extended Maintenance’ and click Change
- Modify the value of the affected parameter “service/protectedwebmethods” to “SDEFAULT -GetQueueStatistic –ABAPGetWPTable –EnqGetStatistic –GetProcessList” to the recommended setting and click Copy
- Go back and select Profile->Save
- Restart system for parameter to take effect
- Configuration of NetWeaver provider on the Azure portal

Step 5 - Check for Monitoring data in Log Analytics Workspace.
The solutions Overview page in Azure Monitor displays a tile for each solution installed in a Log Analytics workspace.
- Go to Azure Monitor in the Azure portal.
- Under the Insights menu, select More to open the Insights Hub, and then click on Log Analytics workspaces.
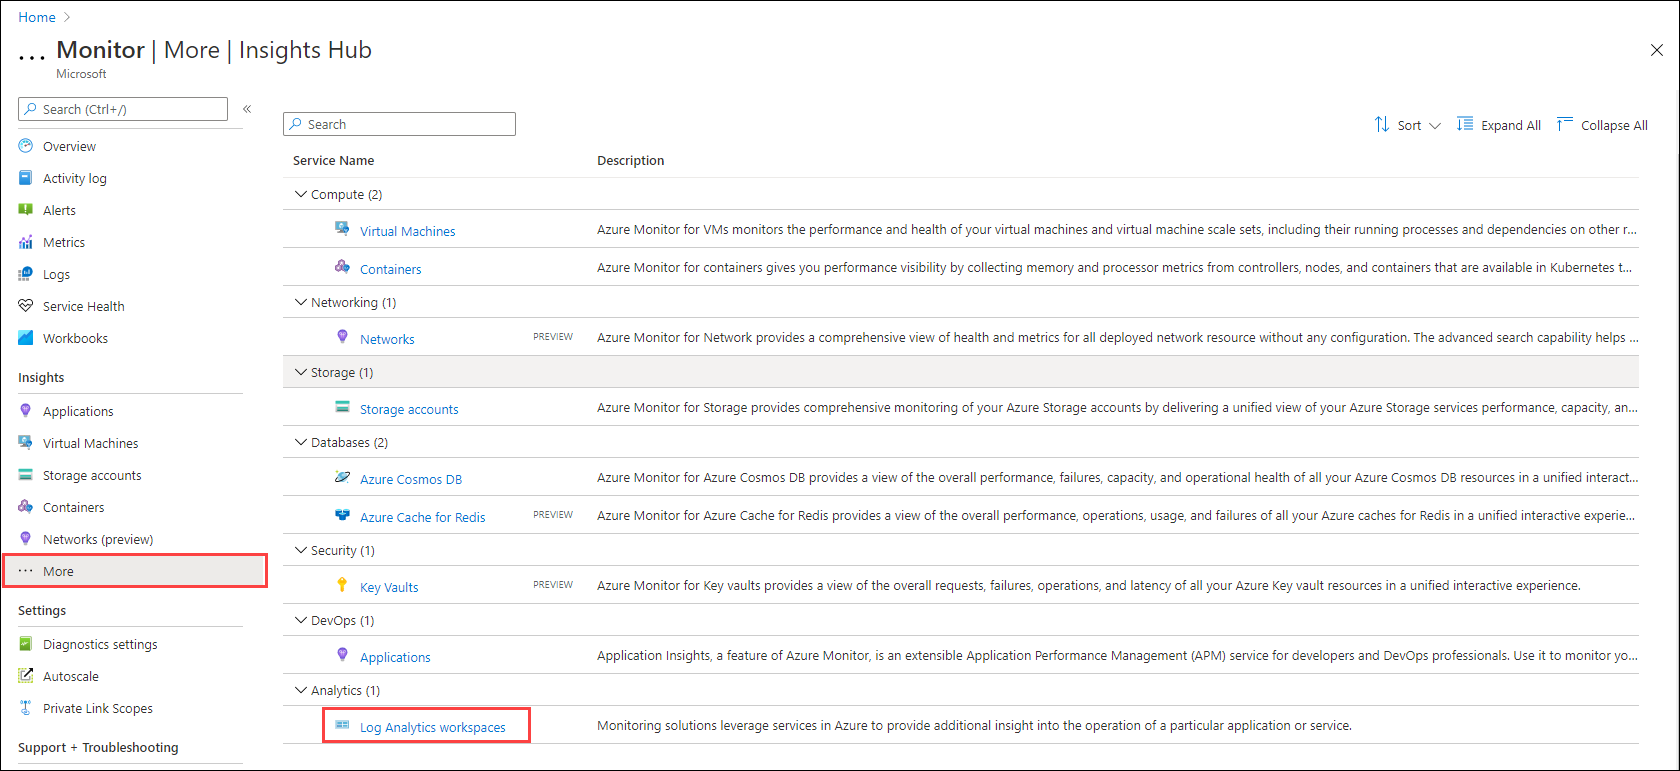
- Use the dropdown boxes at the top of the screen to change the workspace or the time range used for the tiles. Click on the tile for a solution to open its view that includes more detailed analysis its collected data.
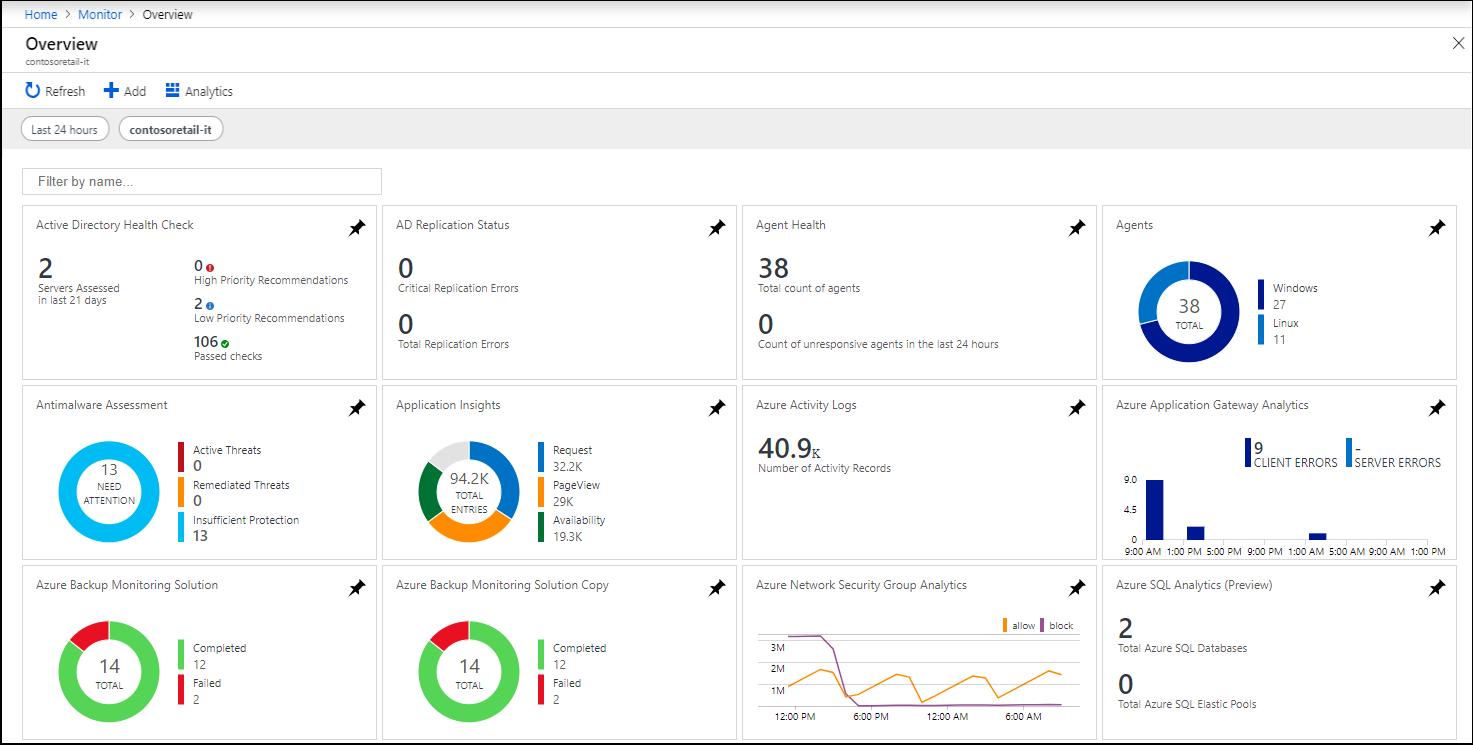
Ref: https://docs.microsoft.com/en-us/azure/azure-monitor/logs/log-analytics-tutorial
Step 6 - Use Kusto query to create custom dashboard.
- select Logs from the Azure Monitor menu in your subscription. This will set the initial scope to a Log Analytics workspace meaning that your query will select from all data in that workspace.
- Example Query:
InsightsMetrics
| where Origin == 'vm.azm.ms'
| where Computer == 'Server1' or Computer == 'Server2'
| where Namespace == "Memory" and Name == "AvailableMB"
| extend TotalMemory = toreal(todynamic(Tags)["vm.azm.ms/memorySizeMB"])
| extend ConsumedMemoryPercentage = 100 - ((toreal(Val) / TotalMemory) * 100.0)
| summarize MemoryUtilizedPercentage = avg(ConsumedMemoryPercentage)by bin(TimeGenerated, 15m), Computer, _ResourceId
| render timechart;