Challenge 2: Monitoring for SAP in Azure
< Previous Challenge - Home - Next Challenge >
Introduction
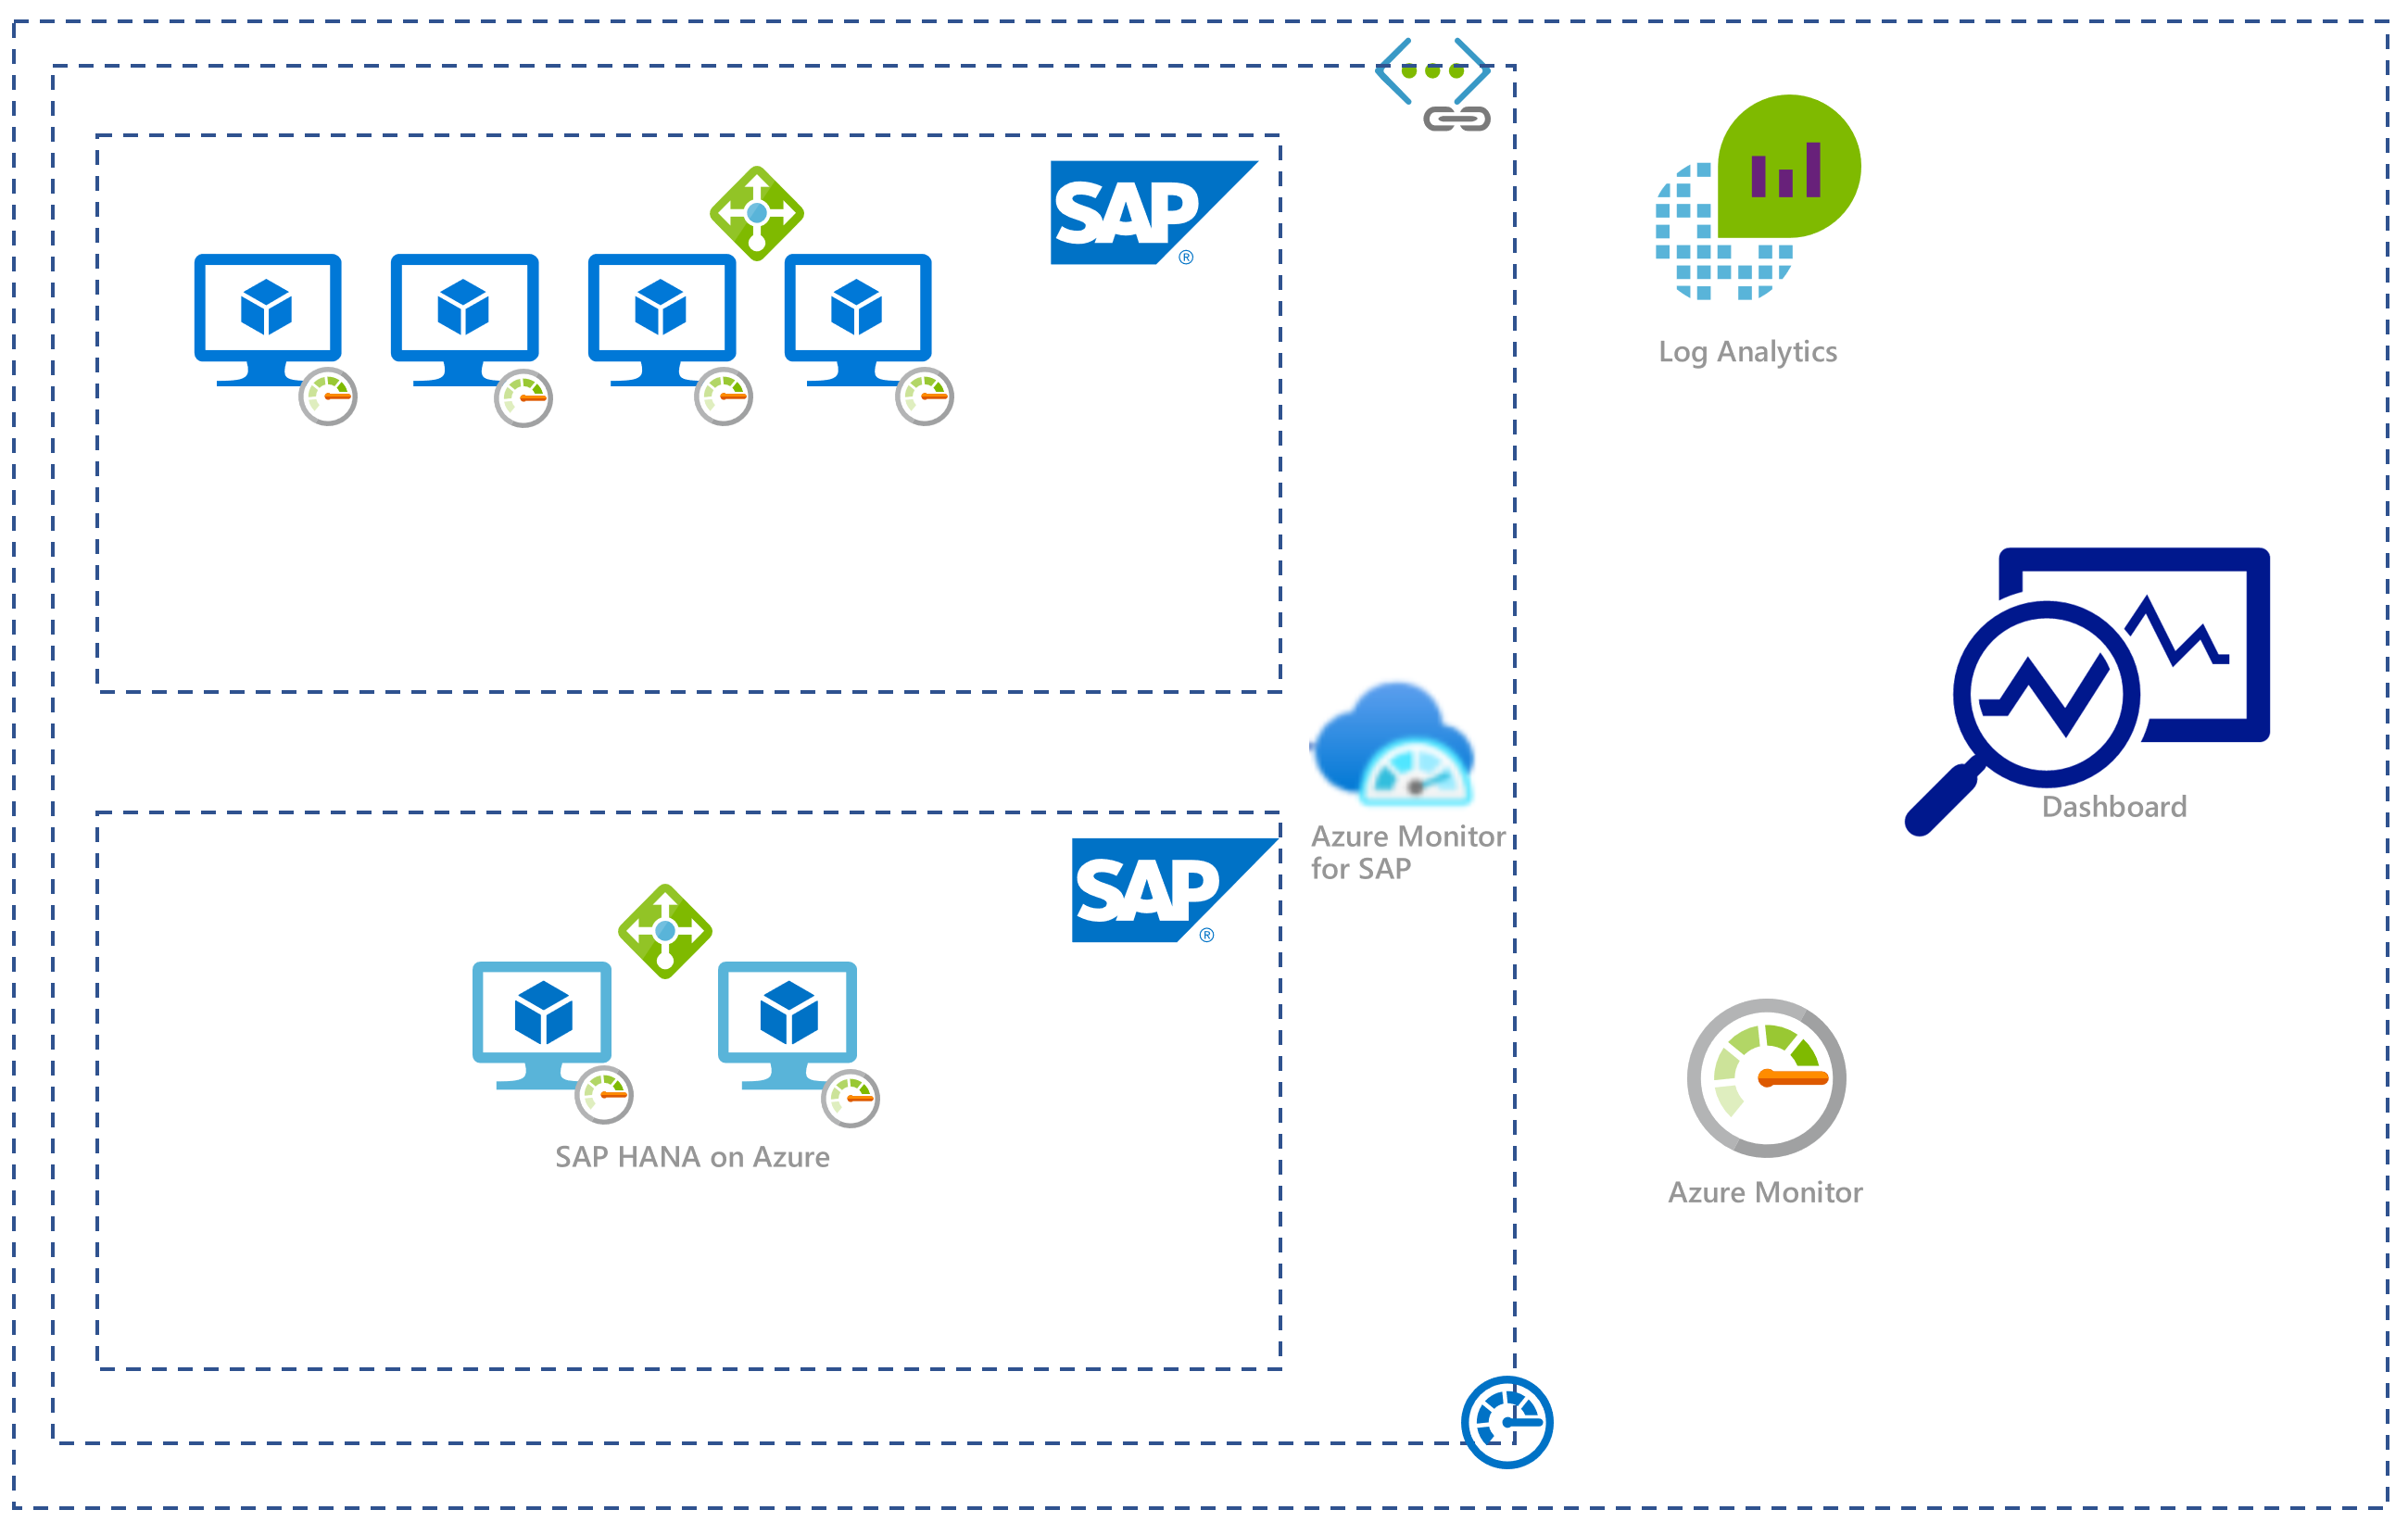
Now that Contoso’s SAP landscape is deployed in Azure, IT needs to deploy a holistic monitoring solution. In this challenge, you’ll utilize Azure-native monitoring solutions to collect telemetry data and visually coorelate that information to enable faster troubleshooting.
Description
Configure Azure Monitor for SAP Solutions which will fetch critical metrics from your virtual machines, SAP application servers, and HANA database.

This will leverage Azure Monitor to unlock critical telemetry. To do this, you will configure monitoring data collection and ingestion into a log analytics workspace. There you can then perform trend analysis and build custom dashboards.
- Enable VM Insights on the Virtual Machines hosting SAP Workload.
- Hint: VM Insights can be enabled from the Virtual Machine panel in the Azure Portal. Also consider creating a Log Analytics workspace as a pre-requisite.
- Deploy Azure Monitor for SAP Solutions from the Azure Portal.
- Hint: This should be done by searching “Azure Monitor for SAP” as a service on the Marketplace.
- Create & configure OS, SAP HANA, & Netweaver providers.
- Hint: The NetWeaver provider is in public preview. Access the link below to access this provider.
- Review availability of telemetry in the Log Analytics workspace.
- Hint: Select the Log Workspace that was used while enabling VM Insights and verify data is flowing in.
- Once monitoring data is ingested into the workspace, execute a standard kusto query to visualize the monitoring data.
- Create a custom dashboard.
- Hint: Example custom queries are available for a honeycomb dashboard. Modify the standard query to create custom dashboard as required.
Success Criteria
- Demonstrate availability metrics of your SAP system, the memory utilization of your HANA database, and your custom dashboard.