ai-agents-for-beginners
AI Agents in Production: Observability & Evaluation
As AI agents move from experimental prototypes to real-world applications, the ability to understand their behavior, monitor their performance, and systematically evaluate their outputs becomes important.
Learning Goals
After completing this lesson, you will know how to/understand:
- Core concepts of agent observability and evaluation
- Techniques for improving the performance, costs, and effectiveness of agents
- What and how to evaluate your AI agents systematically
- How to control costs when deploying AI agents to production
- How to instrument agents built with Microsoft Agent Framework
The goal is to equip you with the knowledge to transform your “black box” agents into transparent, manageable, and dependable systems.
Note: It is important to deploy AI Agents that are safe and trustworthy. Check out the Building Trustworthy AI Agents lesson as well.
Traces and Spans
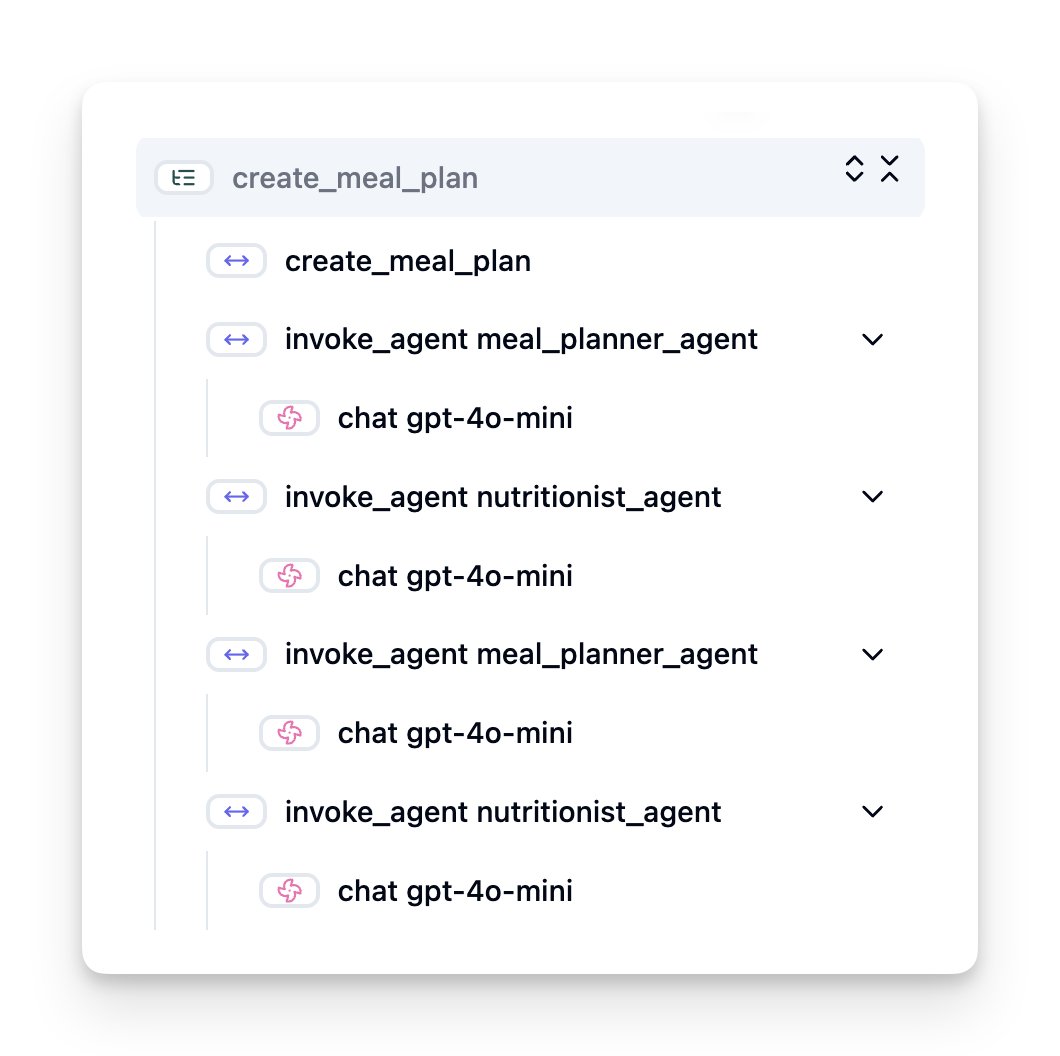
Observability tools such as Langfuse or Microsoft Foundry usually represent agent runs as traces and spans.
- Trace represents a complete agent task from start to finish (like handling a user query).
- Spans are individual steps within the trace (like calling a language model or retrieving data).
Without observability, an AI agent can feel like a “black box” - its internal state and reasoning are opaque, making it difficult to diagnose issues or optimize performance. With observability, agents become “glass boxes,” offering transparency that is vital for building trust and ensuring they operate as intended.
Why Observability Matters in Production Environments
Transitioning AI agents to production environments introduces a new set of challenges and requirements. Observability is no longer a “nice-to-have” but a critical capability:
- Debugging and Root-Cause Analysis: When an agent fails or produces an unexpected output, observability tools provide the traces needed to pinpoint the source of the error. This is especially important in complex agents that might involve multiple LLM calls, tool interactions, and conditional logic.
- Latency and Cost Management: AI agents often rely on LLMs and other external APIs that are billed per token or per call. Observability allows for precise tracking of these calls, helping to identify operations that are excessively slow or expensive. This enables teams to optimize prompts, select more efficient models, or redesign workflows to manage operational costs and ensure a good user experience.
- Trust, Safety, and Compliance: In many applications, it’s important to ensure that agents behave safely and ethically. Observability provides an audit trail of agent actions and decisions. This can be used to detect and mitigate issues like prompt injection, the generation of harmful content, or the mishandling of personally identifiable information (PII). For example, you can review traces to understand why an agent provided a certain response or used a specific tool.
- Continuous Improvement Loops: Observability data is the foundation of an iterative development process. By monitoring how agents perform in the real world, teams can identify areas for improvement, gather data for fine-tuning models, and validate the impact of changes. This creates a feedback loop where production insights from online evaluation inform offline experimentation and refinement, leading to progressively better agent performance.
Key Metrics to Track
To monitor and understand agent behavior, a range of metrics and signals should be tracked. While the specific metrics might vary based on the agent’s purpose, some are universally important.
Here are some of the most common metrics that observability tools monitor:
Latency: How quickly does the agent respond? Long waiting times negatively impact user experience. You should measure latency for tasks and individual steps by tracing agent runs. For example, an agent that takes 20 seconds for all model calls could be accelerated by using a faster model or by running model calls in parallel.
Costs: What’s the expense per agent run? AI agents rely on LLM calls billed per token or external APIs. Frequent tool usage or multiple prompts can rapidly increase costs. For instance, if an agent calls an LLM five times for marginal quality improvement, you must assess if the cost is justified or if you could reduce the number of calls or use a cheaper model. Real-time monitoring can also help identify unexpected spikes (e.g., bugs causing excessive API loops).
Request Errors: How many requests did the agent fail? This can include API errors or failed tool calls. To make your agent more robust against these in production, you can then set up fallbacks or retries. E.g. if LLM provider A is down, you switch to LLM provider B as backup.
User Feedback: Implementing direct user evaluations provide valuable insights. This can include explicit ratings (👍thumbs-up/👎down, ⭐1-5 stars) or textual comments. Consistent negative feedback should alert you as this is a sign that the agent is not working as expected.
Implicit User Feedback: User behaviors provide indirect feedback even without explicit ratings. This can include immediate question rephrasing, repeated queries or clicking a retry button. E.g. if you see that users repeatedly ask the same question, this is a sign that the agent is not working as expected.
Accuracy: How frequently does the agent produce correct or desirable outputs? Accuracy definitions vary (e.g., problem-solving correctness, information retrieval accuracy, user satisfaction). The first step is to define what success looks like for your agent. You can track accuracy via automated checks, evaluation scores, or task completion labels. For example, marking traces as “succeeded” or “failed”.
Automated Evaluation Metrics: You can also set up automated evals. For instance, you can use an LLM to score the output of the agent e.g. if it is helpful, accurate, or not. There are also several open source libraries that help you to score different aspects of the agent. E.g. RAGAS for RAG agents or LLM Guard to detect harmful language or prompt injection.
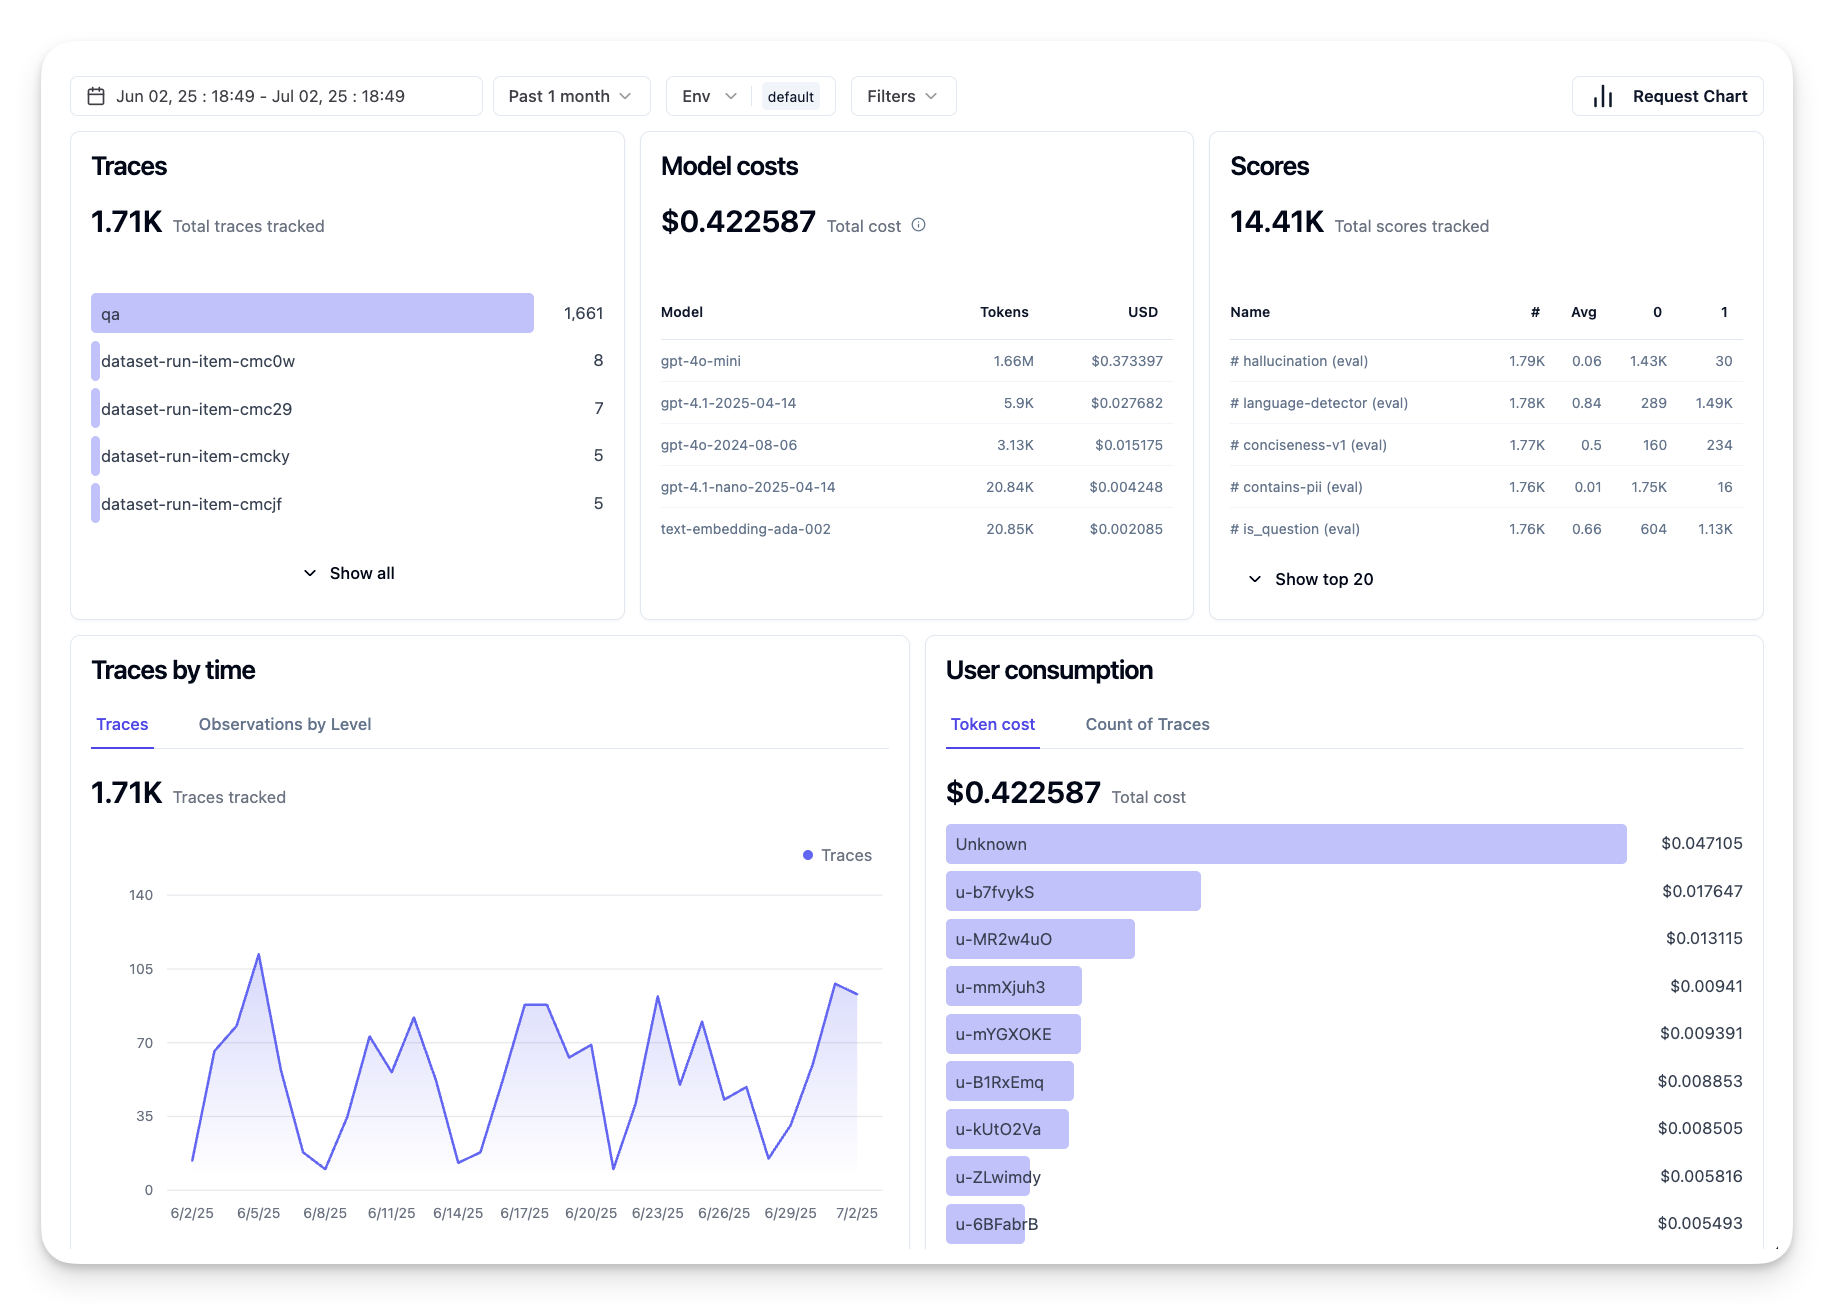
In practice, a combination of these metrics gives the best coverage of an AI agent’s health. In this chapters example notebook, we’ll show you how these metrics looks in real examples but first, we’ll learn how a typical evaluation workflow looks like.
Instrument your Agent
To gather tracing data, you’ll need to instrument your code. The goal is to instrument the agent code to emit traces and metrics that can be captured, processed, and visualized by an observability platform.
OpenTelemetry (OTel): OpenTelemetry has emerged as an industry standard for LLM observability. It provides a set of APIs, SDKs, and tools for generating, collecting, and exporting telemetry data.
There are many instrumentation libraries that wrap existing agent frameworks and make it easy to export OpenTelemetry spans to an observability tool. Microsoft Agent Framework integrates with OpenTelemetry natively. Below is an example on instrumenting a MAF agent:
from agent_framework.observability import get_tracer, get_meter

tracer = get_tracer()
meter = get_meter()

with tracer.start_as_current_span("agent_run"):
    # Agent execution is traced automatically
    pass
The example notebook in this chapter will demonstrate how to instrument your MAF agent.
Manual Span Creation: While instrumentation libraries provides a good baseline, there are often cases where more detailed or custom information is needed. You can manually create spans to add custom application logic. More importantly, they can enrich automatically or manually created spans with custom attributes (also known as tags or metadata). These attributes can include business-specific data, intermediate computations, or any context that might be useful for debugging or analysis, such as user_id, session_id, or model_version.
Example on creating traces and spans manually with the Langfuse Python SDK:
from langfuse import get_client

langfuse = get_client()

span = langfuse.start_span(name="my-span")

span.end()
Agent Evaluation
Observability gives us metrics, but evaluation is the process of analyzing that data (and performing tests) to determine how well an AI agent is performing and how it can be improved. In other words, once you have those traces and metrics, how do you use them to judge the agent and make decisions?
Regular evaluation is important because AI agents are often non-deterministic and can evolve (through updates or drifting model behavior) – without evaluation, you wouldn’t know if your “smart agent” is actually doing its job well or if it’s regressed.
There are two categories of evaluations for AI agents: online evaluation and offline evaluation. Both are valuable, and they complement each other. We usually begin with offline evaluation, as this is the minimum necessary step before deploying any agent.
Offline Evaluation
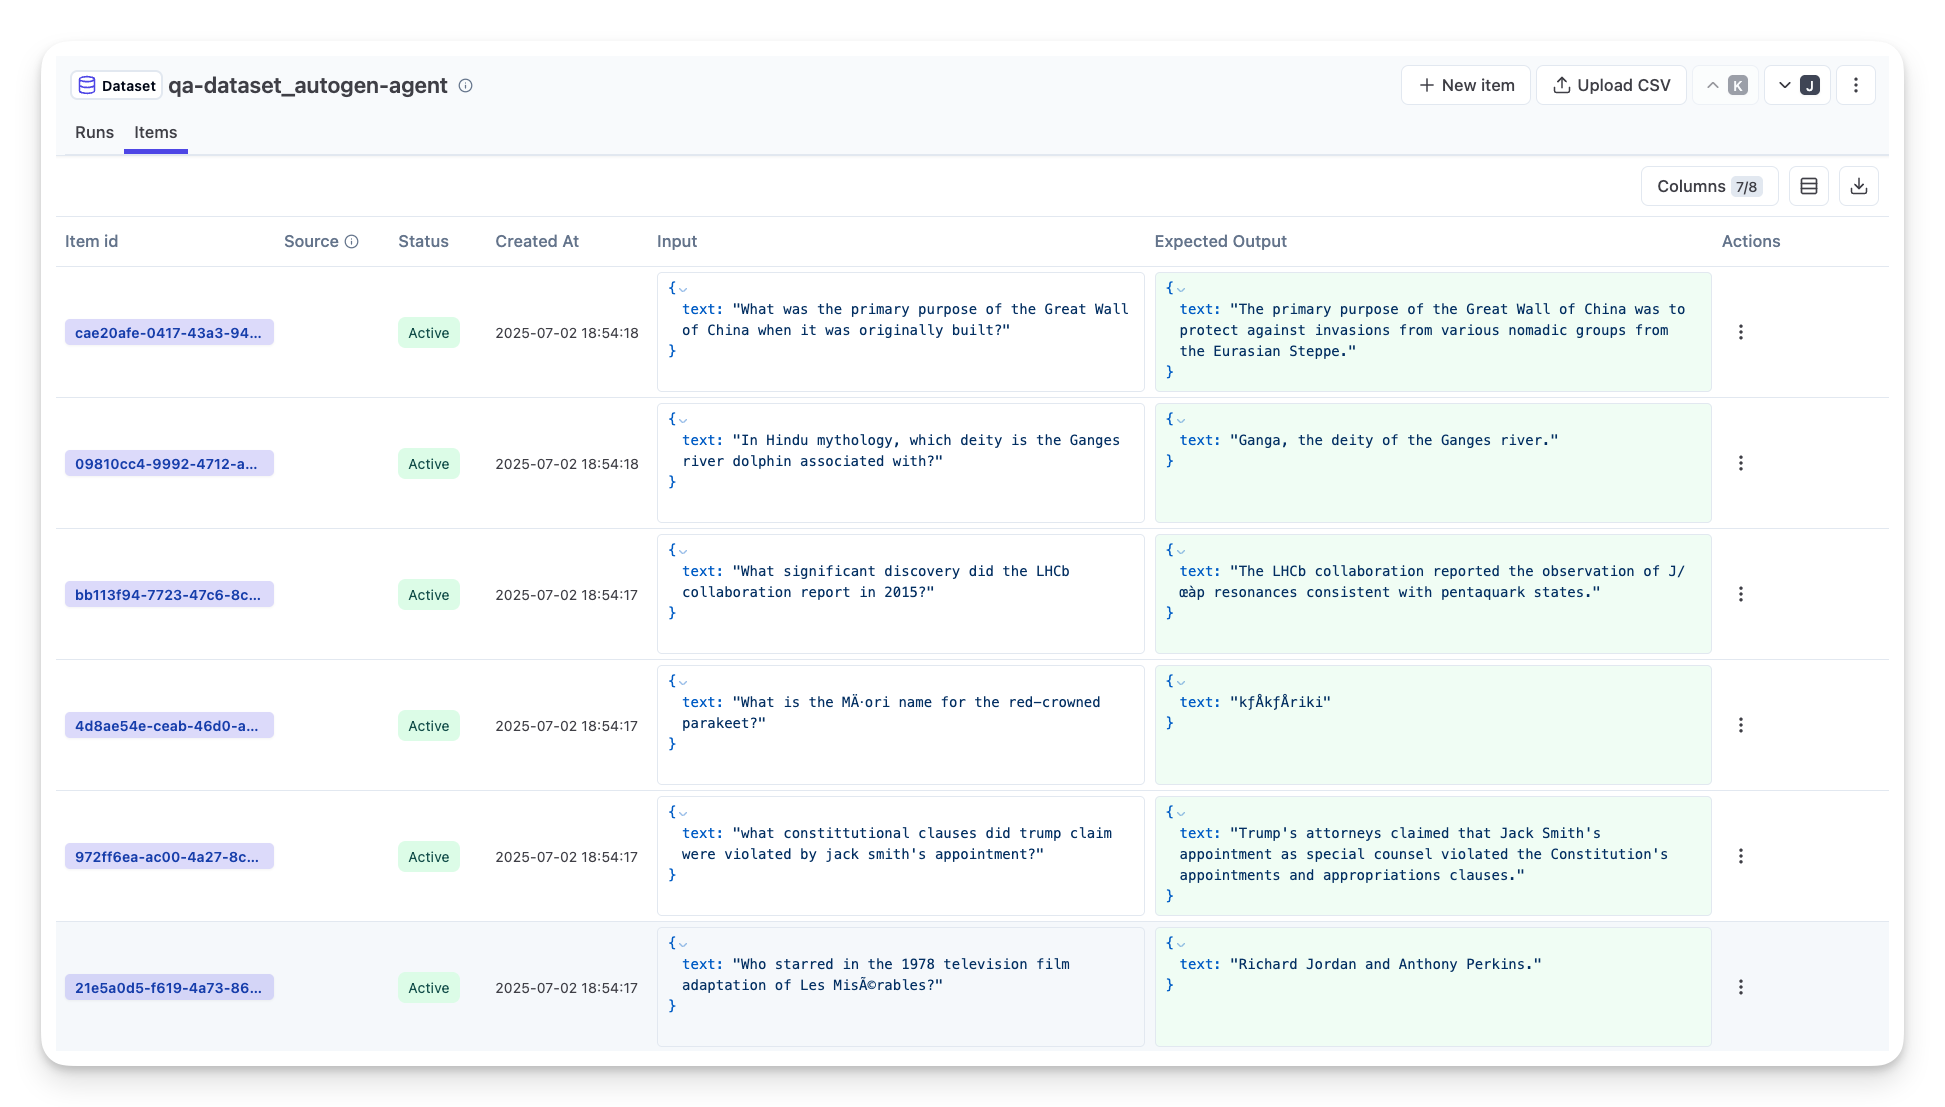
This involves evaluating the agent in a controlled setting, typically using test datasets, not live user queries. You use curated datasets where you know what the expected output or correct behavior is, and then run your agent on those.
For instance, if you built a math word-problem agent, you might have a test dataset of 100 problems with known answers. Offline evaluation is often done during development (and can be part of CI/CD pipelines) to check improvements or guard against regressions. The benefit is that it’s repeatable and you can get clear accuracy metrics since you have ground truth. You might also simulate user queries and measure the agent’s responses against ideal answers or use automated metrics as described above.
The key challenge with offline eval is ensuring your test dataset is comprehensive and stays relevant – the agent might perform well on a fixed test set but encounter very different queries in production. Therefore, you should keep test sets updated with new edge cases and examples that reflect real-world scenarios. A mix of small “smoke test” cases and larger evaluation sets is useful: small sets for quick checks and larger ones for broader performance metrics.
Online Evaluation
This refers to evaluating the agent in a live, real-world environment, i.e. during actual usage in production. Online evaluation involves monitoring the agent’s performance on real user interactions and analyzing outcomes continuously.
For example, you might track success rates, user satisfaction scores, or other metrics on live traffic. The advantage of online evaluation is that it captures things you might not anticipate in a lab setting – you can observe model drift over time (if the agent’s effectiveness degrades as input patterns shift) and catch unexpected queries or situations that weren’t in your test data. It provides a true picture of how the agent behaves in the wild.
Online evaluation often involves collecting implicit and explicit user feedback, as discussed, and possibly running shadow tests or A/B tests (where a new version of the agent runs in parallel to compare against the old). The challenge is that it can be tricky to get reliable labels or scores for live interactions – you might rely on user feedback or downstream metrics (like did the user click the result).
Combining the two
Online and offline evaluations are not mutually exclusive; they are highly complementary. Insights from online monitoring (e.g., new types of user queries where the agent performs poorly) can be used to augment and improve offline test datasets. Conversely, agents that perform well in offline tests can then be more confidently deployed and monitored online.
In fact, many teams adopt a loop:
evaluate offline -> deploy -> monitor online -> collect new failure cases -> add to offline dataset -> refine agent -> repeat.
Common Issues
As you deploy AI agents to production, you may encounter various challenges. Here are some common issues and their potential solutions:
| Issue | Potential Solution |
|---|---|
| AI Agent not performing tasks consistently | - Refine the prompt given to the AI Agent; be clear on objectives. - Identify where dividing the tasks into subtasks and handling them by multiple agents can help. |
| AI Agent running into continuous loops | - Ensure you have clear termination terms and conditions so the Agent knows when to stop the process. - For complex tasks that require reasoning and planning, use a larger model that is specialized for reasoning tasks. |
| AI Agent tool calls are not performing well | - Test and validate the tool’s output outside of the agent system. - Refine the defined parameters, prompts, and naming of tools. |
| Multi-Agent system not performing consistently | - Refine prompts given to each agent to ensure they are specific and distinct from one another. - Build a hierarchical system using a “routing” or controller agent to determine which agent is the correct one. |
Many of these issues can be identified more effectively with observability in place. The traces and metrics we discussed earlier help pinpoint exactly where in the agent workflow problems occur, making debugging and optimization much more efficient.
Managing Costs
Here are some strategies to manage the costs of deploying AI agents to production:
Using Smaller Models: Small Language Models (SLMs) can perform well on certain agentic use-cases and will reduce costs significantly. As mentioned earlier, building an evaluation system to determine and compare performance vs larger models is the best way to understand how well an SLM will perform on your use case. Consider using SLMs for simpler tasks like intent classification or parameter extraction, while reserving larger models for complex reasoning.
Using a Router Model: A similar strategy is to use a diversity of models and sizes. You can use an LLM/SLM or serverless function to route requests based on complexity to the best fit models. This will also help reduce costs while also ensuring performance on the right tasks. For example, route simple queries to smaller, faster models, and only use expensive large models for complex reasoning tasks.
Caching Responses: Identifying common requests and tasks and providing the responses before they go through your agentic system is a good way to reduce the volume of similar requests. You can even implement a flow to identify how similar a request is to your cached requests using more basic AI models. This strategy can significantly reduce costs for frequently asked questions or common workflows.
Lets see how this works in practice
In the example notebook of this section, we’ll see examples of how we can use observability tools to monitor and evaluate our agent.
Got More Questions about AI Agents in Production?
Join the Microsoft Foundry Discord to meet with other learners, attend office hours and get your AI Agents questions answered.