Monitoring
To get some insight into the status of your JobQ queues and workers, the workers can transmit telemetry data (logs) to a centralized ‘Azure Application Insights’ instance. That information can then be used to make, for example, Grafana dashboards.
Steps:
Create a Log Analytics workspace in the project’s resource group if not existing already. Use the naming convention
{project}-la. DO NOT re-use the Log Analytics workspace associated to an Azure ML workspace, this will complicate things later on.Create an Application Insights instance in the project’s resource group if not existing already. Make sure to reference the Log Analytics workspace from step 1. Use the naming convention
{project}-appinsights. DO NOT re-use the Application Insights instance associated to an Azure ML workspace, this will complicate things later on.Supply two environment variables to your worker to connect it to App Insights.
APPLICATIONINSIGHTS_CONNECTION_STRING. You can get this from your App Insights instance in the “Overview” tab.JOBQ_ENVIRONMENT_NAME. This is just an arbitrary identifier of where the worker runs. Could include the instance type, region, or cluster name. Will be used for grouping in the dashboard.
Viewing the data
Plain App Insights queries
You can query the logs in App Insights or the connected Log Analytics workspace directly. Try a query like:
    traces
    | where message startswith "Task starting"
    | limit 100
In Log Analytics (the service that App Insights uses under the hood), the names of the collections are slightly different, for example AppTraces instead of Traces.
JobQ track
The built-in dashboard provides a live view of queue activity, worker health, and resource utilization. Install the optional dependencies and run:
pip install ai4s-jobq[track]
ai4s-jobq <queue-spec> track <LOG_ANALYTICS_WORKSPACE_ID>
The workspace argument accepts several formats:
A Log Analytics workspace UUID (from the “Overview” tab in the portal)
A Log Analytics workspace name (resolved via Azure Resource Graph)
A full resource ID (
/subscriptions/.../providers/.../workspaces/...)An Application Insights instrumentation key (UUID, resolved to the backing workspace)
An Application Insights connection string (
InstrumentationKey=...;...)
You can also set it via the JOBQ_LA_WORKSPACE environment variable, or let
it be inferred from APPLICATIONINSIGHTS_CONNECTION_STRING or
APPLICATIONINSIGHTS_INSTRUMENTATIONKEY if set.
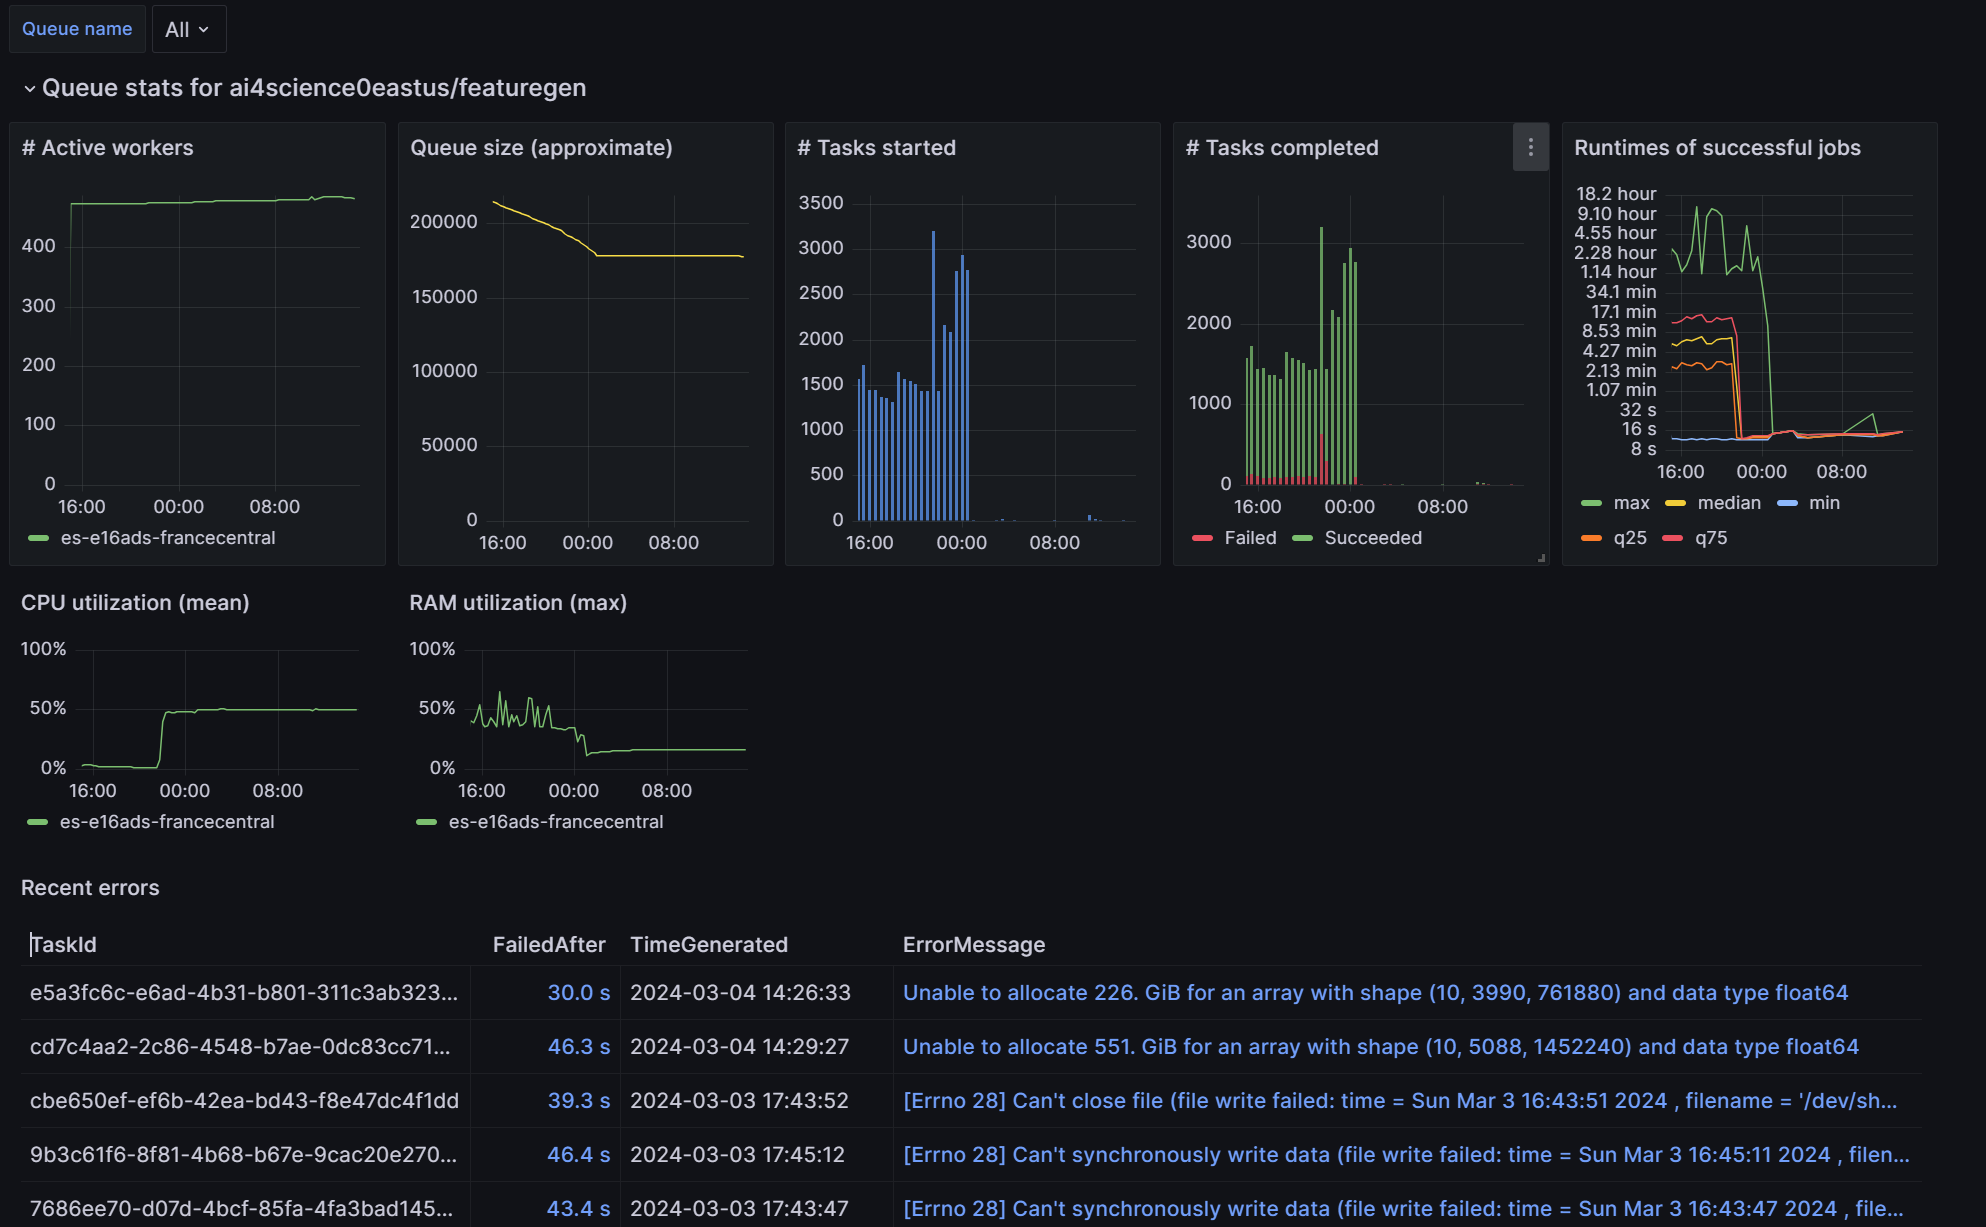
The dashboard opens in your browser and includes:
Stat cards—succeeded/failed per day, per worker-day, avg time to success/failure
Task panels—queue size, tasks starting, tasks completed/failed, task runtimes (fan chart with percentile bands), daily moving average, preemption events
Workforce section—active workers (stacked area), active environments, worker churn, worker lifetime distribution, time-to-preemption and tasks-per-preemption by environment, CPU and RAM utilization (fan charts)
Errors section—recent error messages with stack traces
Use the toolbar to select a queue, adjust the time range, toggle between overall and per-environment grouping, and change the refresh interval. Click the ⛶ button on any graph to expand it to fullscreen.
Grafana dashboard
Create a Grafana instance if not existing already. This is typically shared across projects.
Import the pre-made dashboard into Grafana if not existing already. Make sure to assign the “Monitoring Reader” role for your Grafana system identity to your project resource groups (or whole subscription) so that the dashboard can read the JobQ logs.
Navigate to the JobQ dashboard, select the correct Subscription and Log Analytics workspace from the dropdowns, and make sure everything works, meaning no errors are shown and some data points are visible while workers are running.