Gridplot: Visualize Multiple Graphs
This example provides how to visualize graphs using the gridplot.
[1]:
import graspologic

import numpy as np
%matplotlib inline
Overlaying two sparse graphs using gridplot
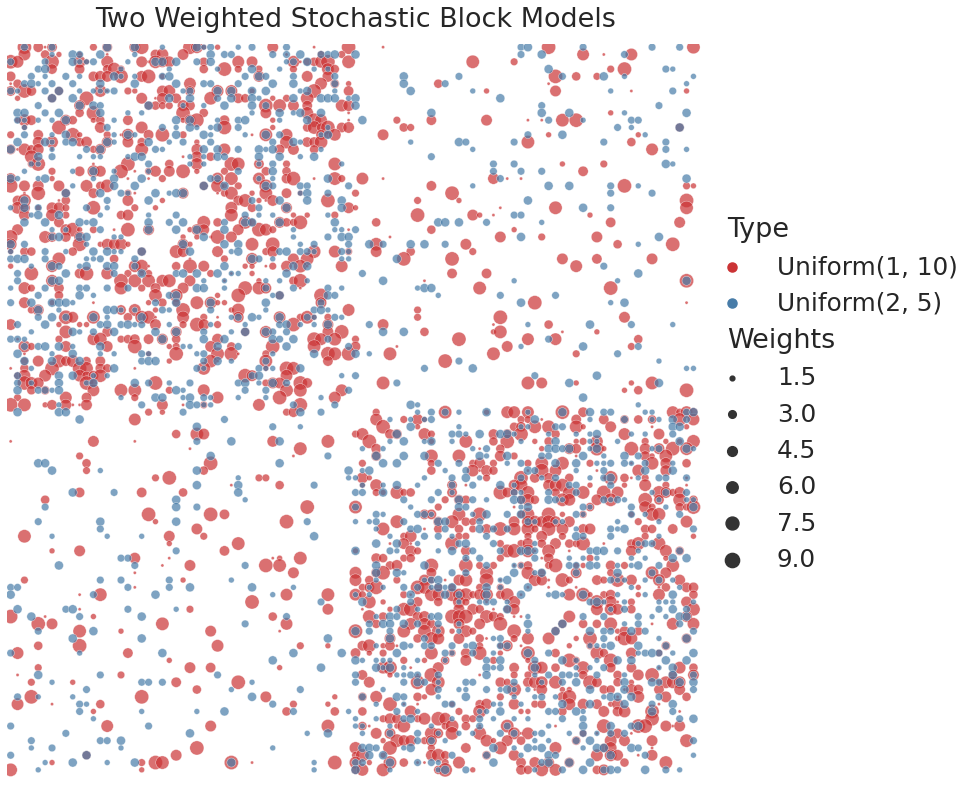
Simulate more graphs using weighted stochastic block models
The 2-block model is defined as below:
\begin{align*} P = \begin{bmatrix}0.25 & 0.05 \\ 0.05 & 0.25 \end{bmatrix} \end{align*}
We generate two weighted SBMs where the weights are distributed from a discrete uniform(1, 10) and discrete uniform(2, 5).
[2]:
from graspologic.simulations import sbm

n_communities = [50, 50]
p = np.array([[0.25, 0.05], [0.05, 0.25]])
wt = np.random.randint
wtargs = dict(low=1, high=10)

np.random.seed(1)
A_unif1= sbm(n_communities, p, wt=wt, wtargs=wtargs)

wtargs = dict(low=2, high=5)
A_unif2= sbm(n_communities, p, wt=wt, wtargs=wtargs)
Visualizing both graphs
[3]:
from graspologic.plot import gridplot

X = [A_unif1, A_unif2]
labels = ["Uniform(1, 10)", "Uniform(2, 5)"]

f = gridplot(X=X,
             labels=labels,
             title='Two Weighted Stochastic Block Models',
             height=12,
             font_scale=1.5)