Exercise 7: Monitoring and Alerting
Task 1 - Azure Monitor for Containers
Access the Azure Portal to view Azure Monitor for Containers:
- Go to the Azure Portal ( https://portal.azure.com )
- Navigate to your AKS cluster
- Click on “Monitoring” in the left menu
- Select “Insights” to view the dashboard
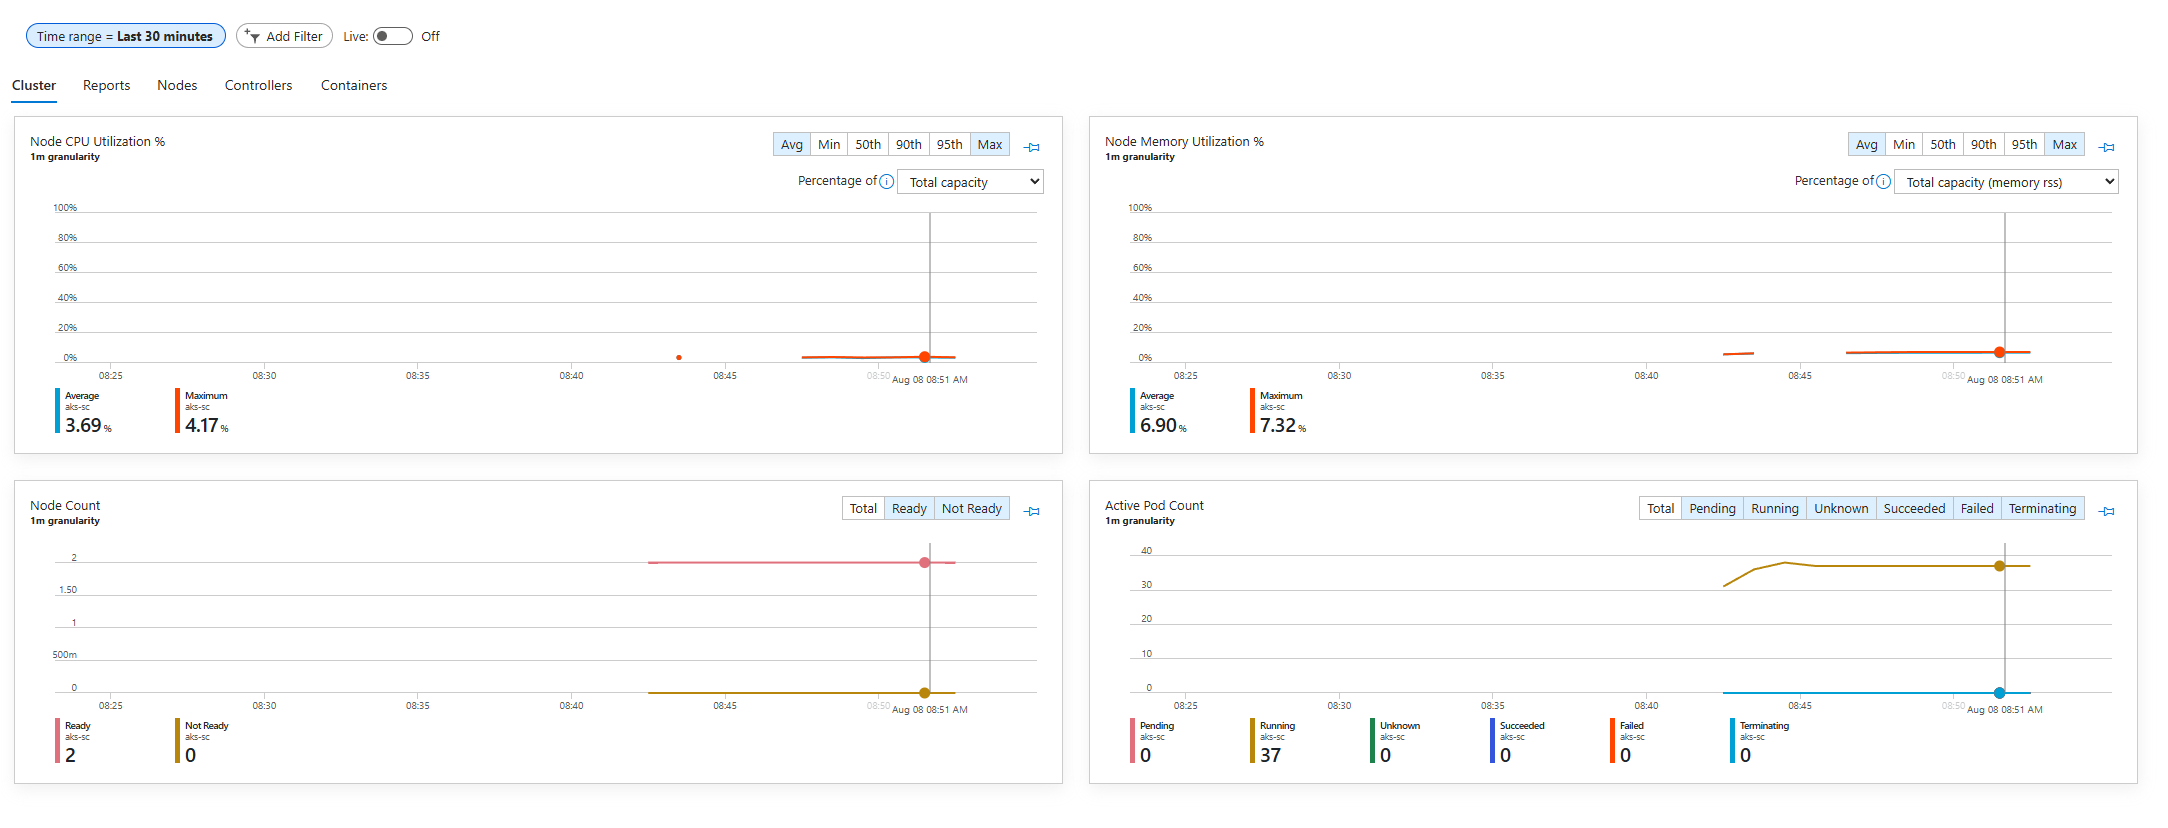
Explore the monitoring interface:
- Cluster tab: Overall cluster health
- Nodes tab: Node-level metrics
- Controllers tab: Deployment and StatefulSet metrics
- Containers tab: Individual container metrics
Task 2 - Creating a Load for Monitoring
Deploy a sample application to generate metrics:
2. Deploy a target service:$loadGenerator = @" apiVersion: apps/v1 kind: Deployment metadata: name: load-generator spec: replicas: 2 selector: matchLabels: app: load-generator template: metadata: labels: app: load-generator spec: containers: - name: load-generator image: ghcr.io/microsoft/k8s-on-azure-workshop/busybox:latest command: ["/bin/sh"] args: ["-c", "while true; do dd if=/dev/zero of=/dev/null bs=1M count=1000; sleep 5; done"] resources: requests: memory: "64Mi" cpu: "100m" limits: memory: "128Mi" cpu: "200m" "@ $loadGenerator | kubectl apply -f -cat << EOF | kubectl apply -f - apiVersion: apps/v1 kind: Deployment metadata: name: load-generator spec: replicas: 2 selector: matchLabels: app: load-generator template: metadata: labels: app: load-generator spec: containers: - name: load-generator image: ghcr.io/microsoft/k8s-on-azure-workshop/busybox:latest command: ["/bin/sh"] args: ["-c", "while true; do dd if=/dev/zero of=/dev/null bs=1M count=1000; sleep 5; done"] resources: requests: memory: "64Mi" cpu: "100m" limits: memory: "128Mi" cpu: "200m" EOFkubectl create deployment monitoring-demo --image=ghcr.io/microsoft/k8s-on-azure-workshop/nginx:latest --replicas=3 kubectl expose deployment monitoring-demo --port=80 --type=ClusterIPkubectl create deployment monitoring-demo --image=ghcr.io/microsoft/k8s-on-azure-workshop/nginx:latest --replicas=3 kubectl expose deployment monitoring-demo --port=80 --type=ClusterIPGenerate HTTP traffic to the service:
# Create a pod to generate traffic
$trafficGenerator = @"
apiVersion: v1
kind: Pod
metadata:
  name: traffic-generator
spec:
  containers:
  - name: traffic-generator
    image: ghcr.io/microsoft/k8s-on-azure-workshop/busybox:latest
    command: ["/bin/sh"]
    args: ["-c", "while true; do wget -q -O- http://monitoring-demo; sleep 0.5; done"]
"@

$trafficGenerator | kubectl apply -f -
# Create a pod to generate traffic cat << EOF | kubectl apply -f - apiVersion: v1 kind: Pod metadata: name: traffic-generator spec: containers: - name: traffic-generator image: ghcr.io/microsoft/k8s-on-azure-workshop/busybox:latest command: ["/bin/sh"] args: ["-c", "while true; do wget -q -O- http://monitoring-demo; sleep 0.5; done"] EOFWait a few minutes for metrics to be collected, you can continue on with the rest of the tasks in this excersise whilst you wait for data to be populated.
Return to the Azure Portal to observe the cluster metrics. You can adjust the time range to show the last 30 minutes to see more granular data.
Task 3 - Creating Azure Monitor Alerts
From the Azure Portal, navigate to your AKS cluster.
Click on “Alerts” in the left menu, then “Create” and “Alert rule”.
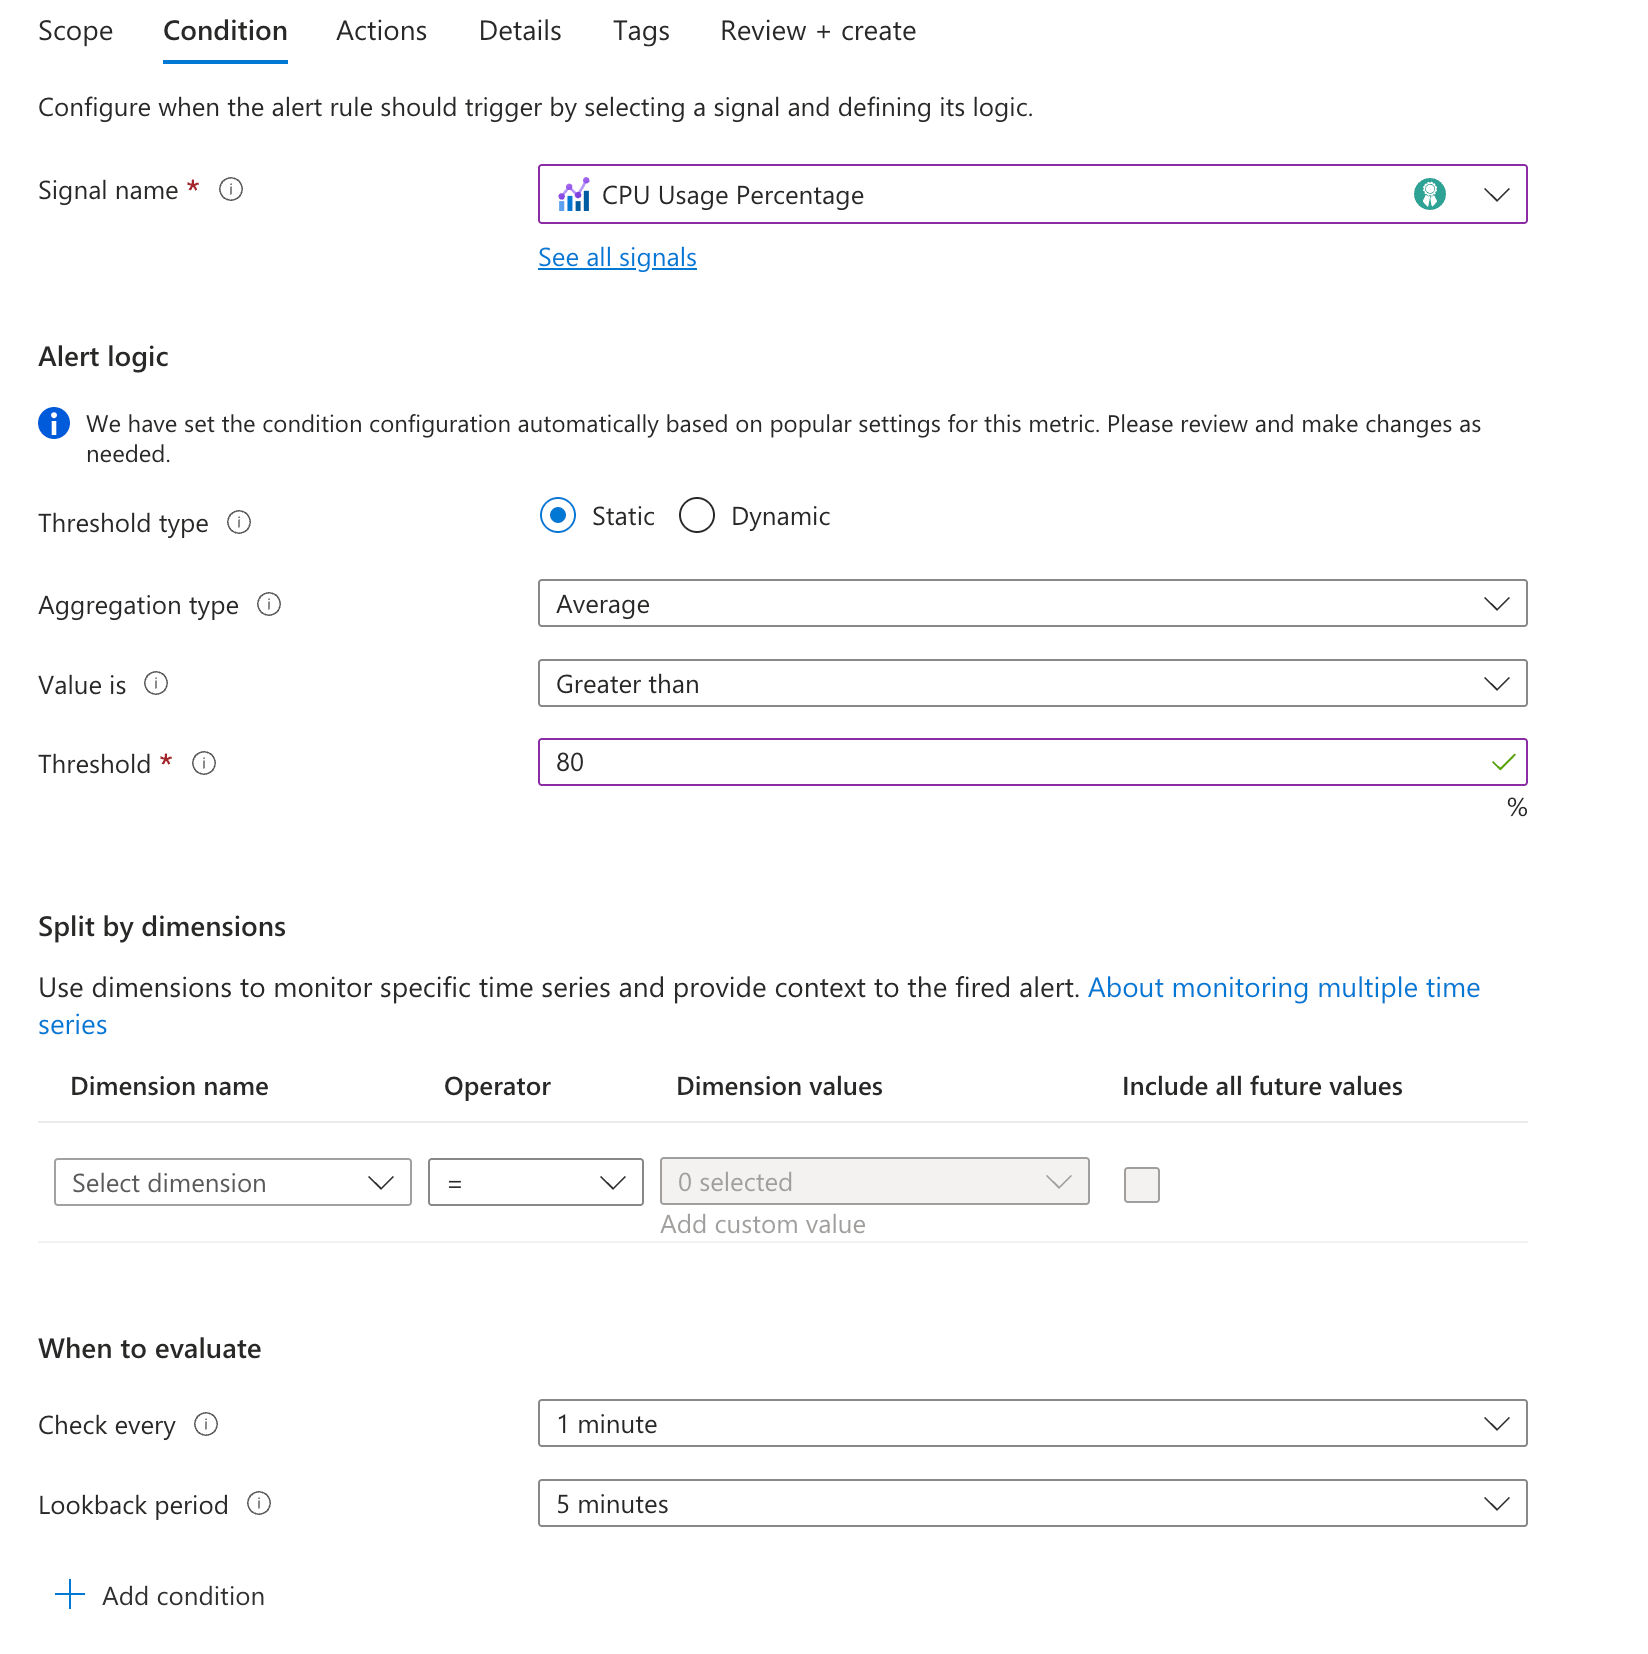
Create a CPU usage alert:
- Select “CPU Usage Percentage” as the signal
- Set the threshold to 80%
- Set the evaluation frequency to 1 minute
- Move to the “Details” tab
- Name the alert “High CPU Usage”
- Set the severity to “Sev 2 - Warning”
- Create the alert
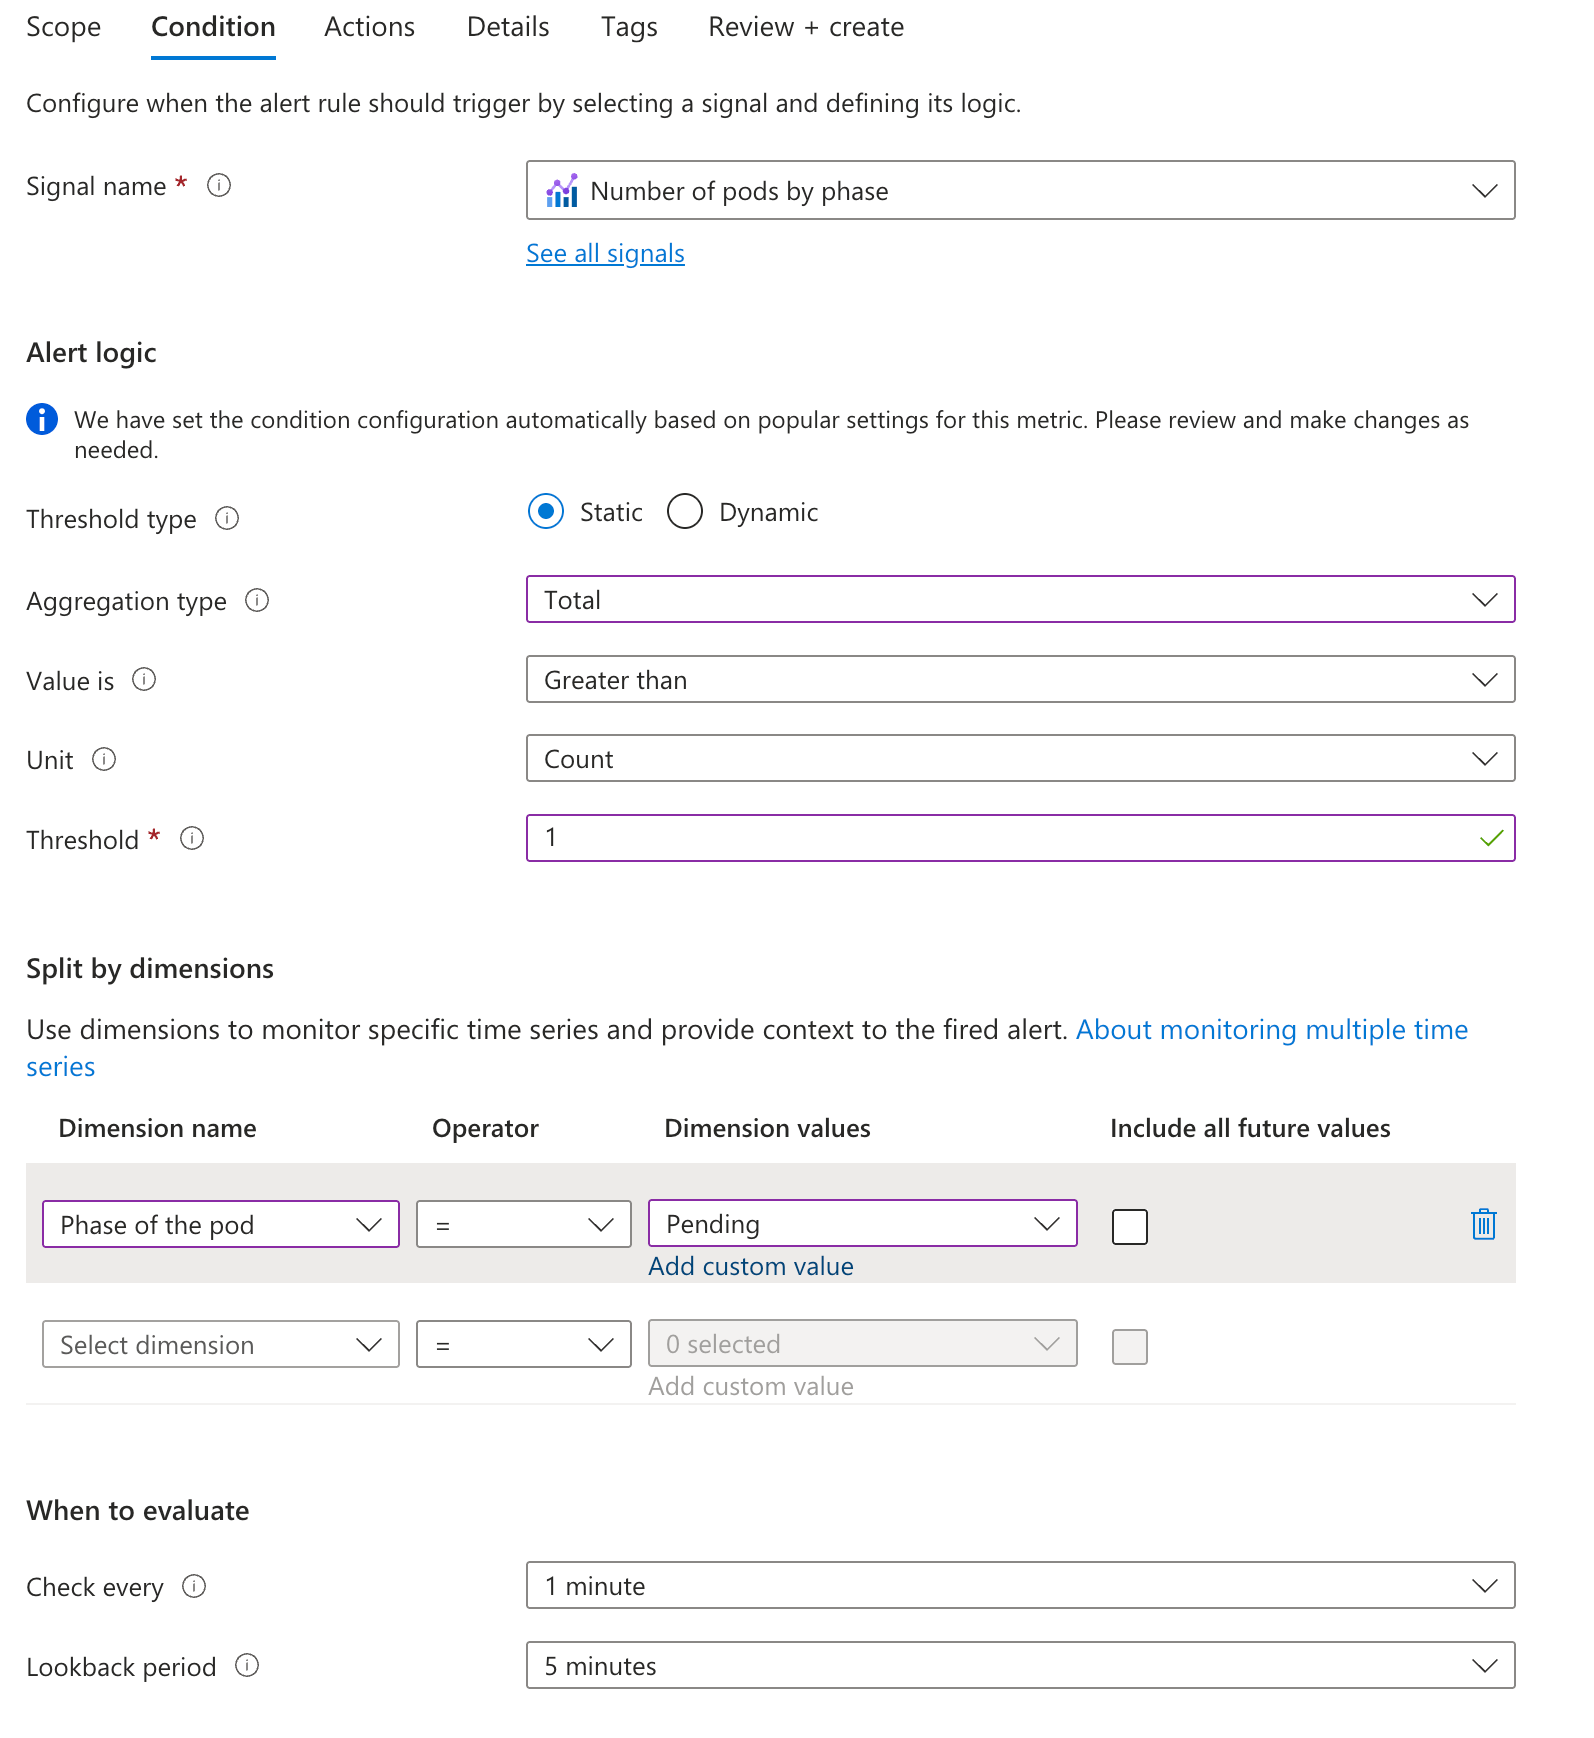
- Create a pending pod alert, indicating that there are resource issues:
- Select “Number of Pods by Phase” as the signal
- Set the aggregation type to “total” and the threshold to 1
- Set the evaluation frequency to 1 minutes
- Set the split by dimension to “Phase of the pod”
- Set the dimension values drop down to “Pending”
- Name the alert “Pod Restart Alert”
Task 4 - Creating Custom Dashboards
In the Azure Portal, navigate to “Dashboard” from the left-hand menu.
Click “Create dashboard” and select “Custom dashboard”.
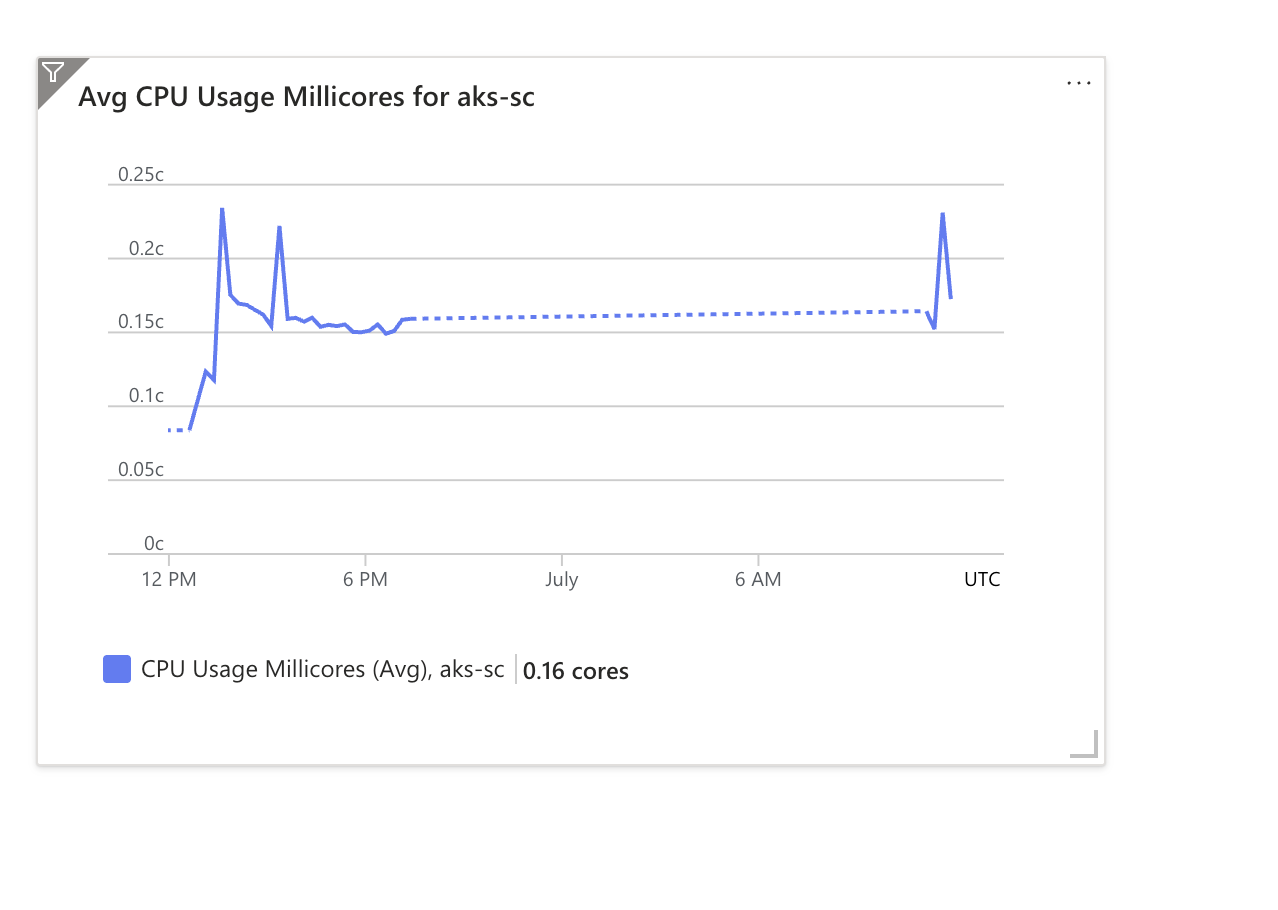
Add tiles to your dashboard:
- In the Tile Gallery, select “Metrics chart” and click “Add”
- Click save on the dashboard (you cannot select metrics until it is saved)
- Click the “Edit in Metrics” banner
- Expand your resource group, then choose your AKS cluster as the resource
- Select metrics like:
- Node CPU Usage
- Node Memory Usage
- Pod Count
- Container CPU Usage
- Container Restart Count
- Click “Save to Dashboard” to save your changes
Task 5 - Log Analytics
From the Azure Portal, navigate to your AKS cluster.
In the Monitoring menu, click on Logs.
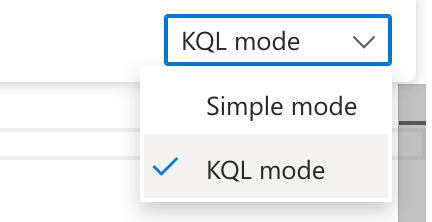
At the top right, select the dropdown that currently shows “Simple mode” and switch to “KQL mode” to access the full query editor.
Try the following sample queries (don’t forget to substitute in your resource names!):
Container Restarts:
KubePodInventory
| where ClusterName == "<your-cluster-name>"
| where PodStatus == "Running"
| project TimeGenerated, Computer, ClusterName, Namespace, Name, PodStatus, PodRestartCount
| sort by PodRestartCount desc
Node CPU Usage:
Perf
| where ObjectName == "K8SNode"
| where CounterName == "cpuUsageNanoCores"
| summarize AvgCPUUsage = avg(CounterValue) by Computer, bin(TimeGenerated, 5m)
| render timechart
Container Memory Usage:
 KubePodInventory
 | where isnotempty(Computer) // eliminate unscheduled pods
 | where PodStatus in ('Running')
 | extend ContainerIdentifier=tostring(split(ContainerName, '/')[1])
 | extend InstanceName=strcat(ClusterId, '/', PodUid, '/', ContainerIdentifier)
 | distinct Name, InstanceName
 | join kind=inner
     (Perf
     | where ObjectName == 'K8SContainer'
     | where CounterName == "cpuUsageNanoCores")
     on InstanceName
 | project CpuUsage=(CounterValue / 1e+9), TimeGenerated, Name
 | render timechart;
Task 6 - Clean Up
Clean up the resources created in this exercise:
kubectl delete deployment load-generator monitoring-demo
kubectl delete service monitoring-demo
kubectl delete pod traffic-generator
kubectl delete deployment load-generator monitoring-demo kubectl delete service monitoring-demo kubectl delete pod traffic-generator