Azure Monitor
Monitoring AKS effectively means covering both your infrastructure and your applications. Azure provides three key tools that work together:
- Azure Monitor collects and analyses telemetry from all Azure resources.
- Container Insights builds on this to give you Kubernetes-specific visibility.
- Application Insights focuses on application performance and user experience.
Using all three, you get a complete view from cluster health to app behaviour, making it easier to troubleshoot, optimize, and deliver reliable services.
Azure Monitor
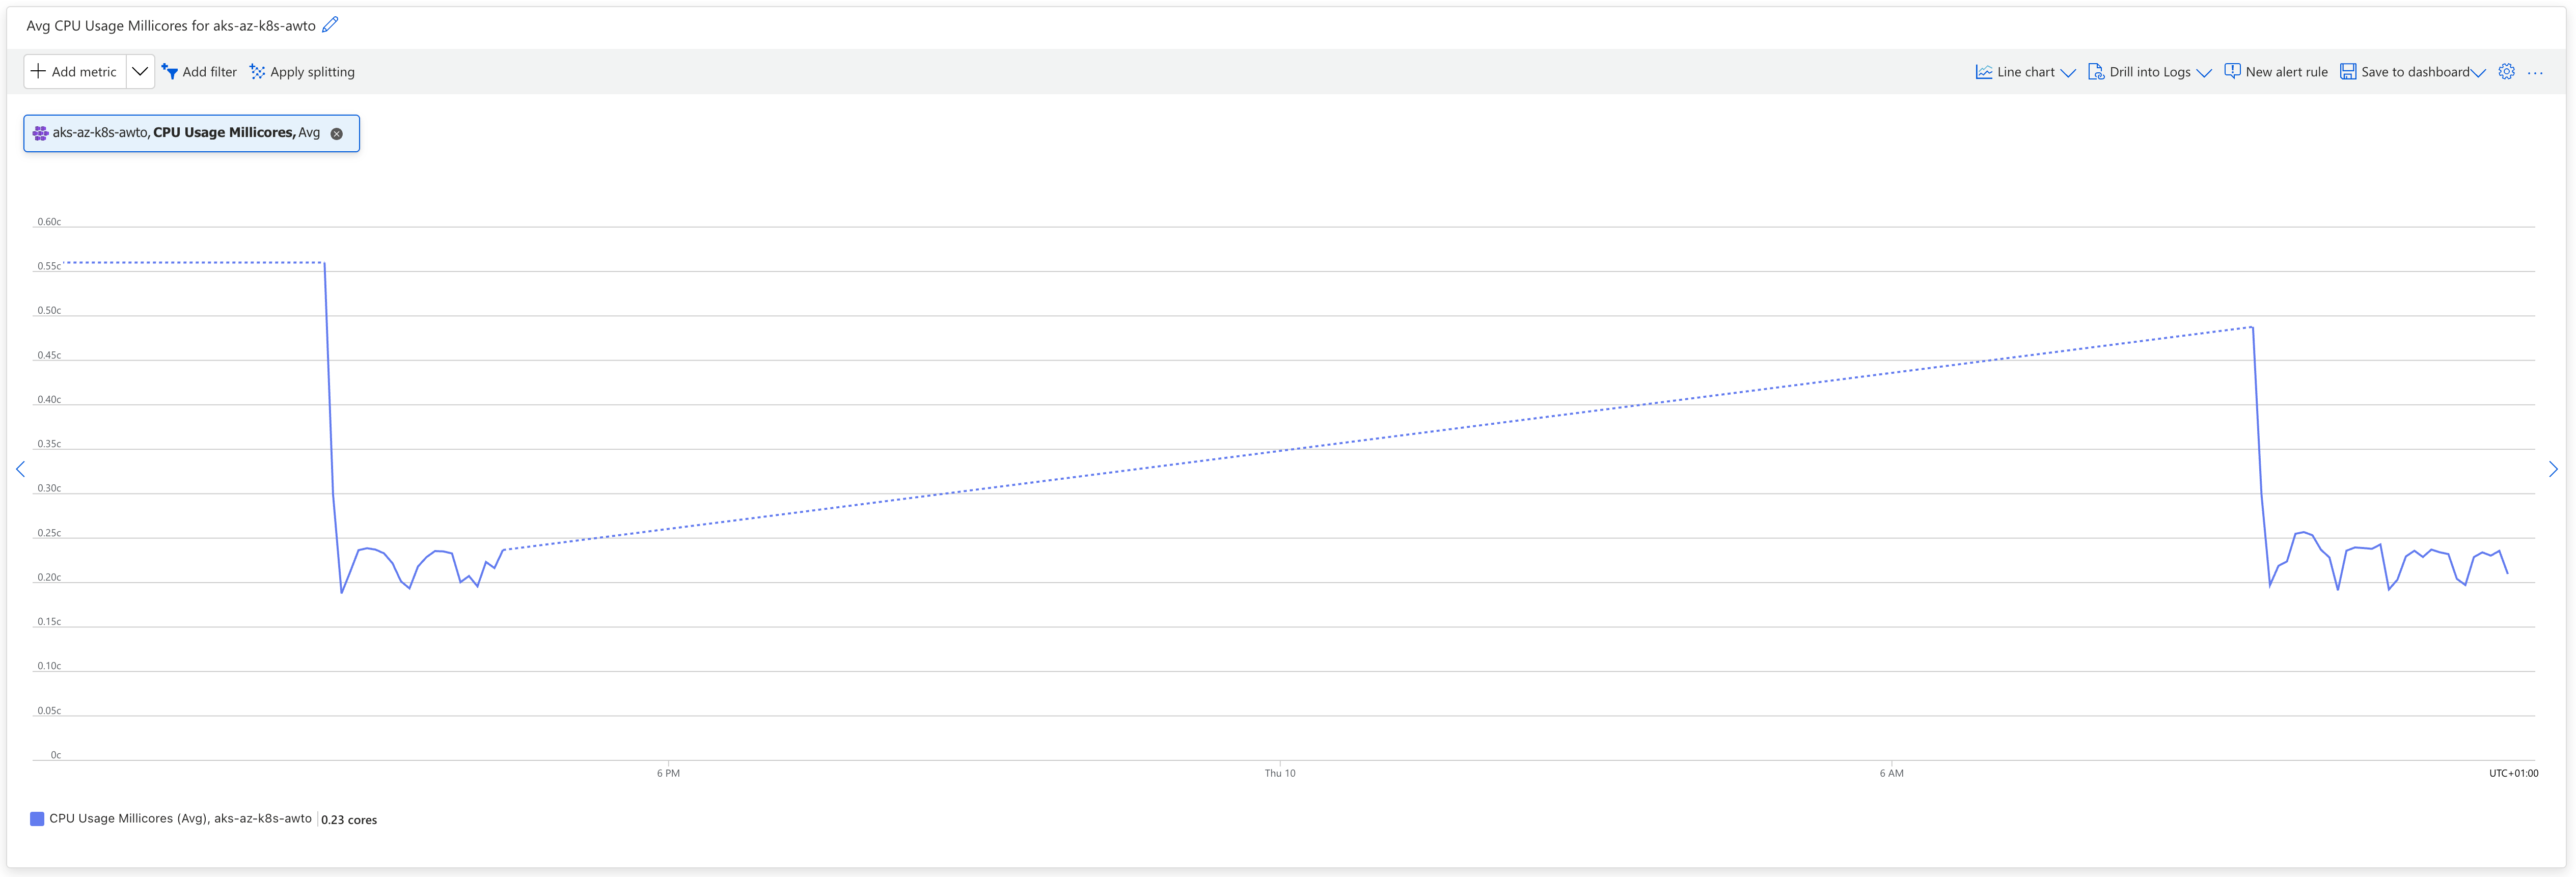
Azure Monitor is Microsoft’s unified platform for collecting, analysing, and acting on telemetry from your cloud and on-premises resources. It provides a central place to monitor the performance and health of your entire Azure environment — including virtual machines, databases, applications, and, importantly, Kubernetes clusters.
With Azure Monitor, you can:
- Collect metrics and logs from Azure resources.
- Set up alerts and automated actions.
- Visualize data with dashboards and workbooks.
- Analyze trends and diagnose issues using advanced analytics.
For AKS, Azure Monitor provides the backbone for collecting and storing monitoring data, but it’s not specifically tailored to the unique needs of Kubernetes environments on its own.
Container Insights
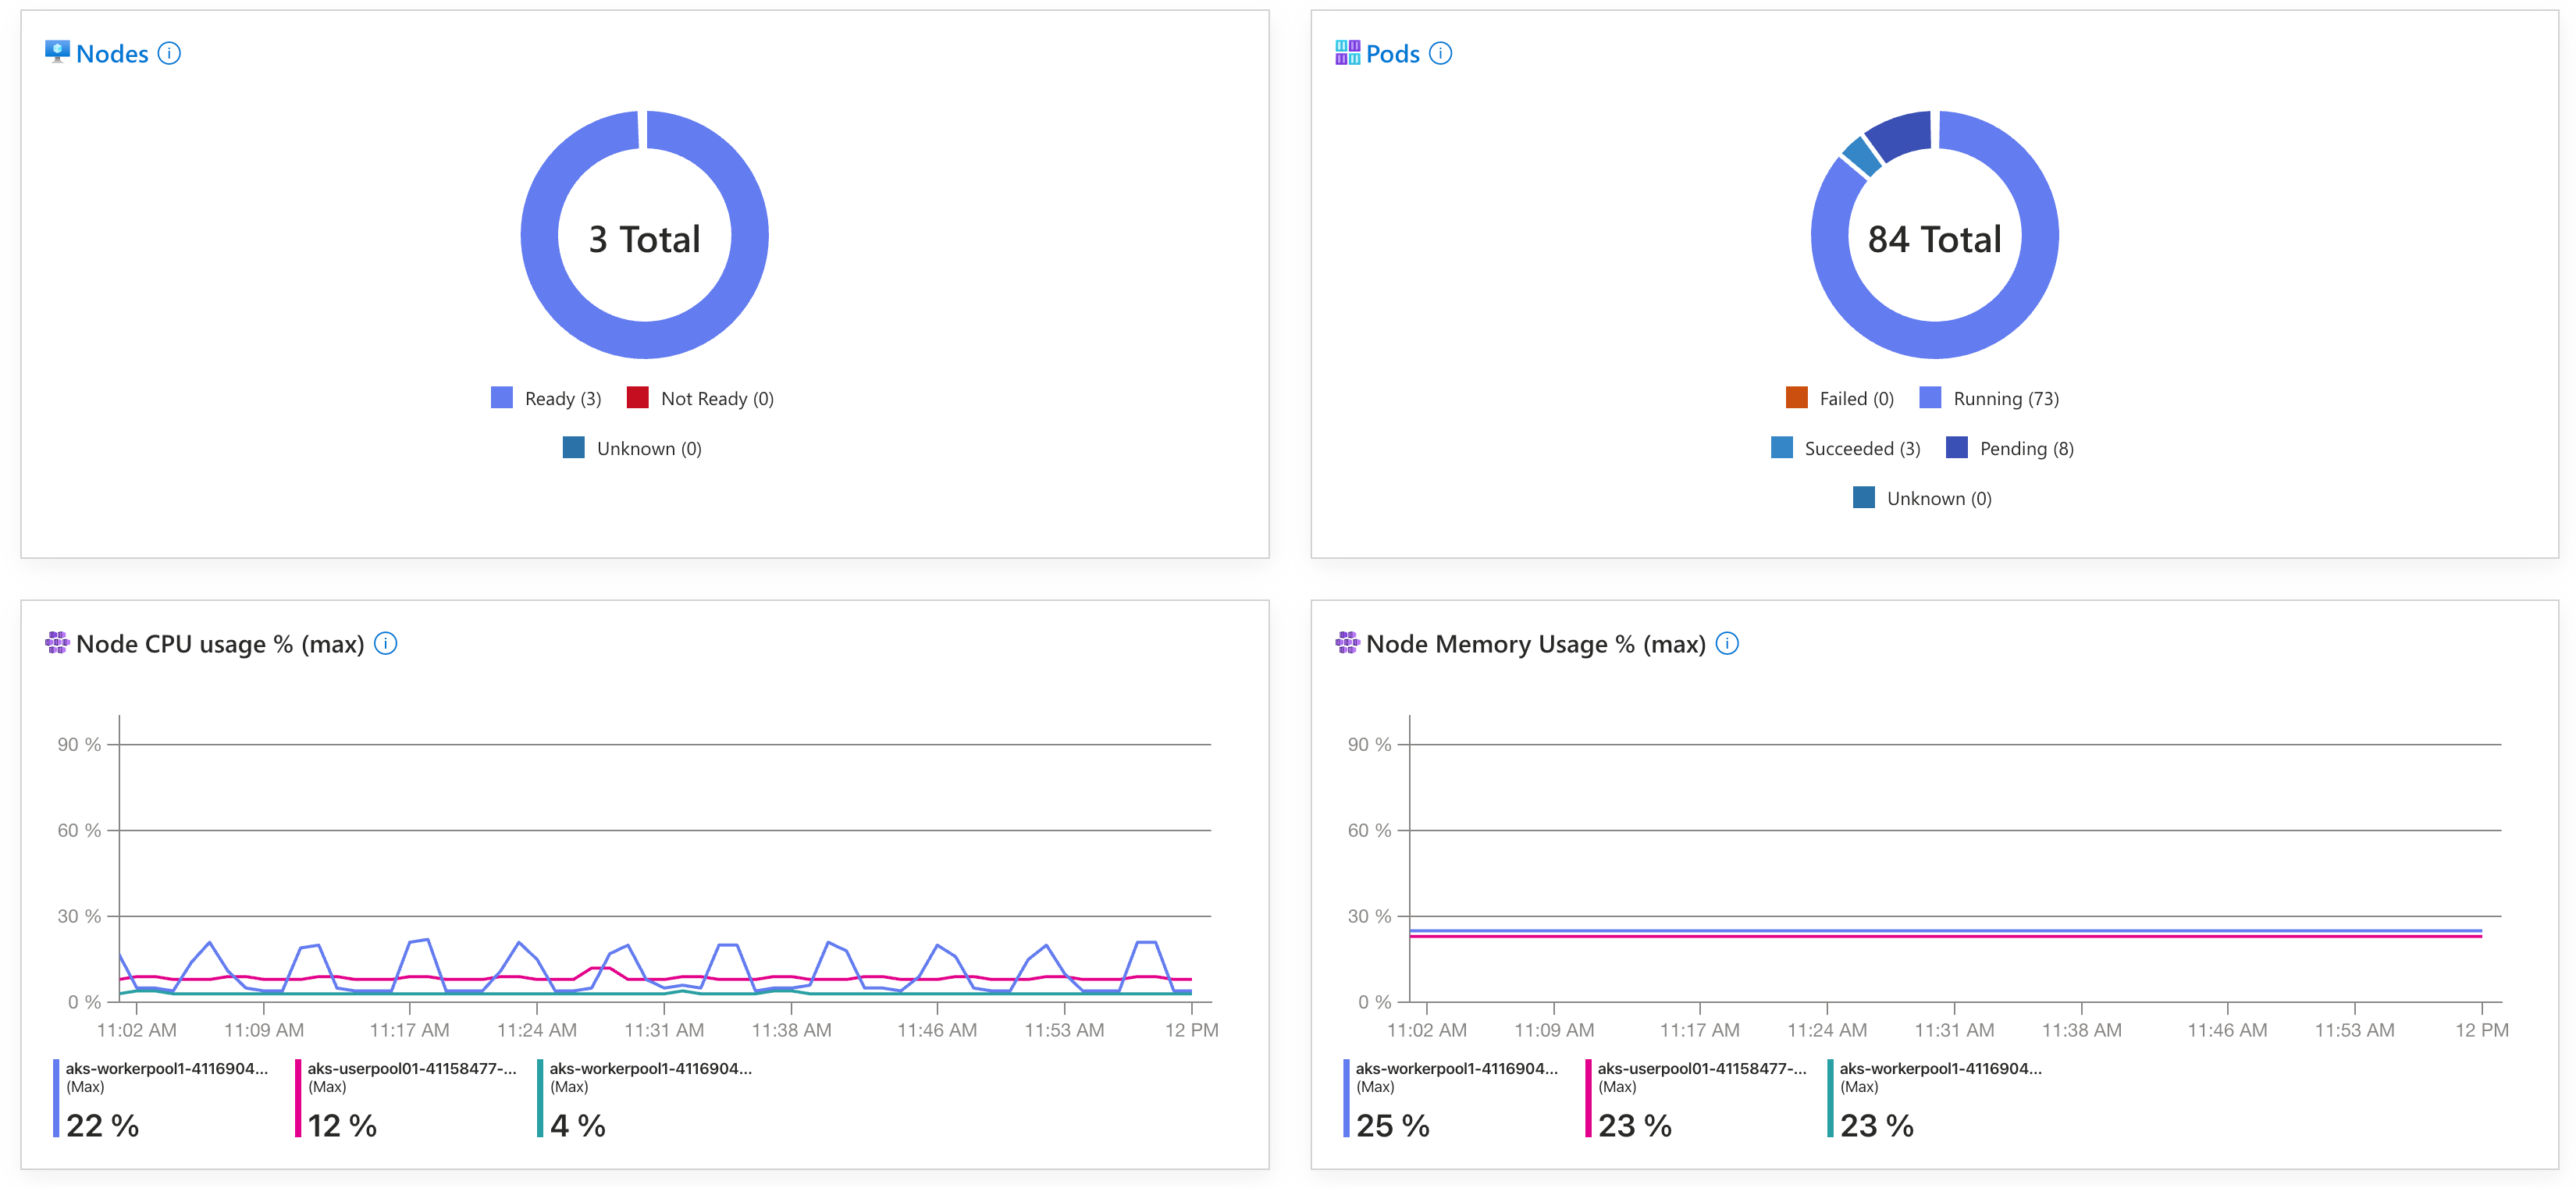
Container Insights is a feature built on top of Azure Monitor, designed specifically for monitoring Kubernetes clusters, including AKS. It extends Azure Monitor’s capabilities by providing deep, Kubernetes-aware insights and visualizations.
With Container Insights, you get:
- Cluster-wide visibility: See the health and performance of nodes, controllers, pods, and containers.
- Live data: Real-time views of resource utilization, workloads, and infrastructure.
- Log analytics: Centralized collection and querying of container logs and events.
- Pre-built dashboards: Visualizations tailored for Kubernetes, such as node maps, pod status, and workload performance.
Container Insights collects significantly more detailed telemetry than Azure Monitor alone, making it easier to troubleshoot issues specific to Kubernetes workloads. This can also increase the cost of monitoring, so it’s important to configure it thoughtfully to balance visibility with cost.
Container Insights needs to be enabled for your AKS cluster, which can be done during cluster creation or later through the Azure portal or CLI. Once enabled, it automatically deploys a monitoring agent to your cluster that collects metrics and logs from the Kubernetes API server, nodes, and containers. This data is stored in your log analytics workspace, where you can query and visualize it using Kusto Query Language (KQL). Container Insights also adds a set of Kubernetes specific workbooks and dashboards to Azure Monitor, providing a rich set of pre-built visualizations for common Kubernetes metrics and logs.
Application Insights
Application Insights is an application performance management (APM) service that is part of Azure Monitor. While Azure Monitor and Container Insights focus on infrastructure and platform telemetry, Application Insights is designed to monitor the performance, availability, and usage of your actual applications — regardless of where they run.
Key Features:
- Tracks application requests, dependencies, exceptions, and performance.
- Provides distributed tracing for microservices and APIs.
- Offers powerful analytics for user behaviour and application usage.
- Supports custom telemetry and logging from your application code.
In AKS, you can instrument your applications (e.g., .NET, Java, Node.js) to send telemetry to Application Insights, giving you end-to-end visibility from the infrastructure all the way to the user experience.