Managed Prometheus and Grafana
Monitoring Kubernetes environments may require more flexibility and depth than standard cloud-native tools provide. While Azure Monitor and Container Insights offer a strong foundation for AKS observability, Azure’s managed Prometheus and Grafana services deliver advanced, Kubernetes-native monitoring and visualisation capabilities. These services are ideal for teams needing custom metrics, detailed dashboards, and integration with the wider open-source ecosystem.
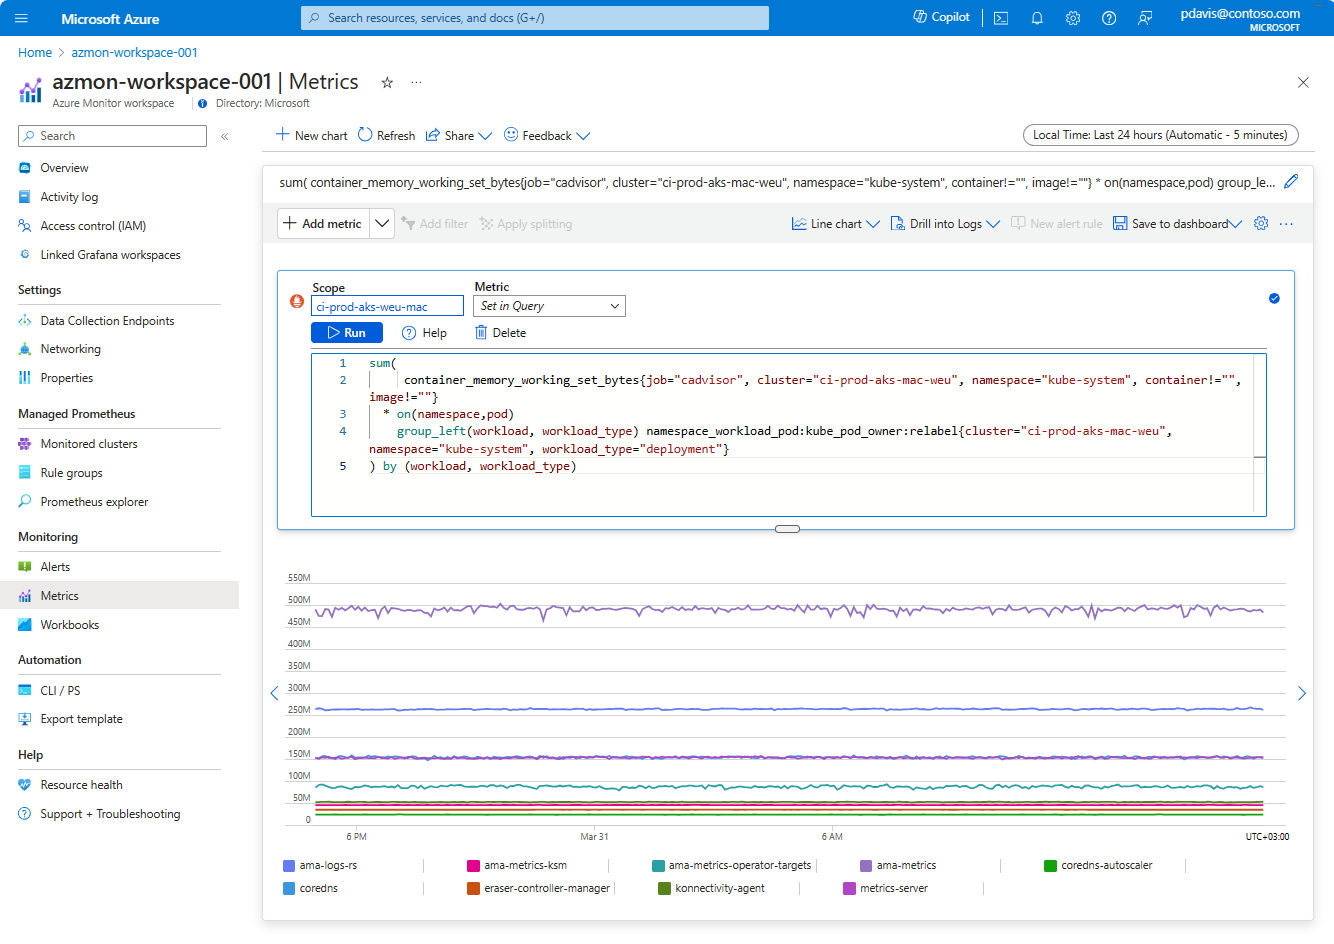
Managed Prometheus
Prometheus is the industry-standard, open-source system for collecting and querying time-series metrics, especially in Kubernetes environments. Azure’s managed Prometheus service allows you to use Prometheus without the operational burden of deploying, scaling, or maintaining it yourself — Azure handles the infrastructure, updates, and integration.
Why use managed Prometheus with AKS?
- Kubernetes-native metrics: Prometheus is designed for Kubernetes, making it easy to collect detailed metrics from your cluster, workloads, and applications.
- Custom metrics and exporters: You can monitor a wide range of systems and applications using Prometheus exporters, or expose your own custom metrics from your code.
- Granular, real-time data: Prometheus provides high-resolution, real-time metrics, which are essential for performance tuning and troubleshooting.
- Open-source compatibility: Many Kubernetes tools and add-ons natively expose Prometheus metrics, making integration straightforward.
Where does Prometheus add value beyond Azure Monitor / Container Insights?
- When you need to collect custom or application-specific metrics not available in Container Insights.
- For advanced use cases, such as monitoring third-party services, databases, or legacy systems using Prometheus exporters.
- When you require more granular or frequent metric collection than Azure Monitor typically provides.
Tip
When using Container Insights at the same time as managed Prometheus, you have the option to have Container Insights collect metrics from managed Prometheus rather than storing them in Log Analytics. This can reduce costs and improve efficiency. See here for more details: Switch to using Managed Prometheus visualizations in Azure Monitor .
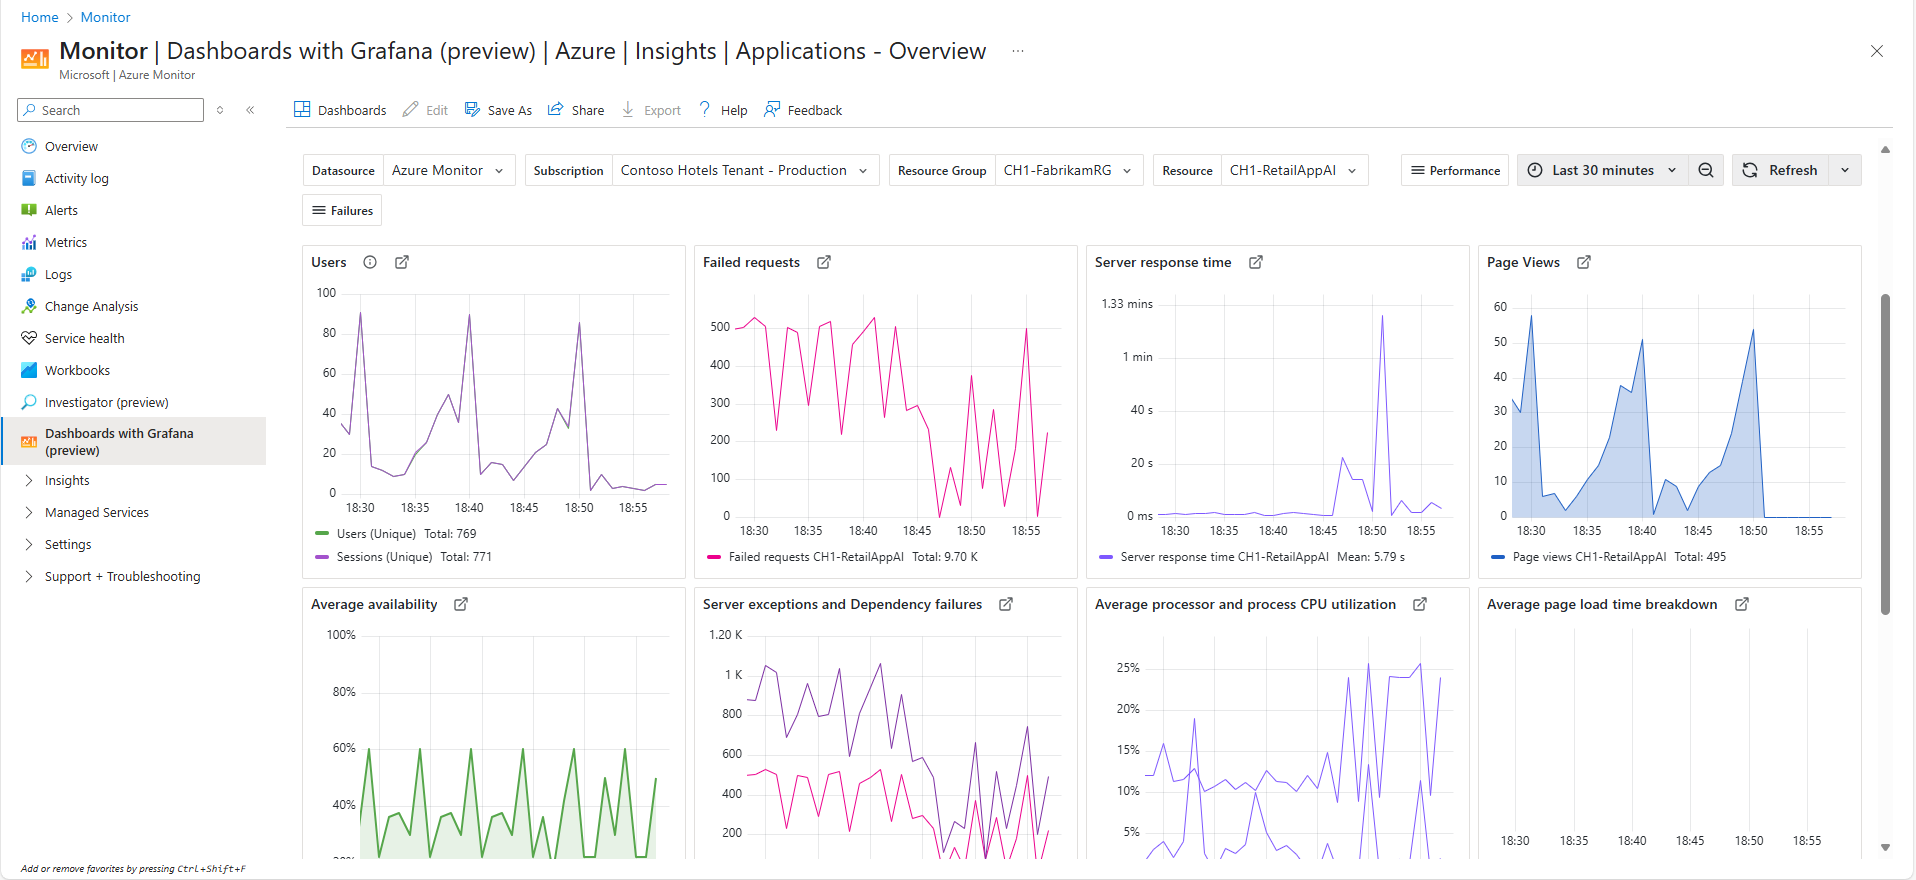
Managed Grafana
Grafana is a leading open-source platform for visualising and analysing metrics from a variety of sources, including Prometheus. Azure’s managed Grafana service provides a fully managed, scalable, and secure environment for building and sharing dashboards — without the need to manage the underlying infrastructure.
Why use managed Grafana with AKS?
- Advanced visualisation: Grafana offers highly customisable dashboards, rich visualisations, and a large library of community templates tailored for Kubernetes and cloud-native workloads.
- Powerful alerting: Set up complex, multi-source alerts and route notifications to your preferred channels (email, Teams, Slack, etc.).
- Seamless integration: Managed Grafana integrates with Azure Active Directory for secure access and can connect to Azure Monitor, Prometheus, and other data sources.
- Collaboration: Easily share dashboards and insights across teams, supporting collaborative troubleshooting and decision-making.
Where does Grafana add value beyond Azure Monitor / Container Insights?
- When you need bespoke dashboards or advanced visualisations that go beyond the standard Azure Monitor or Container Insights workbooks.
- For teams that want to combine data from multiple sources (e.g., Prometheus, Azure Monitor, third-party APIs) into unified dashboards.
- When you require advanced alerting logic or wish to leverage the extensive Grafana plugin ecosystem.