Core Troubleshooting Techniques
Effective troubleshooting in Azure Kubernetes Service (AKS) relies on a combination of Kubernetes-native commands, Azure platform features, and third-party utilities. Familiarity with these tools will help you quickly diagnose and resolve issues across your cluster and workloads.
Kubernetes-Native Tools
kubectl
The primary command-line tool for interacting with Kubernetes clusters. Key commands include:
kubectl describe– View detailed information about resources, including status and recent events.kubectl logs– Retrieve logs from containers to investigate application errors or crashes.kubectl exec– Run commands inside a running container for real-time debugging.kubectl get events– List recent events in the cluster, which can highlight scheduling failures, image pull errors, or resource constraints.kubectl debug– A newer command that provides an interactive debugging session for pods, allowing you to inspect and modify resources on the fly.
For more details on using these commends, see the Kubectl Troubleshooting Tools section.
Kubernetes Dashboard
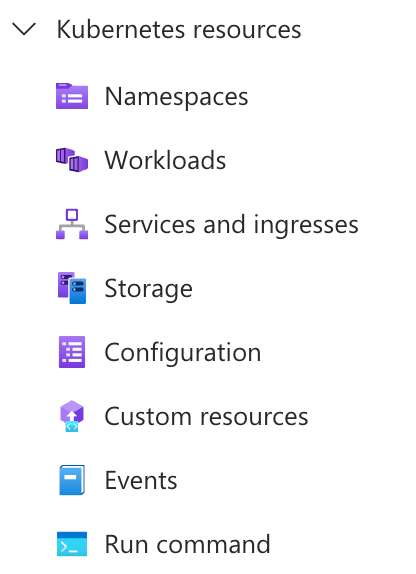
The Kubernetes-provided dashboard is not recommended for production use due to security concerns, and the add-on to enable this has been deprecated in AKS with Kubernetes 1.19 or later. Instead, it is recommended to use the functionality in the Azure portal to view workloads running in AKS, with additional functionality provided by Azure Monitor and Container Insights.
Azure Platform Tools
Azure Portal Diagnostics
The AKS resource blade in the Azure Portal offers built-in diagnostics, node health checks, and guided troubleshooting for common issues.
Azure CLI
Use the Azure Command-Line Interface to access cluster logs, check node status, and perform remedial actions directly from your terminal.
Azure Monitor and Container Insights
Visualise metrics, logs, and events from your AKS cluster, helping you spot trends and anomalies that may indicate underlying problems.
Third-Party Utilities
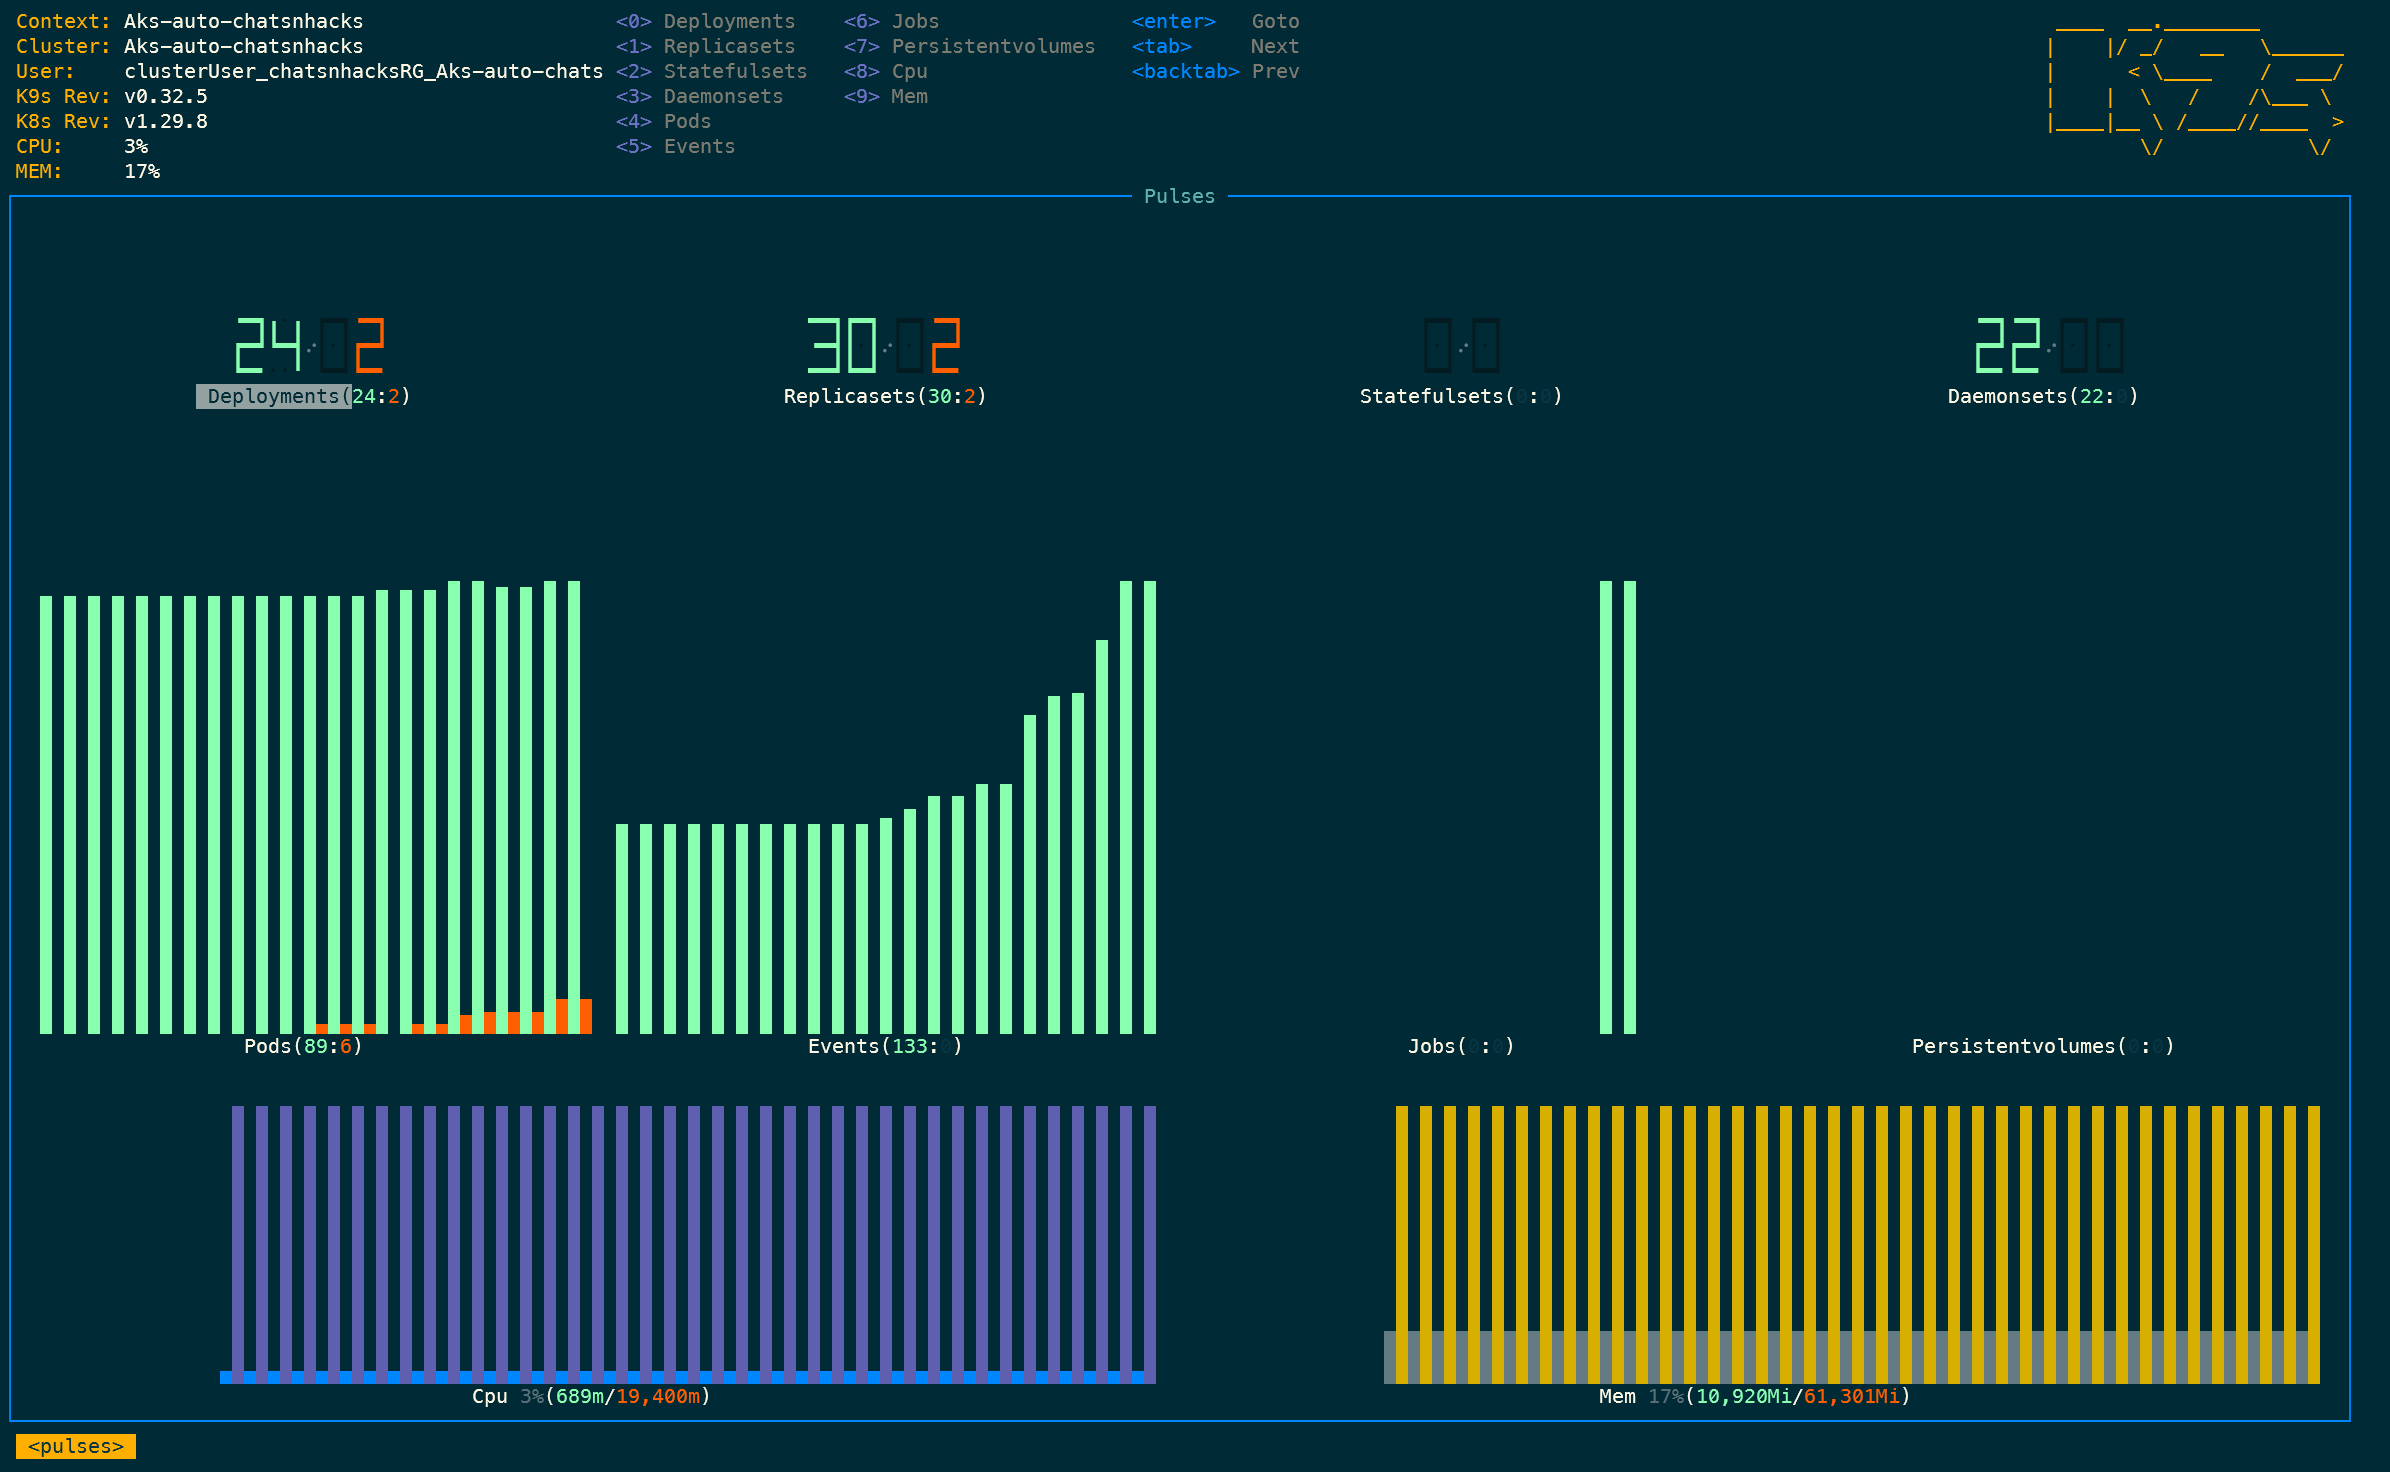
k9s
A popular terminal-based UI for real-time cluster management and troubleshooting, allowing you to navigate resources, view logs, and execute commands efficiently.
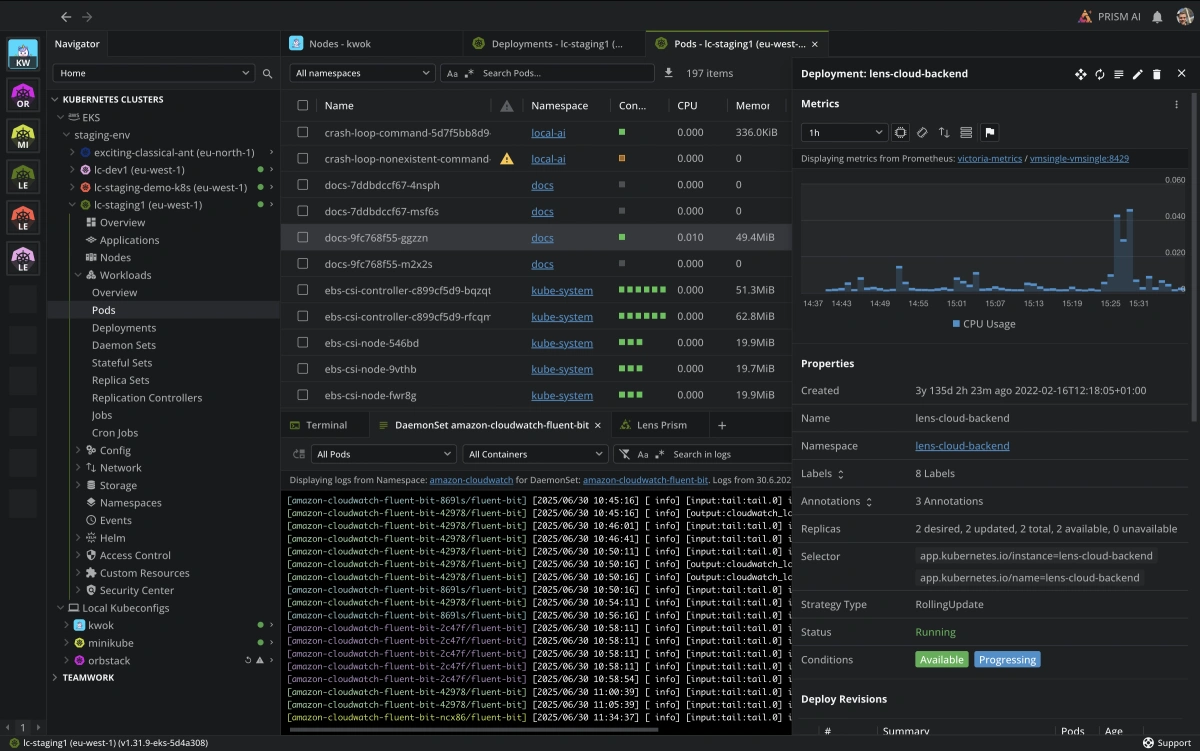
Lens
A desktop application that provides a rich graphical interface for managing Kubernetes clusters, including resource visualisation, logs, and terminal access.
Other Monitoring Platforms
Tools such as Datadog, New Relic, and Sysdig can provide additional analytics, alerting, and visualisation capabilities, especially in multi-cloud or hybrid environments.
Choosing the Right Tool
The best tool for the job often depends on the nature of the issue:
- Start with
kubectlfor immediate, resource-level investigation. - Use Azure Portal and CLI for infrastructure-level diagnostics and guided troubleshooting.
- Leverage monitoring platforms for historical analysis, alerting, and trend identification.
- Employ third-party tools for advanced use cases or when integrating with existing observability workflows.