Kubectl Troubleshooting Tools
When working with Kubernetes, effective troubleshooting is crucial for maintaining healthy applications and clusters. The kubectl command-line tool provides a comprehensive set of commands for diagnosing and resolving issues. This guide covers the essential kubectl troubleshooting tools and techniques.
Core Troubleshooting Commands
1. kubectl describe
The describe command provides detailed information about Kubernetes resources, including events, status, and configuration.
Syntax
kubectl describe <resource-type> <resource-name>
kubectl describe <resource-type>/<resource-name>
Common Examples
# Describe a specific pod
kubectl describe pod my-app-pod

# Describe all pods in the current namespace
kubectl describe pods

# Describe a pod in a specific namespace
kubectl describe pod my-app-pod -n production

# Describe a deployment
kubectl describe deployment my-app

# Describe a service
kubectl describe service my-service

# Describe a node
kubectl describe node worker-node-1
Key Information Provided
- Resource metadata: Name, namespace, labels, annotations
- Spec configuration: Desired state and configuration
- Status: Current state and conditions
- Events: Recent events related to the resource
- Volumes: Mounted volumes and their status
- Network: IP addresses, ports, and endpoints
Example Output Analysis
kubectl describe pod failing-pod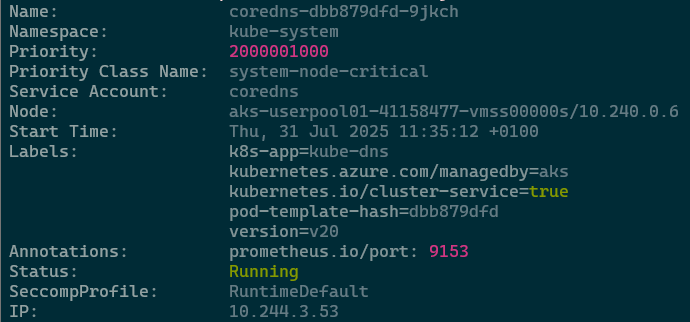
Look for:
- Status: Running, Pending, Failed, etc.
- Restart Count: High restart counts indicate issues
- Events: Error messages, scheduling issues, image pull problems
- Conditions: Ready, Initialized, PodScheduled status
2. kubectl logs
The logs command retrieves container logs, essential for debugging application issues.
Syntax
kubectl logs <pod-name>
kubectl logs <pod-name> -c <container-name>
Advanced Log Options
# Get logs from the previous container instance
kubectl logs my-pod --previous

# Follow logs in real-time
kubectl logs my-pod -f

# Get logs from the last hour
kubectl logs my-pod --since=1h

# Get logs from a specific time
kubectl logs my-pod --since-time=2024-01-01T10:00:00Z

# Get last 100 lines
kubectl logs my-pod --tail=100

# Get logs from all containers in a pod
kubectl logs my-pod --all-containers=true

# Get logs from a specific container in a multi-container pod
kubectl logs my-pod -c sidecar-container

# Get logs from all pods with a specific label
kubectl logs -l app=my-app

# Get logs with timestamps
kubectl logs my-pod --timestamps
Debugging with Logs
# Check for errors in application logs
kubectl logs my-app-pod | grep -i error

# Monitor logs continuously
kubectl logs my-app-pod -f | grep -i "exception\|error\|fail"

# Save logs to a file for analysis
kubectl logs my-app-pod > app-logs.txt
3. kubectl exec
The exec command allows you to execute commands inside running containers for interactive debugging.
Syntax
kubectl exec <pod-name> -- <command>
kubectl exec -it <pod-name> -- <shell>
Common Debugging Commands
# Start an interactive shell session
kubectl exec -it my-pod -- /bin/bash
kubectl exec -it my-pod -- /bin/sh

# Execute a specific command
kubectl exec my-pod -- ls -la /app

# Check processes running in the container
kubectl exec my-pod -- ps aux

# Check network connectivity
kubectl exec my-pod -- ping google.com
kubectl exec my-pod -- nslookup kubernetes.default.svc.cluster.local

# Check disk usage
kubectl exec my-pod -- df -h

# Check environment variables
kubectl exec my-pod -- env

# Test application endpoints
kubectl exec my-pod -- curl localhost:8080/health

# For multi-container pods, specify the container
kubectl exec -it my-pod -c my-container -- /bin/bash
Network Troubleshooting Examples
# Test DNS resolution
kubectl exec my-pod -- nslookup my-service

# Check if a service is reachable
kubectl exec my-pod -- curl my-service:80

# Test external connectivity
kubectl exec my-pod -- wget -qO- http://httpbin.org/ip

# Check listening ports
kubectl exec my-pod -- netstat -tulpn
4. kubectl get events
Events provides a chronological log of what’s happening in your cluster.
Syntax
kubectl get events
kubectl get events --sort-by=.metadata.creationTimestamp
Filtering Events
# Get events for a specific namespace
kubectl get events -n production

# Get events for the last hour
kubectl get events --field-selector involvedObject.kind=Pod

# Get events for a specific resource
kubectl get events --field-selector involvedObject.name=my-pod

# Get warning and error events only
kubectl get events --field-selector type!=Normal

# Sort events by timestamp
kubectl get events --sort-by='.lastTimestamp'

# Watch events in real-time
kubectl get events --watch
Event Types to Watch For
- FailedScheduling: Pod cannot be scheduled
- FailedMount: Volume mount failures
- ImagePullBackOff: Container image pull issues
- CrashLoopBackOff: Container keeps crashing
- NetworkNotReady: Network configuration issues
5. kubectl get with Wide Output
Get detailed information about resources with additional columns.
# Get pods with additional information
kubectl get pods -o wide

# Get nodes with detailed information
kubectl get nodes -o wide

# Get services with endpoints
kubectl get services -o wide

# Get all resources in a namespace
kubectl get all -o wide
6. kubectl top
Monitor resource usage (requires metrics server).
# Get CPU and memory usage for nodes
kubectl top nodes

# Get CPU and memory usage for pods
kubectl top pods

# Get resource usage for pods in a specific namespace
kubectl top pods -n production

# Sort by CPU usage
kubectl top pods --sort-by=cpu

# Sort by memory usage
kubectl top pods --sort-by=memory
7. kubectl debug
The debug command provides an interactive debugging session for pods, allowing you to inspect and modify resources on the fly.
Syntax
# Start a debug session
kubectl debug <pod-name> --image=<debug-image>

# Create a copy of a pod for debugging
kubectl debug <pod-name> --copy-to=<new-pod-name>
Advanced Troubleshooting Techniques
Resource Status Checking
# Check the status of all resources
kubectl get all --all-namespaces

# Check for resources in error states
kubectl get pods --field-selector=status.phase=Failed

# Check for pods that are not ready
kubectl get pods --field-selector=status.phase!=Running

# List persistent volume claims
kubectl get pvc -o wide
Configuration Debugging
# Get the YAML configuration of a resource
kubectl get pod my-pod -o yaml

# Get the JSON configuration
kubectl get pod my-pod -o json

# Explain resource fields
kubectl explain pod.spec.containers

# Validate a YAML file without applying it
kubectl apply --dry-run=client -f my-config.yaml
Port Forwarding for Testing
# Forward a local port to a pod
kubectl port-forward pod/my-pod 8080:80

# Forward to a service
kubectl port-forward service/my-service 8080:80

# Forward to a deployment
kubectl port-forward deployment/my-app 8080:80
Common Troubleshooting Scenarios
Scenario 1: Pod Won’t Start
# Check pod status
kubectl get pods

# Get detailed information
kubectl describe pod failing-pod

# Check events
kubectl get events --field-selector involvedObject.name=failing-pod

# Check logs if container started
kubectl logs failing-pod
Scenario 2: Service Not Accessible
# Check service configuration
kubectl describe service my-service

# Check endpoints
kubectl get endpoints my-service

# Verify pods are running and ready
kubectl get pods -l app=my-app

# Test from within the cluster
kubectl run test-pod --image=busybox --rm -it -- wget -qO- my-service:80
Scenario 3: High Resource Usage
# Check resource usage
kubectl top pods

# Check resource limits
kubectl describe pod high-usage-pod

# Check for resource quotas
kubectl describe resourcequota
Scenario 4: Networking Issues
# Check DNS resolution
kubectl exec test-pod -- nslookup kubernetes.default.svc.cluster.local

# Check network policies
kubectl get networkpolicies

# Test pod-to-pod communication
kubectl exec pod1 -- ping <pod2-ip>
Troubleshooting Cheat Sheet
Quick Commands for Common Issues
# Pod status overview
kubectl get pods --all-namespaces | grep -v Running

# Recent events
kubectl get events --sort-by=.metadata.creationTimestamp --all-namespaces | tail -20

# Resource usage
kubectl top pods --all-namespaces --sort-by=memory

# Failed pods
kubectl get pods --field-selector=status.phase=Failed --all-namespaces

# Pending pods
kubectl get pods --field-selector=status.phase=Pending --all-namespaces

# Node status
kubectl get nodes -o wide

# System pods status
kubectl get pods -n kube-system
Troubleshooting Workflow
- Identify the Problem: Start with
kubectl getcommands to see the current state - Gather Information: Use
kubectl describeto get detailed information - Check Events: Look for recent events that might explain the issue
- Examine Logs: Check application and system logs for errors
- Interactive Debugging: Use
kubectl execto investigate inside containers - Test Connectivity: Use port-forwarding and exec to test network connectivity
- Monitor Resources: Check CPU, memory, and storage usage
- Validate Configuration: Ensure configurations are correct and applied
By mastering these kubectl troubleshooting tools and techniques, you’ll be well-equipped to diagnose and resolve issues in your Kubernetes environments efficiently.