Agentic Tooling: Making Agent Performance Transparent and Measurable
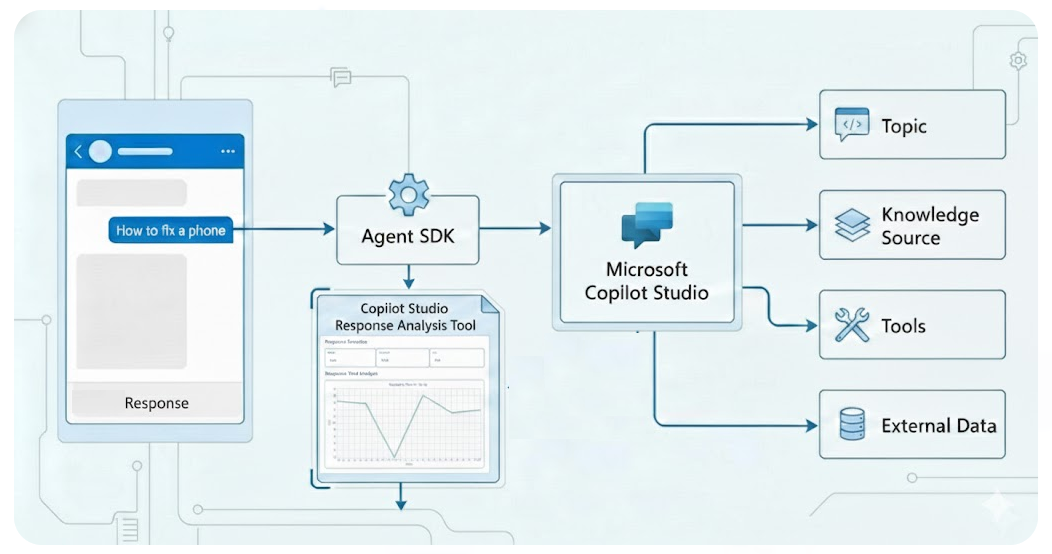
Build a tool for Copilot Studio agents that provides real-time performance metrics and agent execution insights during development using M 365 Agent SDK.
Because without agent analysis, your mission really is impossible
Architects and developers building Copilot Agents frequently encounter a “black box” problem during the development lifecycle. While verifying functional correctness, there is very limited granular visibility into response-time distributions and planner step execution.
Without such visibility, developers struggle to identify systemic inefficiencies and are unable to accomplish the following:
- Correlate response-time performance with knowledge source and output size.
- Identify variability and trends in response times across different queries.
- Trace dynamic planning logic, including tool invocations and arguments, to validate reasoning and execution paths.
- Aggregate and analyze data for continuous improvement and optimization.
Manual tracking of these metrics is time-consuming, error-prone, and lacks scalability, making it difficult to ensure consistent performance and transparency in agent behavior during development.
🧠 Inception: Diving into the Agent’s Subconscious
M365 Agents SDK paired with Python DataFrames can transform raw response times into a real-time telemetry stream that calculates incremental metrics such as Mean, Median, and Standard Deviation after every message. By aggregating these values over a full conversation, the system can derives higher-order insights.
The underlying API for the M365 Agents SDK uses the bot framework Activity protocol that emits information on how messages, events and interactions flow. By intercepting and recording Activity types (messages & events), developers can extract additional data e.g. agent’s plan, internal reasoning and tool selection. This granular data allows architects to visualize the exact sequence of agent behavior.
A Gradio UI can provide teams with a real-time graphical interface to visualize insights through interactive dashboards powered by streaming response data.
🕵️ Decoding the Tool: How to code?
- 📡 Secure Communication -
Initiate a secure session via Microsoft MSAL (Microsoft Authentication Library) to create an authenticated session.
1
2
3
4
5
6
7
8
9

# Uses MSAL to get an access token for Power Platform APIs
pca = PublicClientApplication(client_id=app_client_id, ...)

# Try to get token from cache first
response = pca.acquire_token_silent(token_request["scopes"], account=accounts[0])

# Fallback to interactive login if silent fails
if retry_interactive:
    response = pca.acquire_token_interactive(**token_request)
M365 Agents SDK Copilot Studio Client establishes a direct communication with the Copilot Studio using the session authentication token.
1
2
3
4
5
6
7

  settings = ConnectionSettings(
      environment_id=environ.get("COPILOTSTUDIOAGENT__ENVIRONMENTID"),
      agent_identifier=environ.get("COPILOTSTUDIOAGENT__SCHEMANAME"),
  )
  # Generates the client used to send/receive messages
  copilot_client = CopilotClient(settings, token)
  return copilot_client
⚙️ “The Trigger Action” -
The code uses a listener btn.click to connect the UI button to the backend logic. When user starts tests, the ask_question_file method processes the Copilot responses and pushes the results back to the various UI components (charts, numbers, and tables) simultaneously.
1
2
3
4
5

btn.click(
    fn=proc.ask_question_file, # The backend processing function
    inputs=[],
    outputs=[btn, tb, process_status, mean_output, lineplot_output, frame_output, ...]
)
🔄 - Automated Message Dispatch / Asynchronous Response Handling -
Each line in an input file input.txt is treated as a unique user utterance and the session remains active while code loops through the queries, providing a hands-free way to test the agent. M365 Agents SDK Copilot Studio Client to send them in conversation sequence to the Copilot. M365 Agents SDK Copilot Studio Client listens for incoming Activity in an asynchronous loop until response is received.
1
2
3
4
5
6
7
8
9
10
11
12
13
14
15
16
17

# Iterates through each line in the file as a new query
with open('./data/input.txt', 'r', encoding='utf-8') as file:
    for line in file:
        query = line.strip()
        # Signals the connection to start a dialogue
        replies = self.connection.ask_question(query, conversation_id)

⏱️ - ***Incremental Latency Computation*** -

Capture response timestamps for `Activity` type=message to calculate the exact duration from the moment the query is sent to the moment the final response to the utterance is received recording the latency and time related statistics.

```python
elif reply.type == ActivityTypes.message:
  start_time = time.perf_counter()
  # ... wait for agent response ...
  elapsed_time = time.perf_counter() - start_time
  resultsdf.loc[len(resultsdf)] = [querycounter, query, reply.text, elapsed_time, len(reply.text)]
Python DataFrames/Pands maintain an in-memory state of the current test run enabling the live calculation of Mean, Median, and Standard Deviation over the full conversation. Instead of post-processing, the engine performs incremental aggregation of performance metrics on every event loop.
1
2
3
4
5
6
7
8
9
10
11
12
13
14
15
16

# Real-time yield of calculated series for Gradio UI components
yield (
    # Arithmetic Mean & Median for central tendency
    resultsdf['Time'].mean().round(2),
    resultsdf['Time'].median().round(2),

    # Dispersion Metrics: Standard Deviation (Sigma) indicates system jitter
    resultsdf['Time'].std().round(2),
    resultsdf['Time'].max().round(2),

    # Statistical Correlation: Pearson coefficient between character length and latency
    resultsdf['Char-Len'].corr(resultsdf['Time']) if len(resultsdf) > 1 else 0,

    # Dynamic Box-and-Whisker Plot for outlier visualization
    self.generate_boxplot(resultsdf['Time'])
)
graph TD
    %% Use linear paths to encourage straighter lines

    subgraph Auth [Authentication & Security]
        A([🚀 Start Tool]) --> B[🎫 Access Token]
    end

    subgraph Init [Connection Setup]
        B --> C[🔌 Initialize Session]
    end

    subgraph User [Mission Control]
        C --> E[▶️ Start Test Run]
    end

    subgraph Engine [Processing Engine]
        E --> F[📂 Open input.txt]
        F --> G[🔄 Loop: Utterance]

        subgraph Analysis [Activity Analysis]
            G --> H{Activity Type?}
            H -- "Event" --> I[🧠 Extract Planner Steps]
            H -- "Message" --> J[💬 Capture Final Text]
        end

        I --> K[📥 Update Results DF]
        J --> K
    end

    subgraph Visualization [Streaming Dashboard]
        K --> L[📡 Stream Data to UI]

        L --> M[📊 Update Stats]
        L --> O[📋 Chain of Thought]

        M -- "Set Complete" --> Q([💾 Final Export: Save CSV])
        O -- "Set Complete" --> Q([💾 Final Export: Save CSV])
    end

    %% Unified Blue Palette Styling
    style Auth fill:#E3F2FD,stroke:#2196F3,stroke-width:1px
    style Init fill:#BBDEFB,stroke:#1E88E5,stroke-width:1px
    style User fill:#90CAF9,stroke:#1976D2,stroke-width:1px
    style Engine fill:#E1F5FE,stroke:#03A9F4,stroke-width:1px
    style Visualization fill:#B3E5FC,stroke:#0288D1,stroke-width:1px

    %% Node Specifics
    style A fill:#0D47A1,color:#fff
    style E fill:#1565C0,color:#fff
    style Q fill:#01579B,color:#fff
    style H fill:#E1F5FE,stroke:#01579B
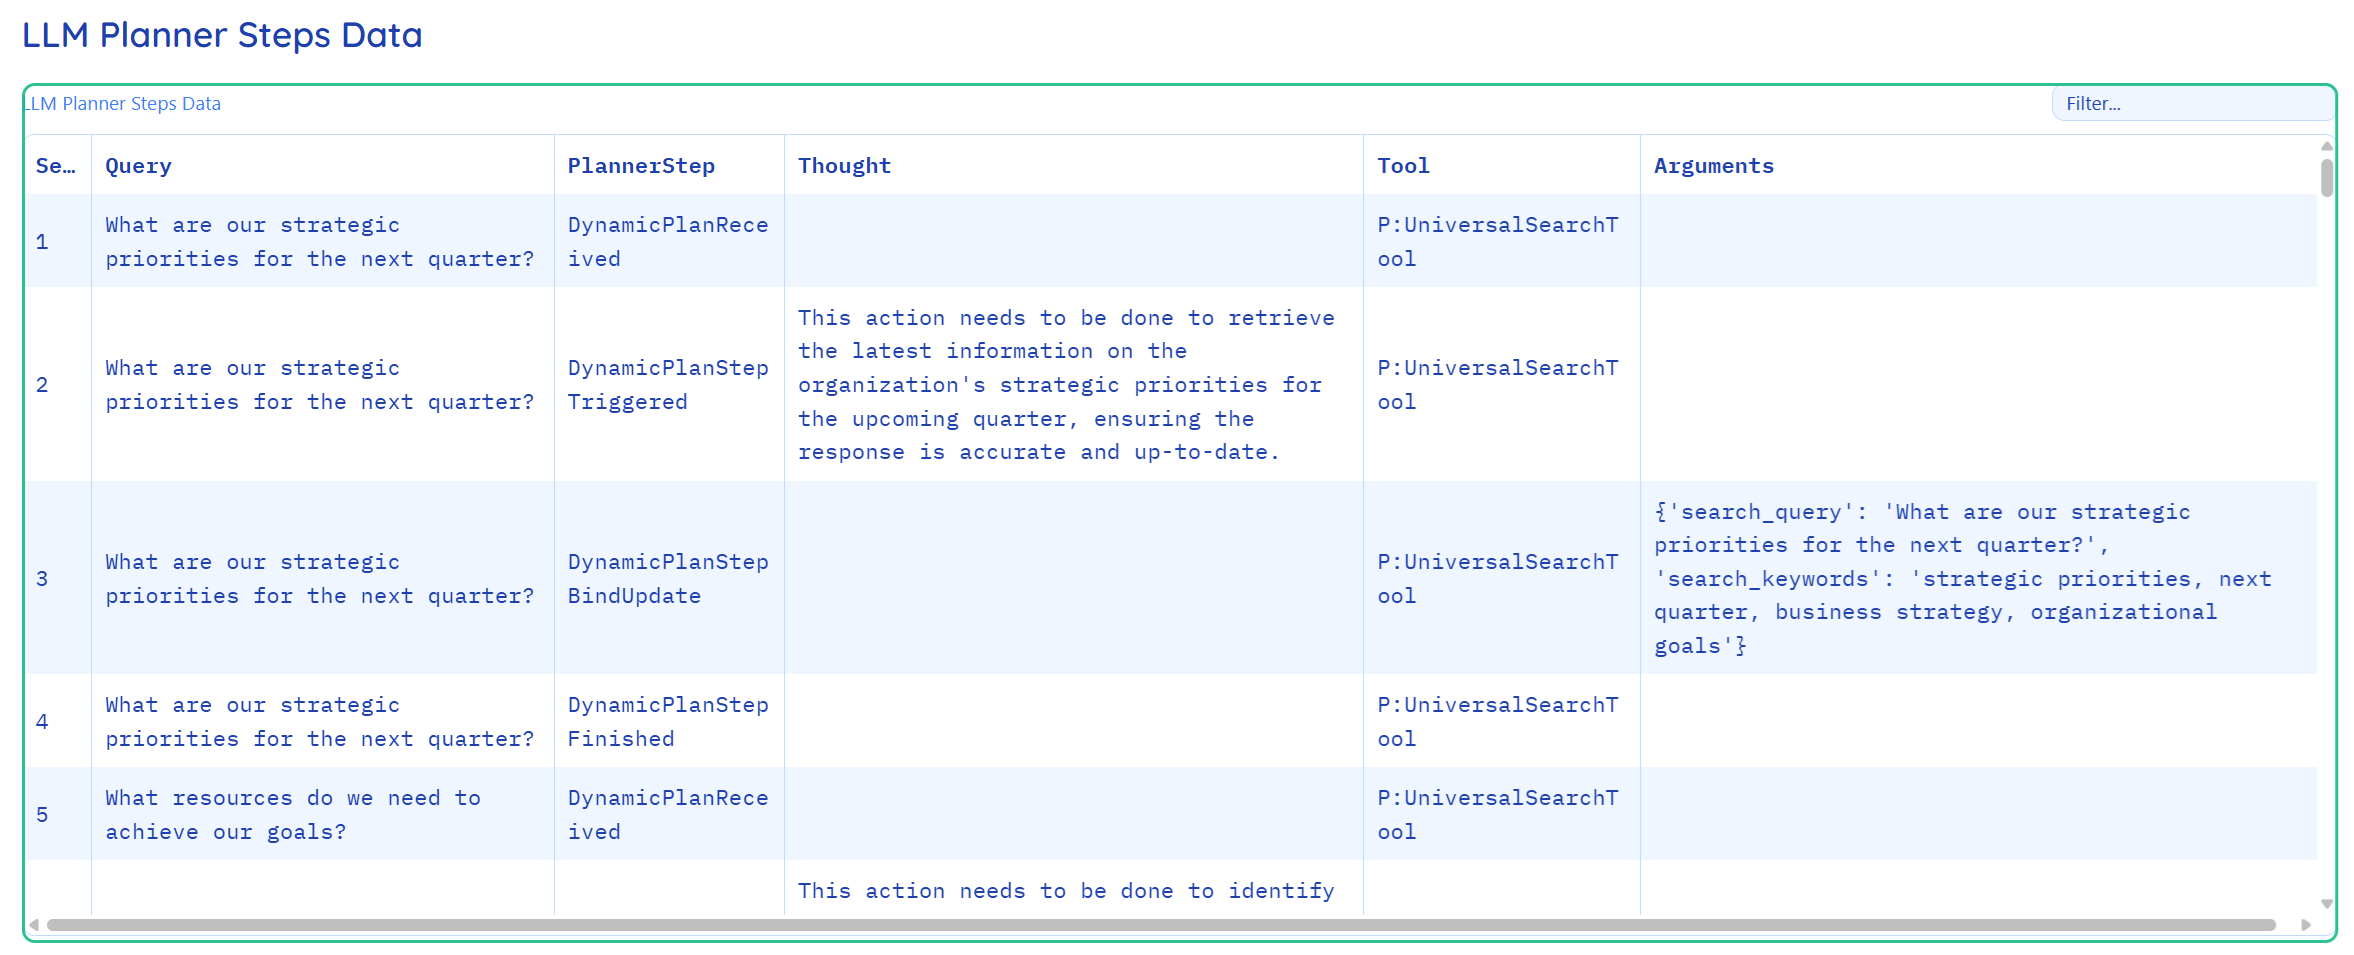
🕵️ - Agent Plan Extraction -
Parse the information within Activity type=event to record the agent’s reasoning, tool-calls, and plan execution.The M365 Agent SDK listens for specific events and captures the agent “Chain Of Thoughts” (reasoning, tool-calls, and plan execution etc.) that explains why the agent chose a specific path.
1
2
3
4
5
6

async for reply in replies:
    if reply.type == ActivityTypes.event:
        # Records the hidden "thoughts" of the LLM planner
        resultsaidf.loc[len(resultsaidf)] = [
            querycounter, query, reply.value_type, reply.value['thought'], ...
        ]
📊 - Real-Time Visualization -
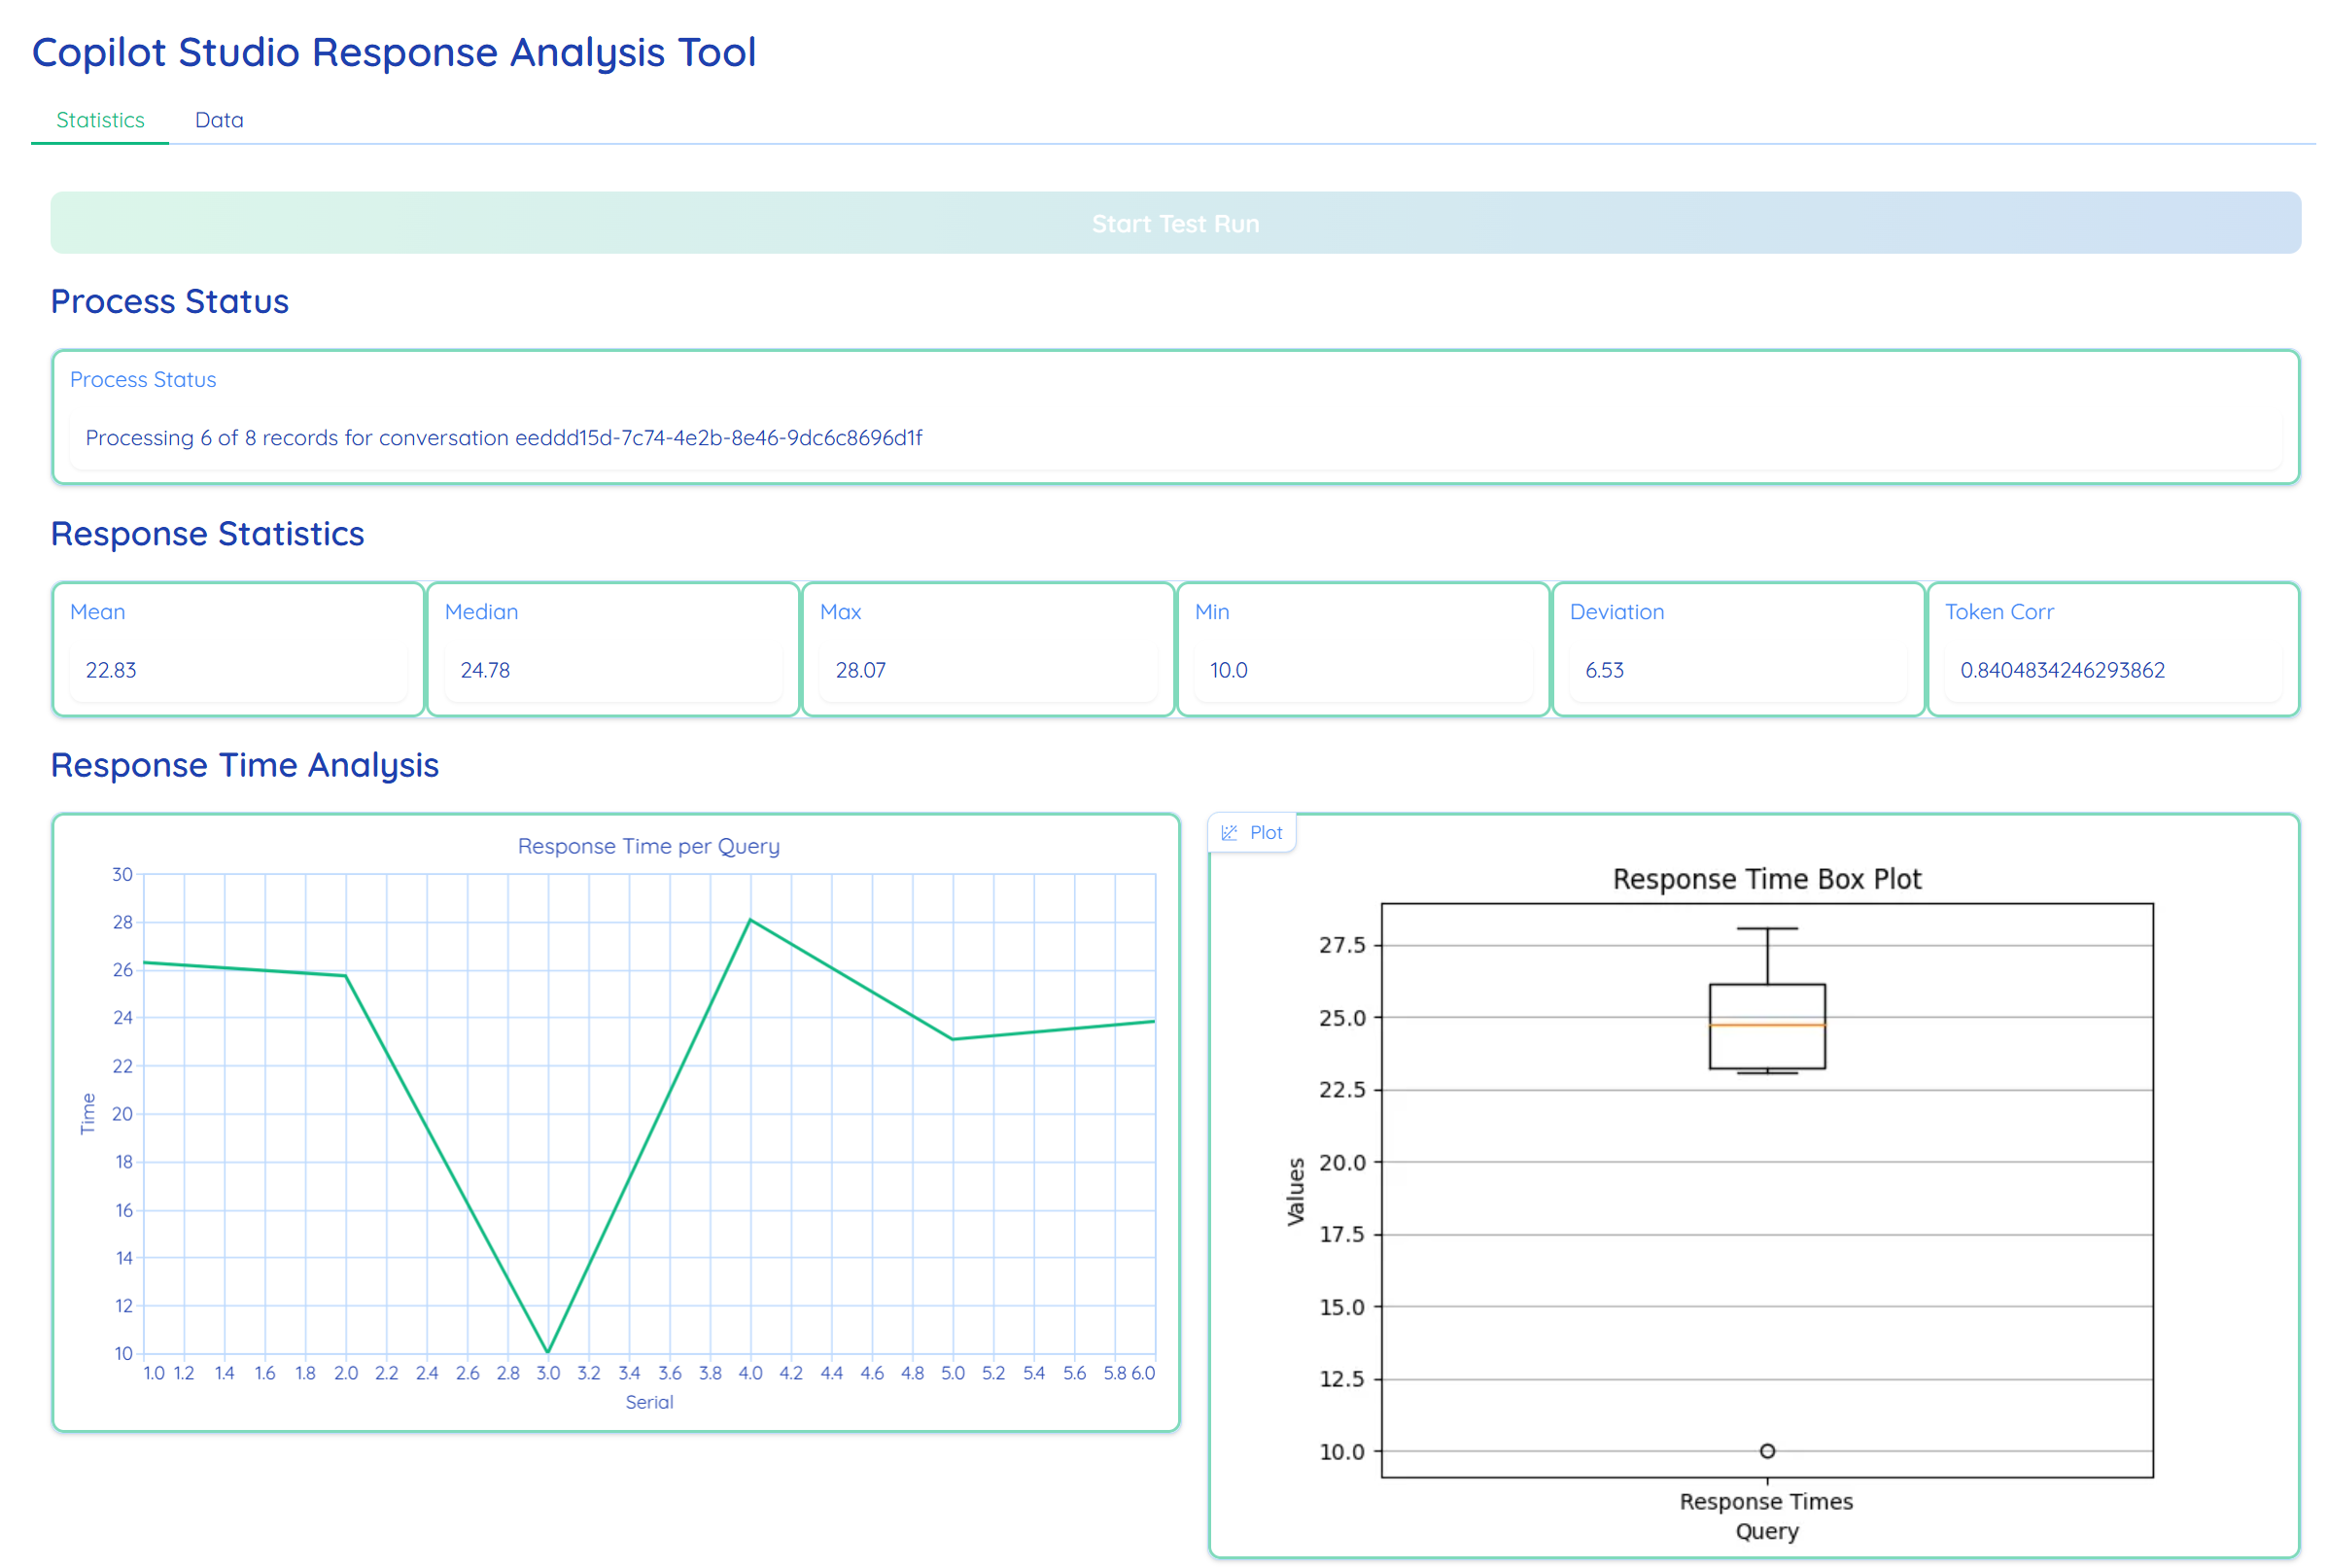
Stream real-time performance metrics and plan data to a multi-tabbed dashboard interface. UX frameworks like Gradio can use custom themes and organizes the dashboard into two functional views:
- Statistics: Tab: Contains numerical summaries (Mean, Median, Standard Deviation) and visual plots.
- Data Tab: Features advanced search-enabled DataFrames to inspect the raw “Planner” logic and response strings.
1
2
3
4
5
6
7
8
9
10

with gr.Blocks(theme='shivi/calm_seafoam') as demo:
    with gr.Tab("Statistics"):
        # Metrics and Charts
        mean_output = gr.Number(label="Mean")
        lineplot_output = gr.LinePlot(...)

    with gr.Tab("Data"):
        # Granular logs for debugging
        frame_output = gr.DataFrame(label="Query Response / Time Data")
        frameai_output = gr.DataFrame(label="LLM Planner Steps Data")
Using yield keyword, code streams data back to the Gradio UI in real-time. This allows the “Statistics” and “Data” tabs to update dynamically after every single query, providing immediate feedback without waiting for the entire batch to finish.
1
2
3
4
5
6
7
8

# Updates the UI components (Mean, Median, Charts) after each response
yield (
    f"Processing {querycounter} of {linecount}",
    resultsdf['Time'].mean().round(2),
    resultsdf['Time'].std().round(2),
    self.generate_boxplot(resultsdf['Time']),
    resultsdf.sort_index()
)
🎬 The Feature Presentation: Complete Working Tool
A fully functional version of this tool is available in the publicly available ResponseAnalysisAgentsSDK repository. The codebase is ready for use and includes comprehensive instructions on initial environment setup, execution of tests, and the technical interpretation of the results.
⚠️ The Cautionary Tale: Important Considerations
Before you rush off to try and implement this, let’s be honest about a few things:
The current implementation is designed exclusively for single-session analysis.
Before deploying the tool, review the requirements to ensure your environment is compatible, then execute the setup steps to configure the tool.
Never commit access tokens or credentials to source control. Always use environment variables or secure credential stores, and implement proper token refresh logic.
💡 The Director’s Cut: Key Takeaways
Custom Tooling via M365 Agent SDK: Use the M365 Agent SDK as a foundational interface to develop bespoke engineering tools and diagnostic utilities tailored to your specific Copilot Studio environment.
Glass-Box Observability: Intercept agent
Activityto expose agent planner Metadata, allowing audit of specific tool-calls and internal processing logic behind every agent response.Data-Driven Validation: Leverage Python data libraries to transition from anecdotal testing to formal validation. By automating batch runs, you can calculate rigorous statistical measures such as Mean, Variance, and Correlation metrics.
Logic Isolation: Maintain a single-conversation focus to eliminate concurrency noise. This isolation ensures the telemetry you collect is “clean,” allowing for the precise refinement of system instructions and agent state-machine transitions.
Have you tried this approach on your agents? Or maybe you’ve found a more elegant solution? Drop a comment below.