G3000 Electronic Charts
Introduction
The G3000 electronic charts feature allows the user to view terminal procedure charts directly within the avionics. The user may select and view charts (provided they are available) for any airport and associated instrument procedure.
By default, the electronic charts feature supports charts from the sim's built-in LIDO and FAA charts sources. Plugins can add additional sources or override the built-in sources with custom behavior. The following sections will describe how to use a plugin to define and add a custom charts source.
Defining a Charts Source
Charts sources for the G3000 are defined using the G3000ChartsSource interface. This interface represents an adapter layer between the SDK Charts API and the G3000 avionics. In other words, each charts source is responsible for interpreting its own charts data and presenting the results to the G3000 in a standardized manner.
Basic Setup
The first thing to do when creating a custom charts source is to give it a unique ID and name.
The source's unique ID is a string that uniquely identifies the source. It cannot be the empty string, but other than that it can be anything you wish as long as it does not conflict with the ID of another charts source. The ID is only used internally and is never displayed to the user.
In order to override and replace of the built-in charts sources with your own custom source, use the ID of the built-in source for your own source. These built-in IDs can be accessed from the G3000BuiltInChartsSourceIds enum.
The source's name will be displayed to the user. Unlike the ID, the name does not have to be unique (but we recommend choosing a unique name for obvious reasons).
For best results, source names should be limited to approximately 10 characters or fewer. Longer names may lead to text overflow issues in certain parts of the G3000 UI.
After you have chosen a suitable ID and name, you should have your charts source provide these via its uid and name properties, respectively.
import { G3000ChartsSource } from '@microsoft/msfs-wtg3000-common';

export class MyChartsSource implements G3000ChartsSource {
  public readonly uid = 'my-charts-id';

  public readonly name = 'MyCharts';

  // ...
}
Chart Provider
All charts sources must be associated with a specific Charts API chart provider. When a charts source is used, the G3000 will request chart data using the source's associated provider. Any chart provider can be used. You can choose to use one of the sim's built-in chart providers or a custom chart provider. For more information on how to create a custom chart provider, please refer to this page.
Charts sources do not have to choose unique chart providers. Multiple sources are allowed to use the same provider.
Each charts source should provide the string ID of its associated chart provider via its provider property.
import { G3000ChartsSource } from '@microsoft/msfs-wtg3000-common';

class MyChartsSource implements G3000ChartsSource {
  public readonly provider = 'MyChartProvider';

  // ...
}
In addition to specifying the provider, each charts source must also define how to retrieve chart data from the provider. The source does this using its getChartService() and createChartImageSupplier() methods.
The getChartService() method returns an instance of ChartService which retrieves chart index and chart page data. You may choose to have the method return a new instance of ChartService every time it is called or return a single cached instance.
The createChartImageSupplier() method creates and returns an instance of ChartImageSupplier which supplies image URLs for loading and displaying chart images. This method must return a new instance of ChartImageSupplier each time it is called.
import { ChartImageSupplier, ChartService } from '@microsoft/msfs-sdk';
import { G3000ChartsSource } from '@microsoft/msfs-wtg3000-common';

class MyChartsSource implements G3000ChartsSource {
  public readonly provider = 'MyChartProvider';

  public getChartService(): ChartService {
    return new MyChartService();
  }

  public createChartImageSupplier(): ChartImageSupplier {
    return new MyChartImageSupplier();
  }

  // ...
}
When using one of the sim's built-in providers, you can use the SimChartService class as the source's chart service and the ChartView class as the source's chart image supplier.
import {
  ChartImageSupplier, ChartsClient, ChartService, ChartView, SimChartService
} from '@microsoft/msfs-sdk';
import { G3000ChartsSource } from '@microsoft/msfs-wtg3000-common';

class MyChartsSource implements G3000ChartsSource {
  public getChartService(): ChartService {
    return new SimChartService();
  }

  public createChartImageSupplier(): ChartImageSupplier {
    const view = new ChartView();
    ChartsClient.initializeChartView(view);
    return view;
  }

  // ...
}
Selecting Charts
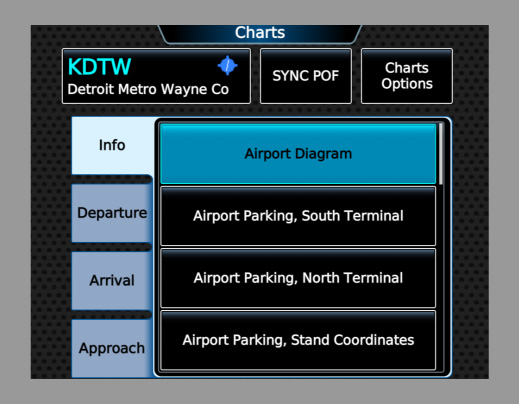
The most important thing that a charts source does is to analyze the charts that are made available from its provider and select those that are suitable for use by the G3000. The G3000 supports displaying four types of charts:
- Info: airport diagram and other charts related to airport operations.
- Departure: charts depicting departure procedures.
- Arrival: charts depicting arrival procedures.
- Approach: charts depicting approach procedures.
Charts are divided into different lists by type when they are presented in the GTC Charts page.
Charts sources select the charts that belong to each type via the getInfoCharts(), getDepartureCharts(), getArrivalCharts(), and getApproachCharts() methods. Each of these methods takes a ChartIndex for a particular airport and returns an array of ChartMetadata, where each ChartMetadata object in the array represents a chart of the appropriate type that can be displayed. The order of the charts in the array determines the order in which the charts are presented in the GTC Charts page. If a chart has multiple pages, then each page of the chart will be presented as a separate item.
Charts sources may use any arbitrary logic for assigning charts to each type. The specific details will depend on how the charts data from the source's provider is organized.
The following example code shows how a custom charts source may select Departure charts from a hypothetical custom provider by including all charts organized in the Departures category.
import { ArrayUtils, ChartIndex, ChartMetadata } from '@microsoft/msfs-sdk';
import { G3000ChartsSource } from '@microsoft/msfs-wtg3000-common';

class MyChartsSource implements G3000ChartsSource {
  public getDepartureCharts(chartIndex: ChartIndex<string>): ChartMetadata[] {
    return ArrayUtils.flatMap(
      chartIndex.charts.filter(category => {
        return category.name === 'Departures'
      }),
      category => category.charts
    );
  }

  // ...
}
In addition to selecting charts of the four major types, charts sources must also be able to select a chart page that depicts an airport diagram (otherwise known as a ground or taxi diagram) for each airport as well as chart pages that depict individual instrument procedures.
The getAirportDiagramPage() method takes an array of G3000ChartsPageData objects - each one representing a single chart page - and returns the single G3000ChartsPageData from the array that represents the airport diagram, if such a page exists. The array passed to getAirportDiagramPage() is guaranteed to contain all of the page data for the charts selected by getInfoCharts() for a given airport and only those page data.
The getDeparturePage(), getArrivalPage(), and getApproachPage() methods likewise take an array of G3000ChartsPageData and returns the page data from the array that represents a particular instrument approach procedure described by the other arguments passed to the methods. The array passed to getDeparturePage(), getArrivalPage(), and getApproachPage() is guaranteed to contain all of the page data for the charts selected by getDepartureCharts(), getArrivalCharts(), and getApproachCharts(), respectively, for a given airport and only those page data. It is perfectly acceptable for one of these methods to return the same page data for multiple different procedures if a single page depicts multiple procedures.
The following example code shows how a custom charts source may select a Departure chart page for a given departure procedure from a hypothetical custom provider by using the associated procedures data found in the chart metadata.
import { ArrayUtils, ChartIndex, ChartMetadata, ChartProcedureType, RunwayIdentifier } from '@microsoft/msfs-sdk';
import { G3000ChartsPageData, G3000ChartsSource } from '@microsoft/msfs-wtg3000-common';

class MyChartsSource implements G3000ChartsSource {
  public getDeparturePage(
    pages: readonly G3000ChartsPageData[],
    departureName: string,
    enrouteTransitionName: string,
    runway: Readonly<RunwayIdentifier>
  ): G3000ChartsPageData | undefined {
    // Iterate through the candidate pages and return the first match.
    for (const page of pages) {
      // Search the page's associated procedures for a match to the requested procedure.
      for (const procedure of page.metadata.procedures) {
        if (
          procedure.type === ChartProcedureType.Sid
          && procedure.ident === departureName
          && (
            // If enrouteTransitionName is the empty string, then we will not filter for enroute transitions.
            enrouteTransitionName === ''
            // If the associated procedure's enrouteTransition prop is null, then it includes all enroute transitions.
            || procedure.enrouteTransition === null
            // Otherwise match the enroute transition.
            || procedure.enrouteTransition === enrouteTransitionName
          )
          && (
            // If runway is the empty identifier, then we will not filter for runways.
            runway.number === ''
            // Otherwise match the runway.
            || procedure.runways.some(query => query.number === runway.number && query.designator === runway.designator)
          )
        ) {
          return page;
        }
      }
    }

    return undefined;
  }

  // ...
}
Chart Naming
Charts sources must provide a name for each chart page that can be displayed using the getChartName() method. These names are displayed to the user and are the primary means by which the user will identify pages and distinguish between different pages. As such, it is recommended to choose descriptive, user-friendly names.
The following example shows how to choose page names based on the name assigned to each chart by the chart provider, with optional page numbering for multi-page charts.
import { G3000ChartsPageData, G3000ChartsSource } from '@microsoft/msfs-wtg3000-common';

class MyChartsSource implements G3000ChartsSource {
  public getChartName(pageData: G3000ChartsPageData): string {
    if (pageData.pageCount <= 1) {
      return pageData.metadata.name;
    } else {
      return `${pageData.metadata.name} (pg ${pageData.pageIndex + 1}/${pageData.pageCount})`;
    }
  }

  // ...
}
Chart URL Selection
Each ChartPage sourced from a chart provider potentially has multiple associated URLs. Each URL is used to fetch a particular version or format of that page. Charts sources are responsible for selecting the appropriate URLs to display each chart page.
The G3000 supports displaying charts in either Day mode or Night mode. Day mode charts should have a light color scheme and Night mode charts should have a dark color scheme. Each charts source must support Day mode and can optionally support Night mode. If a charts source supports Night mode, then it should set its supportsNightMode property to true.
The getDayModeUrl() and getNightModeUrl() methods are used to select the appropriate URL to use for Day and Night modes, respectively. If a charts source does not support night mode, then getNightModeUrl() can return undefined for every page.
In the following example, Day and Night mode URLs are chosen by searching for URLs with specific names used by a hypothetical custom chart provider.
import { ChartUrl } from '@microsoft/msfs-sdk';
import { G3000ChartsPageData, G3000ChartsSource } from '@microsoft/msfs-wtg3000-common';

class MyChartsSource implements G3000ChartsSource {
  public getDayModeUrl(pageData: G3000ChartsPageData): ChartUrl | undefined {
    return pageData.page.urls.find(url => url.name === 'light_png');
  }

  public getNightModeUrl(pageData: G3000ChartsPageData): ChartUrl | undefined {
    return pageData.page.urls.find(url => url.name === 'dark_png');
  }

  // ...
}
Chart Page Sections
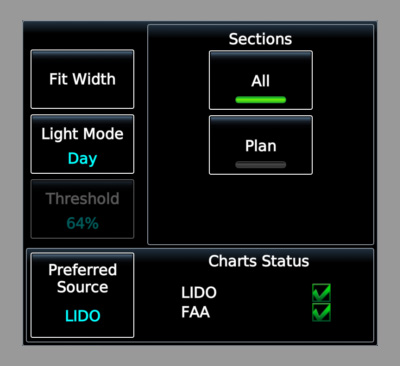
The G3000 supports displaying individual sub-sections of chart pages. When a section is selected by the user, only the area of the chart contained within the section is displayed, and the rest of the chart is hidden.
Each charts source can define up to four different sections that can be selected. Not all sections have to be supported by every chart. Any individual chart can support zero, one, or more sections. If a chart does not support a section, then the user will not be allowed to select that section when the chart is displayed.
Sections are defined using the G3000ChartsSourcePageSectionDefinition interface. One instance should be created for each section and placed in the source's pageSectionDefinitions array.
The G3000 supports a maximum of four sections per charts source. Any additional sections defined past the fourth will be ignored.
Each section must be assigned a unique ID (never displayed to the user) and a name (displayed to the user in the GTC Charts Options popup). Finally, the section's getArea() method should return the ChartArea of a page that corresponds to the section. If the section is not supported by a page, then getArea() should return undefined.
For best results, section names should be limited to approximately 10 characters or fewer. Longer names may lead to text overflow issues in certain parts of the G3000 UI.
The image below shows an example of how different page sections are presented to the user for selection on the GTC Charts Options popup (in the area labeled "Sections"). In this case there is one defined section named "Plan". (The "All" selection displays the entire page.)
The following example defines a single page section named "Plan" that displays the chart area with the layer name Plan for a hypothetical custom chart provider.
import { ChartArea } from '@microsoft/msfs-sdk';
import {
  G3000ChartsPageData, G3000ChartsSource, G3000ChartsSourcePageSectionDefinition
} from '@microsoft/msfs-wtg3000-common';

class MyChartsSource implements G3000ChartsSource {
  public readonly pageSectionDefinitions: readonly G3000ChartsSourcePageSectionDefinition[] = [
    {
      uid: 'Plan',
      name: 'Plan',

      getArea(pageData: G3000ChartsPageData): ChartArea {
        return pageData.page.areas.find(area => area.layer === 'Plan');
      },
    },
  ];

  // ...
}
Geo-Referenced Charts
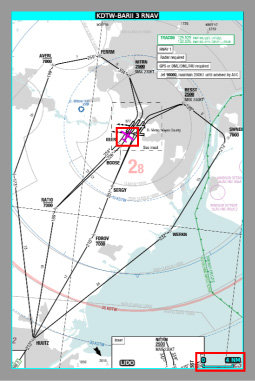
Charts sources use the getGeoReferencedArea() method to return an appropriate GeoReferencedChartArea for each chart page that is geo-referenced. getGeoReferencedArea() takes both a chart page and chart area as arguments. The chart area argument is null for pages that are displayed without a selected section. Otherwise, the chart area argument is the area that is displayed for the selected section. If a page is not geo-referenced, then getGeoReferencedArea() should return undefined.
Pages with a valid geo-referenced area are displayed with a scale bar. Moreover, a moving airplane icon will be overlaid on the chart within the geo-referenced area at the airplane's current location.
You can customize the airplane icon that is displayed on geo-referenced charts by using the airplane-icon-src attribute on the <Charts> panel.xml tag. If a custom airplane icon is not specified, then a generic icon will be used instead.
Charts Source Status
Finally, each charts source must provide an indication of its own status via the status property. The status of the chart is displayed in the GTC Charts Options popup.
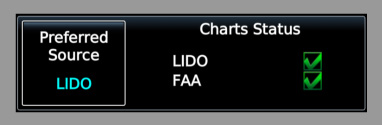
Most of the time, using the G3000ChartsSourceStatus.Ready status is sufficient. However, you can choose to provide different statuses if you wish to simulate additional systems depth.
Adding a Custom Charts Source to the G3000
To add a custom charts source, a plugin that returns a factory for the custom charts source from its getChartsSources() method must be added to every G3000 instrument (PFD, MFD, and GTC).
The following set of examples shows a single custom charts source being defined and added to the G3000 via three different plugins (for PFD, MFD, and GTC).
import { G3000ChartsSource, G3000ChartsSourceFactory } from '@microsoft/msfs-wtg3000-common';

class MyChartsSource implements G3000ChartsSource {
  public readonly uid = 'my-charts-id';

  // ...
}

export class MyChartsSourceFactory implements G3000ChartsSourceFactory {
  public readonly uid = 'my-charts-id';

  public createSource(): G3000ChartsSource {
    return new MyChartsSource();
  }
}
import { registerPlugin } from '@microsoft/msfs-sdk';
import { G3000ChartsSourceFactory } from '@microsoft/msfs-wtg3000-common';
import { AbstractG3000PfdPlugin } from '@microsoft/msfs-wtg3000-pfd';
import { MyChartsSourceFactory } from './MyChartsSource';

class MyPfdPlugin extends AbstractG3000PfdPlugin {
  public getChartsSources(): Iterable<G3000ChartsSourceFactory> | undefined {
    return [new MyChartsSourceFactory()];
  }

  // ...
}

registerPlugin(MyPfdPlugin);
import { registerPlugin } from '@microsoft/msfs-sdk';
import { G3000ChartsSourceFactory } from '@microsoft/msfs-wtg3000-common';
import { AbstractG3000MfdPlugin } from '@microsoft/msfs-wtg3000-mfd';
import { MyChartsSourceFactory } from './MyChartsSource';

class MyMfdPlugin extends AbstractG3000MfdPlugin {
  public getChartsSources(): Iterable<G3000ChartsSourceFactory> | undefined {
    return [new MyChartsSourceFactory()];
  }

  // ...
}

registerPlugin(MyMfdPlugin);
import { registerPlugin } from '@microsoft/msfs-sdk';
import { G3000ChartsSourceFactory } from '@microsoft/msfs-wtg3000-common';
import { AbstractG3000GtcPlugin } from '@microsoft/msfs-wtg3000-gtc';
import { MyChartsSourceFactory } from './MyChartsSource';

class MyGtcPlugin extends AbstractG3000GtcPlugin {
  public getChartsSources(): Iterable<G3000ChartsSourceFactory> | undefined {
    return [new MyChartsSourceFactory()];
  }

  // ...
}

registerPlugin(MyGtcPlugin);
Each source factory must declare the correct unique ID of the source that it creates. If the unique ID of the source created by a factory is found to be different from the one declared by the factory, then a runtime error will be thrown during instrument initialization.
Charts sources from factories returned by all plugins are added to the G3000. If plugins return two or more factories with the same declared unique ID, then the factory that is returned last (ordered first by plugin load order, then by order in each plugin's returned factory iterable) will be used and the others will be discarded. Factories returned from plugins with the same ID as one of the built-in sources will always override and replace the built-in source.