Overview
Nanotune was implemented as part of a PhD project with the goal to initialize gate-defined quantum dots without human interaction and no pre-measured input. It automates typical manual measurements and replaces the experimenter’s quality and charge state assessment by supervised machine learning. In a very simplified way, the implemented dot-tuning sequence can be thought of as a for-loop with a couple of if-statements which hard code the tuning logic. Being based on QCoDeS, nanotune extends the data acquisition software by adding automated tuning procedures which use machine learning models implemented in scikit-learn. For successful autonomous tuning, only the following, minimal input is required:
bonding scheme/routing, i.e. which DAC channel corresponds to which gate,
device layout, i.e. number and arrangement of gates,
safety voltage ranges, i.e. which voltages can be applied without damaging the device,
setup specific noise floor - to ensure noise is not mistaken for an open regime in pre-calibration steps.
The dot-tuning sequence was demonstrated on double quantum dots formed in a GaAs two-dimensional electron gas, however no assumptions about the material were made. The gate layout of the devices used consist of six gates: four so-called barriers and two plungers, shown in figure Fig. 1.
Fig. 1 Gate layout of the device used to demonstrate autonomous tuning. A and B represent dots.
Barrier gates typically create potential wells between them, defining tunnel resistances between dots and reservoirs. Plungers are used to adjust the electrochemical potential of a dot, changing the number of electrons if desired. Except for the top barrier, the tuning is identical to the tuning of quantum dots formed in 1D systems such as nanowires. All measurements were taken in DC transport, i.e. measuring current through the device. This readout method can be replaced by sensing technique easily.
Tuning workflow
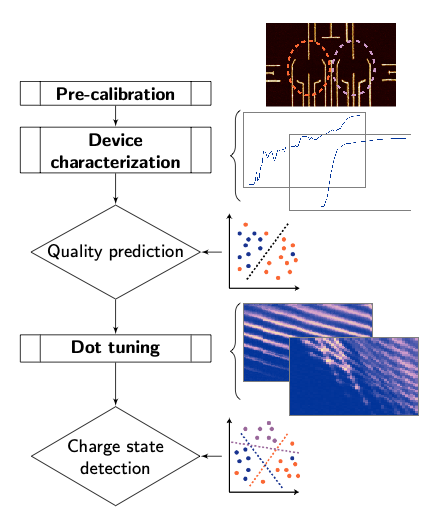
The dot-initialization workflow consists of two pre-calibration, one characterization and one tuning step, as outlined in the flowchart pictured in Fig. 2.

Fig. 2 Device tuning workflow.
A gate leakage test and initial quality assessment ensure that devices are ‘alive’, meaning that voltages can be set and the current through the device is above the specified noise floor. The characterization step identifies devices that are fully functional, which is defined as all gates being able to deplete the electron gas nearby, also referred to as pinching off. Similar to a manual approach, each gate is characterized individually by stepping over its safety range while measuring the current through the device. The desired feature, a sharp current dip reaching zero, is confirmed by a binary classifier trained with experimental data. Only if traces of all gates show a good pinchoff, a device is tuned.
The subsequent dot-tuning sequence is able to tune into either the single and double dot regime, with the main difference being the voltage value set to the central barrier. To form a double dot, a more negative value (when tuning in depletion mode) is required than for the single dot regime. Specifically, the dot-tuning process consists of a sequence of one- and two-dimensional measurements, referred to as gate characterizations and charge diagrams. Each measurement is assessed by a binary classifier to determine quality and, in the case of a charge diagram, the charge state (i.e. single vs double dot). Gate characterizations are used to determine each gate’s ‘active’ voltage range. An active voltage range, also called current_valid_range, is the range within which we expect the desired charge state to occur. A sequence of faster, one-dimensional measurements is an efficient way to narrow down the large parameter space before proceeding with more time consuming two-dimensional measurements. Due to capacitive coupling, active ranges need to be updated each time the voltage of a nearby gate is changed. Once all gates are characterized and barriers set to a value within their active range, the plungers are swept to measure a charge diagram. Note that the top barrier is set first and that the remaining tuning sequence is the same as for 1D systems. Depending on the classification outcome of the charge diagram as well as additional checks assessing whether the device is in an open, closed or intermediate transport regime, gate voltages are adjusted. The precise sequence of measurements is discussed in Tuning.
Implementation
The main modules implementing the dot-tuning are the Device, Tuner, TuningStage, DataFit and Classifier classes. These classes work together as follows: A subclass of TuningStage, currently either GateCharacterization1D or ChargeDiagram, is responsible for taking data and verifying whether the result is satisfying. To do the latter, a fit is performed via one of the DataFit subclasses and either the extracted feature vector or the entire measurement is classified. GateCharacterization1D uses PinchoffFit, while ChargeDiagram relies on DotFit for fitting. The Tuner classes implement the tuning sequence itself by combining instances of TuningStages with a hard-coded decision logic forming either one or two dots. There are two Tuner subclasses, a Characterizer performing the a device characterization and a DotTuner. A Tuner class acts on an instance of a Device class, which represents the physical device including a list of gates, ohmics, gate layout and readout methods.
Acknowledgments
A special thanks goes to Matthias Troyer, Maja Cassidy, David Reilly and Charles Marcus for initiating, supervising and pushing over the finish line the PhD project, which resulted in the original version of nanotune. Chris Granade, Nathan Wiebe, John Hornibrook - your inputs were invaluable in implementing several modules. Alice Mahoney, Sebastian Pauka, Rachpon Kalra - thank you for setting up fridges and prepping devices, making it possible for automated tuning to be developed, tested and demonstrated. William H.P. Nielsen and Jens Nielsen - both your patience and help with qcodes was essential.