powerbi-visuals-sankey
Sankey visual documentation
Data fields
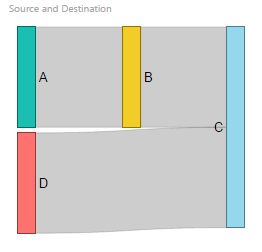
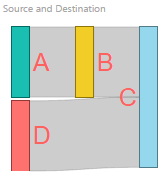
The Sankey has several buckets. There are Source, Destination, Source labels, Destination labels, Weight. Source and Destination buckets are required to display the diagram.
In this case the custom visual displays links between source and destination with same links weights.
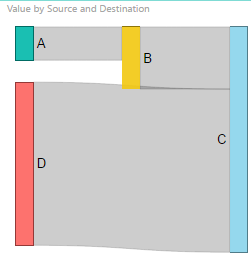
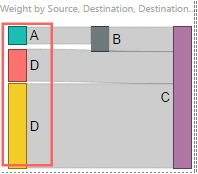
Weight data bucket allows setting weights for each link.
If Weight data field is filled, the custom visual draws the links with different sizes. And size of link depends on value of data
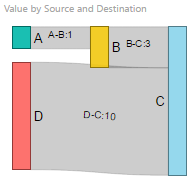
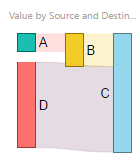
If Source and Destination fields are filled, you can construct the Sankey with duplicated nodes. To do so you just need to give different names for nodes but with the same labels.
In this sample, D node is rendered twice.
Sankey format panel
Data labels properties provide settings to configure node labels
Color - defines text color of label
Text size - defines text size of label
Data link labels properties provide settings for configuring link labels.
Color - defines text color of label
Text size - defines text size of label
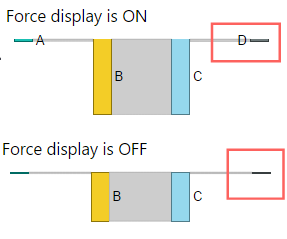
Force display properties - changes the behavior of labels in the intersection. Labels will be hidden if there’s no room to fit them. If Force display option is enabled, the custom visual displays the label in any way
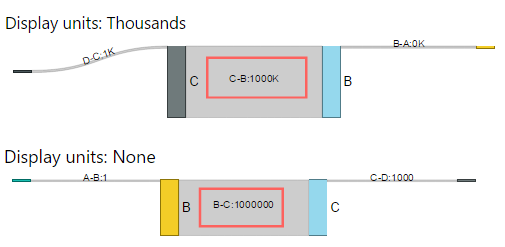
Display units properties - changes display units in link labels and tooltips
Links properties define color for each link
Scale settings
Scale settings allow configuring the scale properties of the chart.
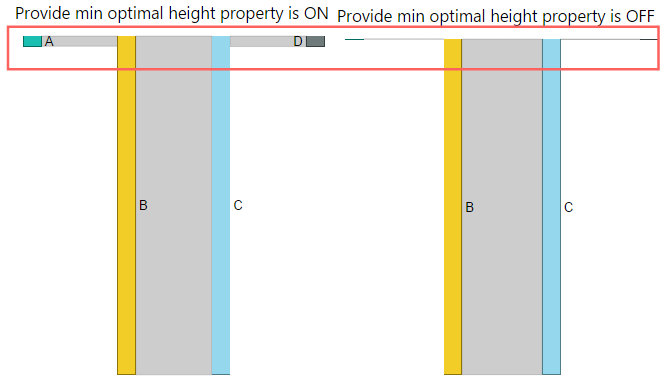
Provide min optimal height property - the chart draws all nodes with minimal height to supply convenient size. It can be useful if a distribution of weight values very hight. For example, the minimal value in a data set is 1 and maximum value in a dataset is 1 million.
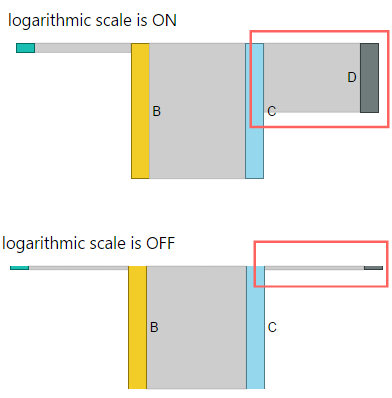
Enable logarithmic scale - this option switches linear scaling to logarithmic. With this options, the chart smooths values distribution in a dataset.
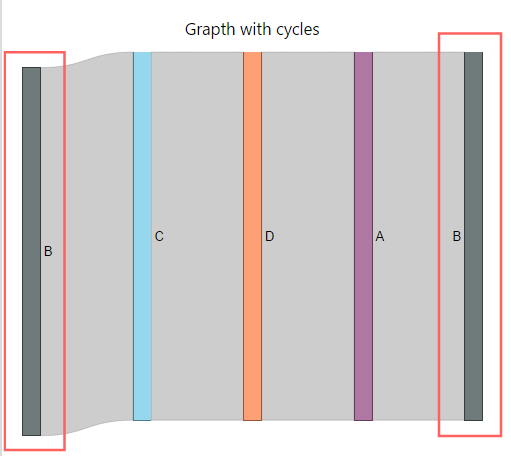
Cycles
If a dataset contains the nodes with a link to itself or graphs with cycles, the visual duplicates one of the node to “break” cycle and draws the same node twice.
In the chart, you can see that node B was drawn twice.
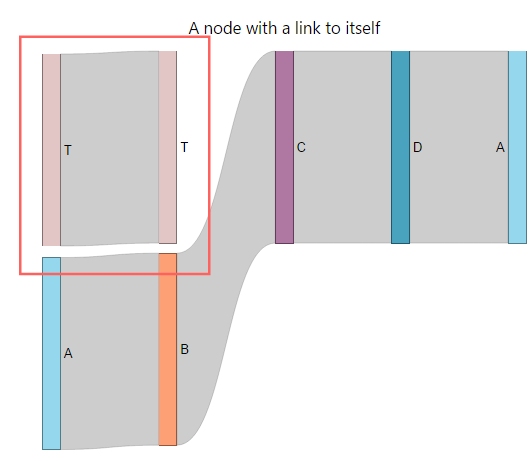
In this chart, the node T has self-link and was drawn twice too.
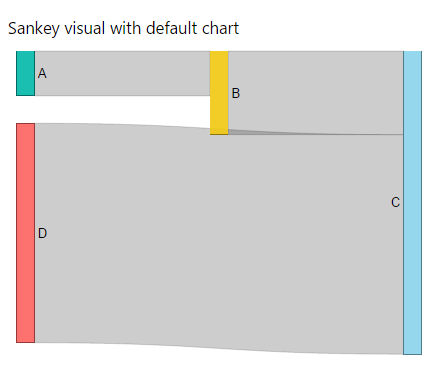
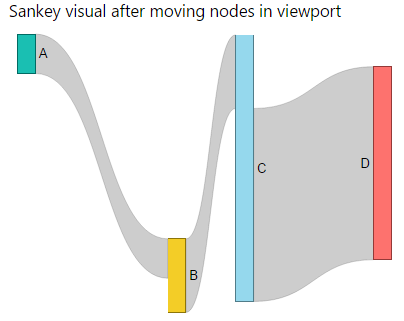
Drag & drop
Sankey visual allows moving nodes to any position of viewport by mouse. After moving nodes to different positions, the visual saves the state and draws nodes at the same positions after resizing the visual or reloading the report.