Calculate the Lorenz Curve and Gini Coefficient in a Person Query
Source:R/create_lorenz.R
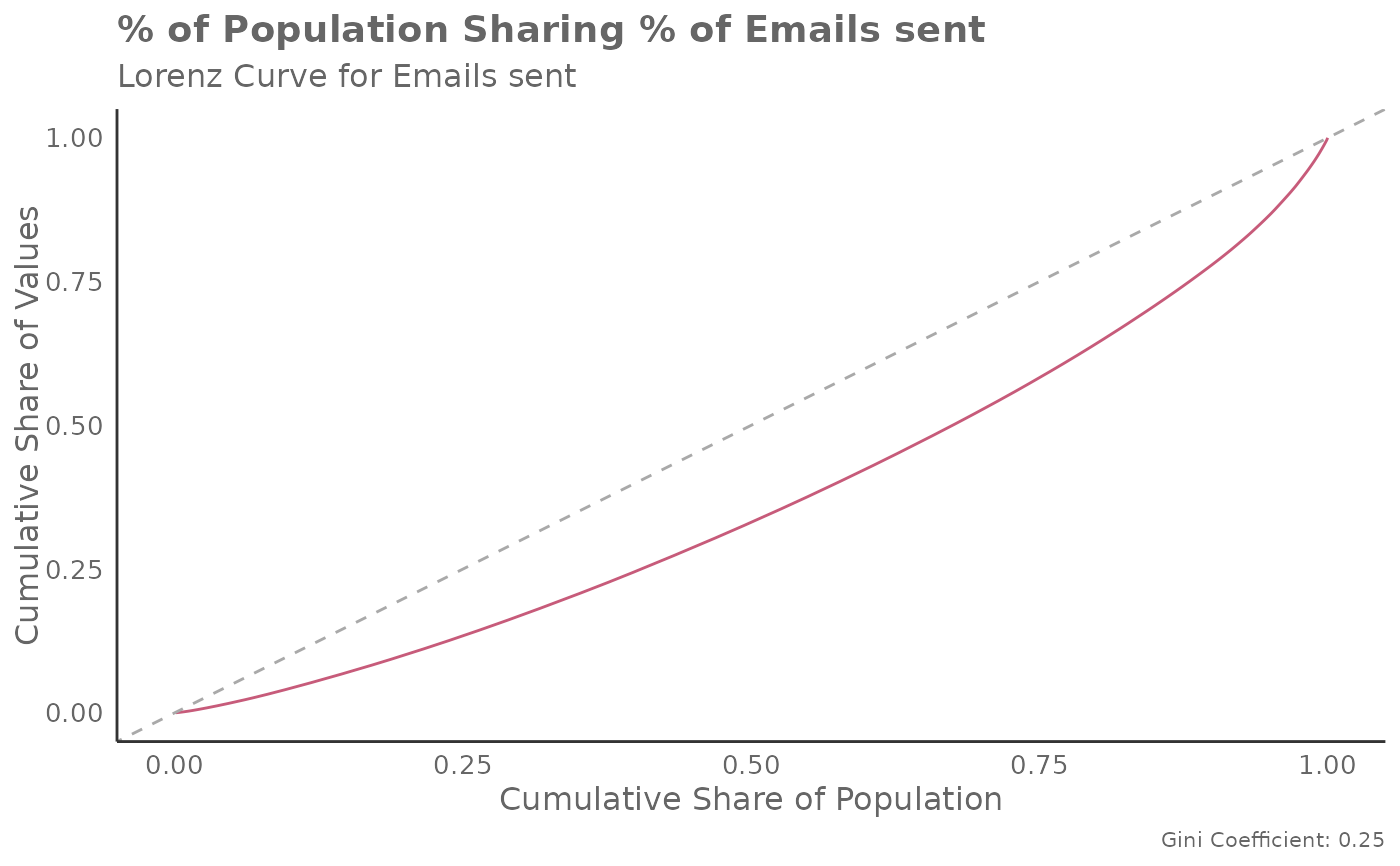
create_lorenz.RdThis function computes the Gini coefficient and plots the Lorenz curve based on a selected metric from a Person Query data frame. It provides a way to measure inequality in the distribution of the selected metric.This function can be integrated into a larger analysis pipeline to assess inequality in metric distribution.
Arguments
- data
Data frame containing a Person Query.
- metric
Character string identifying the metric to be used for the Lorenz curve and Gini coefficient calculation.
- return
Character string identifying the return type. Options are:
"gini"- Numeric value representing the Gini coefficient."table"- Data frame containing a summary table of population share and value share."plot"(default) -ggplotobject representing a plot of the Lorenz curve.
Gini coefficient
The Gini coefficient is a measure of statistical dispersion most commonly used to represent income inequality within a population. It is calculated as the ratio of the area between the Lorenz curve and the line of perfect equality (the 45-degree line) to the total area under the line of perfect equality. It has a range of 0 to 1, where 0 represents perfect equality and 1 represents perfect inequality. It can be applied to any Viva Insights metric where inequality is of interest.
Examples
create_lorenz(data = pq_data, metric = "Emails_sent", return = "gini")
#> [1] 0.1839071

create_lorenz(data = pq_data, metric = "Emails_sent", return = "plot")


create_lorenz(data = pq_data, metric = "Emails_sent", return = "table")
#> # A tibble: 11 × 2
#>    population_share value_share
#>               <dbl>       <dbl>
#>  1              0    0.00000659
#>  2              0.1  0.0457
#>  3              0.2  0.112
#>  4              0.3  0.190
#>  5              0.4  0.276
#>  6              0.5  0.370
#>  7              0.6  0.473
#>  8              0.7  0.584
#>  9              0.8  0.706
#> 10              0.9  0.840
#> 11              1    1