Tutorial 4: Visualizing State Space
How do you know what Accordant is actually testing? In this tutorial, you'll learn to visualize the state graph—seeing every state and transition your tests cover.
Time: 10-15 minutes
What you'll learn:
- Generating GraphViz visualizations
- Understanding the state graph
- Using visualization for debugging
Prerequisites:
- Completed Tutorial 1
- GraphViz installed (optional, for rendering)
What is the State Graph?
Accordant explores your system as a state graph:
- Nodes = States your system can be in
- Edges = Operations that transition between states
From your InputSet, Accordant builds this graph and generates test cases that cover the paths.
Generating a Visualization
Add this to your test class (see the TodoList sample for a complete example):
[Test]
public void VisualizeStateSpace()
{
    var spec = CreateSpec();
    var initialState = new AppState();

    var createUser = spec.GetOperation<User, ApiResult<User>>("CreateUser");
    var deleteUser = spec.GetOperation<string, int>("DeleteUser");
    var createTodo = spec.GetOperation<Todo, ApiResult<Todo>>("CreateTodo");
    var getTodo = spec.GetOperation<(string, string), ApiResult<Todo>>("GetTodo");

    var inputs = new InputSet()
    {
        createUser.With(new User("alice", "Alice"), "Create user"),
        createTodo.With(new Todo("alice", "todo-1", "Task"), "Create todo"),
        getTodo.With(("alice", "todo-1"), "Get todo"),
        deleteUser.With("alice", "Delete user"),
    };

    var dot = spec.VisualizeStateSpace(
        initialState,
        inputs,
        generationOptions: new TestGenerationOptions { MaxDepth = 4 });

    // Write to file for manual PNG conversion
    File.WriteAllText("todolist-state-graph.dot", dot);

    TestContext.WriteLine("State space visualization (DOT format):");
    TestContext.WriteLine("Written to todolist-state-graph.dot");
    TestContext.WriteLine("Convert to PNG: dot -Tpng todolist-state-graph.dot -o todolist-state-graph.png");
    TestContext.WriteLine();
    TestContext.WriteLine(dot);
}
Rendering the Graph
The output is in DOT format. Render it with GraphViz:
dot -Tpng todolist-state-graph.dot -o todolist-state-graph.png
Or use online tools like GraphViz Online.
Understanding the Output
Here's what the rendered graph looks like:
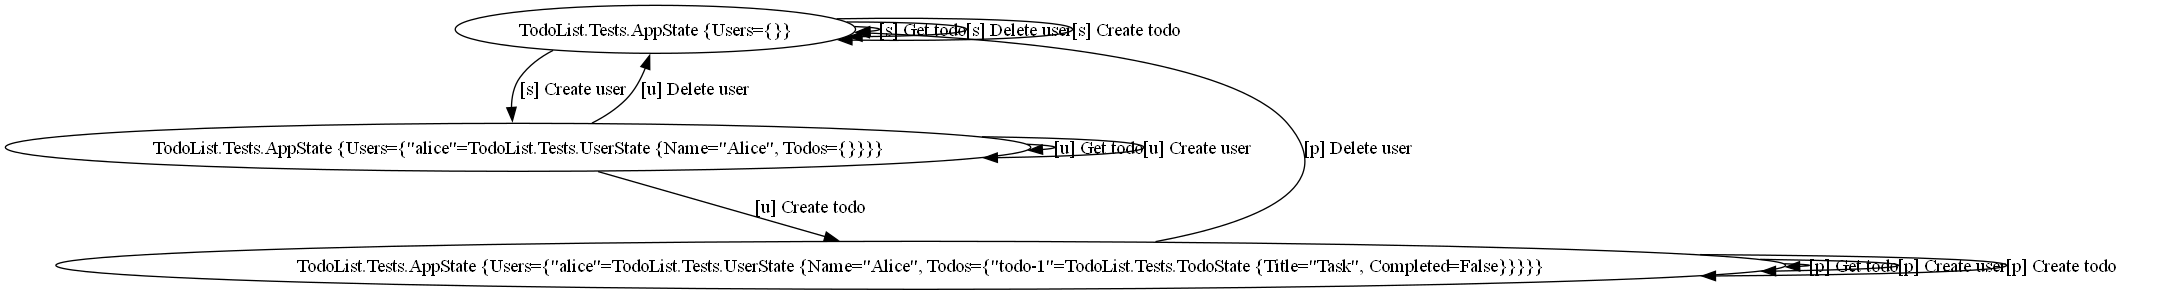
The three states:
- Empty —
{Users={}} - User Exists —
{Users={"alice": {Name="Alice", Todos={}}}} - Todo Exists —
{Users={"alice": {Name="Alice", Todos={"todo-1": {Title="Task", Completed=False}}}}}
Reading the graph:
- Edges show operations that transition between states
- Self-loops are operations that don't change state (GET returns data, errors don't modify anything)
Why Visualize?
1. Debug Unexpected Coverage
If tests are failing or you're not getting expected coverage:
var options = new TestGenerationOptions
{
    MaxDepth = 5,
    StateConstraint = state => ((AppState)state).Users.Count <= 2
};
Visualize to see if your StateConstraint is cutting off important states.
2. Understand Complexity
A small InputSet can explode into many states. Visualization helps you understand:
- How many unique states exist
- Which operations cause branching
- Where cycles occur (operations that loop back)
3. Validate the Spec
Before running tests, check that the state graph matches your mental model:
- Are error transitions shown?
- Does state change when expected?
- Are there missing transitions?
Customizing the Visualization
You can customize how nodes are labeled:
var dotContent = spec.VisualizeStateSpace(
    new AppState(),
    inputs,
    new TestGenerationOptions { MaxDepth = 3 },
    new VisualizationOptions
    {
        // Custom label: show just user count
        NodeLabelLambda = node =>
        {
            var state = (AppState)node.State;
            return $"Users: {state.Users.Count}\\nTodos: {state.Users.Values.Sum(u => u.Todos.Count)}";
        }
    });
Constraining the Graph
Large state spaces are hard to visualize. Use constraints:
var options = new TestGenerationOptions
{
    // Limit sequence length
    MaxDepth = 4,

    // Limit state complexity
    StateConstraint = state =>
    {
        var s = (AppState)state;
        return s.Users.Count <= 2 &&
               s.Users.Values.All(u => u.Todos.Count <= 2);
    }
};
Summary
Visualization helps you understand and debug:
| Use Case | What You Learn |
|---|---|
| View state graph | All states and transitions being tested |
| Debug coverage | Why certain states aren't reached |
| Validate spec | Does the graph match expectations? |
| Communicate | Share understanding with team |
Key Command
var dot = spec.VisualizeStateSpace(initialState, inputs, options);
File.WriteAllText("graph.dot", dot);
// Then: dot -Tpng graph.dot -o graph.png
What's Next?
- Tutorial 5: Testing Race Conditions - Find concurrency bugs with concurrent tests
- Concept: How Test Generation Works - Deep dive into state exploration
Tips
- Start small - Visualize with 2-3 inputs first
- Use StateConstraint - Keep graphs manageable
- Custom labels - Show only relevant state info
- SVG format - Better for large graphs:
dot -Tsvg graph.dot -o graph.svg