Controlling appearance with ggplot2
finer_control.RmdIf you would like to change the default conventions, or to match an existing plot style, datamations can take ggplot2 code as input.
For example, to match this plot, which has Work on the x-axis and Degree in row facets:
library(datamations)
library(dplyr)
library(ggplot2)

small_salary %>%
  group_by(Work, Degree) %>%
  summarize(mean_salary = mean(Salary)) %>%
  ggplot(aes(x = Work, y = mean_salary)) +
  geom_point() +
  facet_grid(rows = vars(Degree))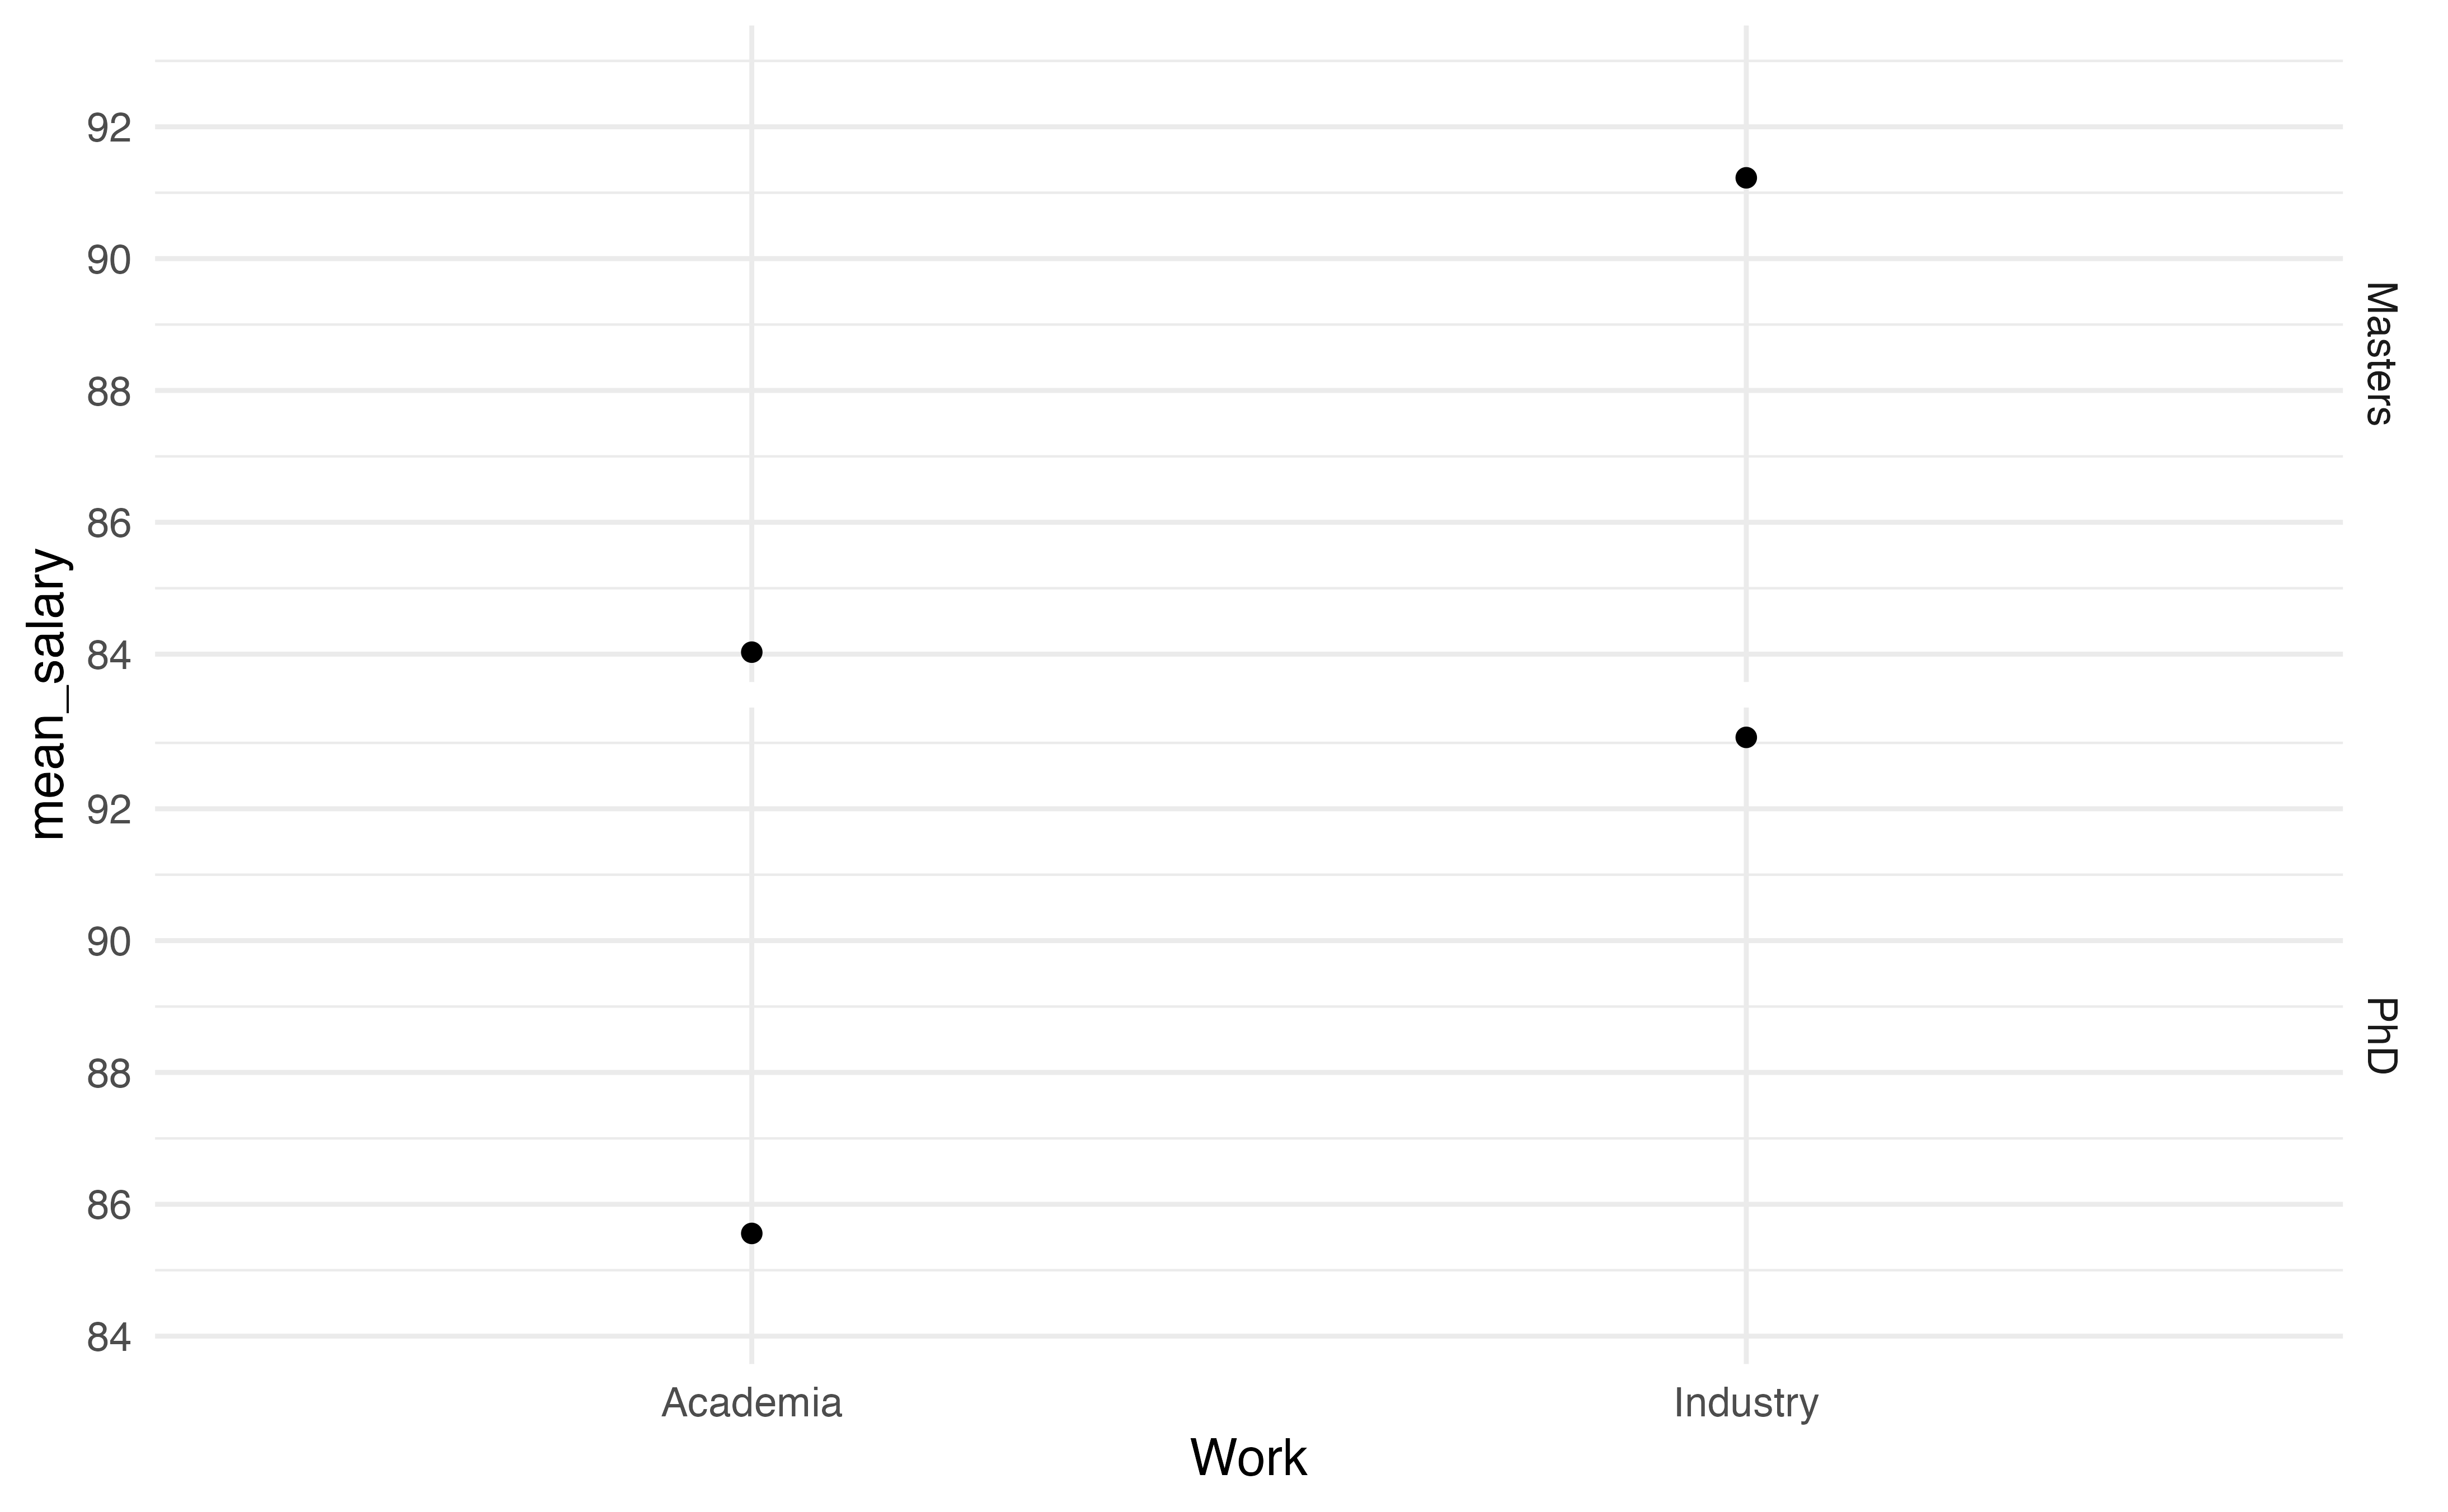
Simply define the code and pass to datamation_sanddance(), which will produce an animation with desired plot layout.
"small_salary %>%
  group_by(Work, Degree) %>%
  summarize(mean_salary = mean(Salary)) %>%
  ggplot(aes(x = Work, y = mean_salary)) +
  geom_point() +
  facet_grid(rows = vars(Degree))" %>%
  datamation_sanddance()
#> Warning: Returning more (or less) than 1 row per `summarise()` group was deprecated in
#> dplyr 1.1.0.
#> ℹ Please use `reframe()` instead.
#> ℹ When switching from `summarise()` to `reframe()`, remember that `reframe()`
#>   always returns an ungrouped data frame and adjust accordingly.
#> ℹ The deprecated feature was likely used in the datamations package.
#>   Please report the issue to the authors.
#> This warning is displayed once every 8 hours.
#> Call `lifecycle::last_lifecycle_warnings()` to see where this warning was
#> generated.When ggplot2 code is provided, the order of animation is not determined by the order in group_by(), but by the plot layout. Variables are first animated by what’s in the column facets, then the row facets, by the x-axis, and finally by color.
Some limitations:
-
facet_wrap()is not supported - please usefacet_grid() - datamations expects different variables in the column and row facets than in the x-axis. datamations generated that do not match this layout may look different than the final plot!
- Only
geom_point()is supported, e.g. specifyinggeom_bar()will not produce a bar in the datamation.