Service Performance Dashboard Documentation
Overview
The Service Performance Dashboard provides insights into the resource usage of Kubernetes pods, including memory and CPU utilization. It is designed to help operators monitor and optimize resource allocation by visualizing key metrics.
Panels Overview
1. Memory Usage
Memory Usage as % of Pod Memory Requests (All Pods)
- Description: Displays memory usage as a percentage of the total memory requested by each pod in the specified namespace.
- Metrics Used:
- Memory Usage:
node_namespace_pod_container:container_memory_working_set_bytes - Memory Requests:
cluster:namespace:pod_memory:active:kube_pod_container_resource_requests
- Memory Usage:
- Thresholds:
- Green: Healthy (value < 80%)
- Red: Critical (value ≥ 80%)
Memory Usage as % of Pod Memory Requests (Specific Pod)
- Description: Displays memory usage as a percentage of the total memory requested by a specific pod.
- Metrics Used:
- Memory Usage:
node_namespace_pod_container:container_memory_working_set_bytes - Memory Requests:
cluster:namespace:pod_memory:active:kube_pod_container_resource_requests
- Memory Usage:
- Thresholds:
- Green: Healthy (value < 80%)
- Red: Critical (value ≥ 80%)
2. CPU Usage
CPU Usage as % of Pod CPU Requests (All Pods)
- Description: Displays CPU usage as a percentage of the total CPU requested by each pod in the specified namespace.
- Metrics Used:
- CPU Usage:
node_namespace_pod_container:container_cpu_usage_seconds_total:sum_irate - CPU Requests:
cluster:namespace:pod_cpu:active:kube_pod_container_resource_requests
- CPU Usage:
- Thresholds:
- Green: Healthy (value < 80%)
- Red: Critical (value ≥ 80%)
CPU Usage as % of Pod CPU Requests (Specific Pod)
- Description: Displays CPU usage as a percentage of the total CPU requested by a specific pod.
- Metrics Used:
- CPU Usage:
node_namespace_pod_container:container_cpu_usage_seconds_total:sum_irate - CPU Requests:
cluster:namespace:pod_cpu:active:kube_pod_container_resource_requests
- CPU Usage:
- Thresholds:
- Green: Healthy (value < 80%)
- Red: Critical (value ≥ 80%)
Setting Up the Dashboard
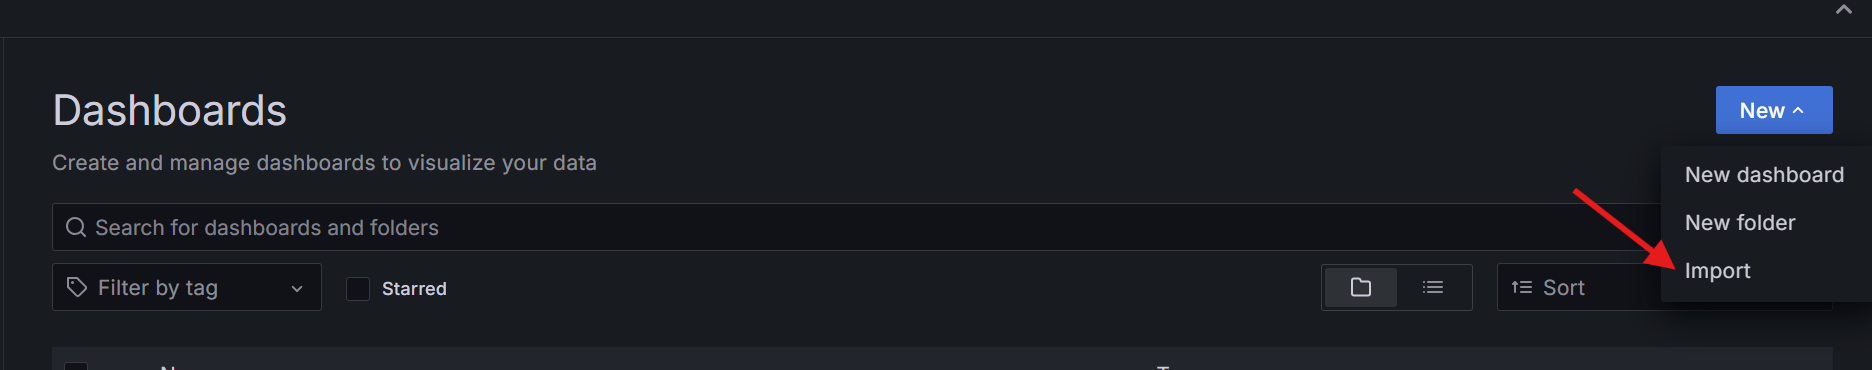
To set up the Service Performance Dashboard, you need to manually import the dashboard JSON file into Azure Managed Grafana.
-
Click the import button on the right-hand side.
-
Click import JSON.
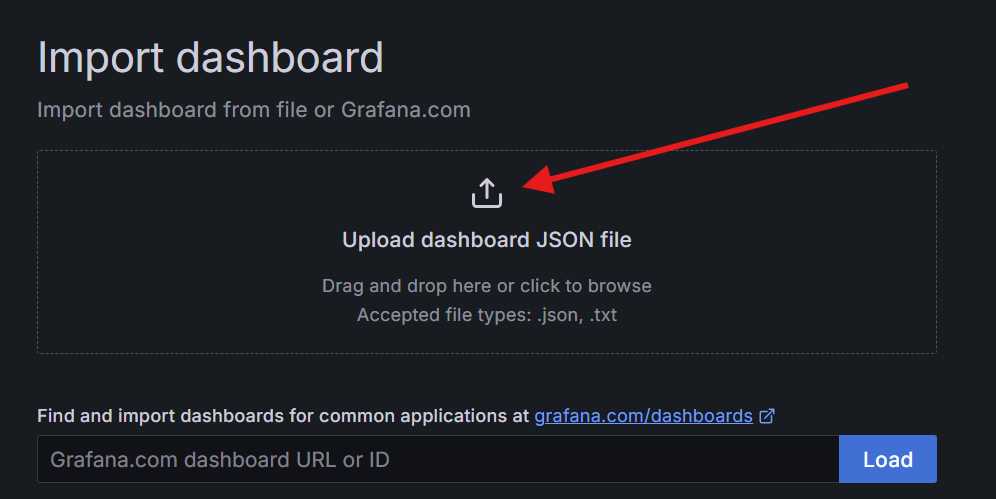
-
Choose the
service-performance-dashboard.jsonfile from thedocs/observabilitydirectory.
Once imported, you can start monitoring the resource usage of your system using the panels described above.
Conclusion
The Service Performance Dashboard provides a centralized view of in-cluster resource utilization, enabling proactive monitoring and optimization. Each panel is tailored to highlight specific metrics and thresholds, ensuring that operators can quickly identify and address potential inefficiencies.
🤖 Crafted with precision by ✨Copilot following brilliant human instruction, then carefully refined by our team of discerning human reviewers.