Asset Connectivity Monitoring
Status
- Draft
- Proposed
- Accepted
- Deprecated
Context
Assets' connectivity state can change due to downtime of the devices or network issues. The operator needs to be informed about the connectivity state of the assets to ensure the devices are operational and the data is available. Additionally subsystems depending on OT data from the devices can be notified about the connectivity state of the assets and trigger the necessary and relevant actions.
Decision
The connectivity state of the assets will be monitored and displayed in a user-friendly way in a Grafana dashboard.
Decision Drivers
- We want to achieve transparency about the connectivity state of the assets
- We want to make the connectivity state available in the Local and Enterprise UNS and for subsystems
Considered Options
There are different ways to monitor the connectivity state of the assets:
a. display the connectivity state in a Grafana dashboard on the factory floor b. publish the connectivity state to an MQTT broker and make it available in the Local and Enterprise UNS
Decision Conclusion
OPC UA Broker can log connectivity state of an asset and needs to be configured to expose the logs. Configure observability as documented, and ensure you install Azure IoT Operations OPC UA broker with the setting connectors.values.openTelemetry.endpoints.default.emitLogs=true.
az iot ops create --cluster <> --resource-group <> --name <> \
    --<other-params> <...> \
    --ops-config observability.metrics.openTelemetryCollectorAddress=<> \
    --ops-config connectors.values.openTelemetry.endpoints.default.emitLogs=true
Since the OPC UA Broker utilizes OpenTelemetry, we can simply define an OpenTelemetry overlay configuration to setup a pipeline that emits logs to loki.

A good starting point is the repository azure-edge-extensions-aio-observability-gitops which contains the necessary configuration files to setup the OpenTelemetry Collector and Loki.
Installation
Leverage the sample repo azure-edge-extensions-aio-observability-gitops Readme and follow the Installation and Quickstart steps to configure a sample environment.
Loki Configuration
Loki can be used as a datasource in a Grafana dashboard to display the connectivity state of the assets. So you can use logQL to query the logs and to make them available in visualizations. You can refer to the Loki documentation for more details.
-
Add the Loki datasource to Grafana, if you are using the sample referenced above this will already be configured. More details can be found in the Grafana documentation.
-
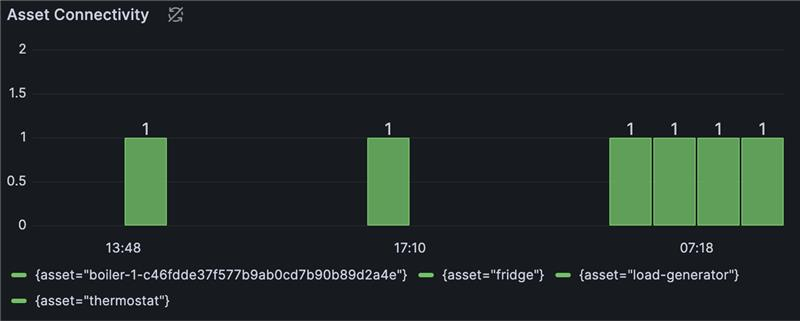
Create a new dashboard in Grafana and add a new panel to display the connectivity state of the assets. You can use the following query to display the logs:
sum by(asset) (
  max_over_time(
    {job="azure-iot-operations/opcua-connector"} |= `Session for asset`
    | pattern `<_>Session for asset <asset>/<_> is <connectivityState>"<_>`
    | label_format connectivity=`{{ if eq "connected" .connectivityState }}1{{else}}0{{end}}`
    | unwrap connectivity [$__interval]
  )
)
An example Asset Connectivity panel:
AI and automation capabilities described in this scenario should be implemented following responsible AI principles, including fairness, reliability, safety, privacy, inclusiveness, transparency, and accountability. Organizations should ensure appropriate governance, monitoring, and human oversight are in place for all AI-powered solutions.