Overview
CLI Reference
Getting Started
This example creates a basic app from scratch, adds an artificial bottleneck to it, and then shows you how to configure the build and run flamegrill to see the artificial bottleneck.
Basic App Setup
- Create App
Create a basic Fabric app using:
npm init uifabric
- Create Sample Hotspot
In the app's src/App.tsx file, add an InefficientComponent:
const InefficientComponent: React.FunctionComponent = (props) => {
  // This is an abritrary bottleneck to show in flamegraph results.
  for (let i = 0; i < 100; i++) {
    console.log(i);
  }
  return <div>{props.children}</div>
}- Add Hotspot to App
In the same src/App.tsx file, use InefficientComponent:
export const App: React.FunctionComponent = () => {
   return
     // ...
     <InefficientComponent>
       <img src={logo} alt="logo" />
</InefficientComponent>- Modify Build Configuration
In the app's root directory, modify webpack.config.js:
  {
    // Here you can add custom webpack configurations
    optimization: {
      // We no not want to minimize our code.
      minimize: false
    },
}- Build App
yarn build
This should generate dist/index.html which we will use in flamegrill.
Run Flamegrill
- Install Flamegrill
- Create an Output Directory
Flamegrill will create file output, so find or create a directory from which to run flamegrill.
- Run Flamegrill
Modifying the path as appropriate, run flamegrill against dist/index.html generated with the build above:
flamegrill -n AppTest -s file:///C:/app/dist/index.htmlInspect Results
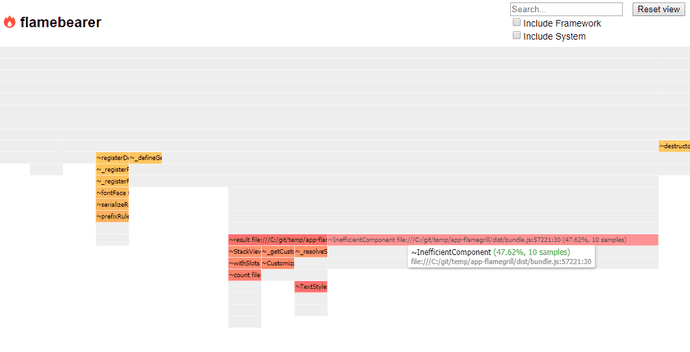
In the directory where you run flamegrill, there should be an AppTest.html file which you can open in a browser. Opening it should reveal a flamegraph similar to the following, highlighting InefficientComponent as a bottleneck:
We can see here that InefficientComponent stands out quite a bit, consuming 47.62% of total render time.
