On this page
Copilot CLI Usage Dashboard



An experimental local dashboard for exploring GitHub Copilot CLI usage. It reads the CLI session store, exports aggregate usage data to CSV, and creates a self-contained HTML dashboard.
The local session-store schema is not a stable public API. Copilot CLI updates can change the extractor’s assumptions. See Compatibility and data format.
Quick start
Requirements:
- Python 3.9 or later
- GitHub Copilot CLI session data on the local machine
git clone https://github.com/microsoft/ghc-cli-dashboard.git
cd ghc-cli-dashboard
python -m pip install -r requirements.txt

python extract_usage.py
python dashboard.py --in "copilot_usage_*.csv" --out usage_dashboard.html
Open usage_dashboard.html in a browser.
Task summaries are included by default, since this tool is meant for personal viewing and the Work patterns view relies on them. Pass --exclude-task-summary to extract_usage.py if you’d rather leave them out, and review the privacy implications before sharing a CSV or dashboard.
What it shows
- Token usage and estimated list-price cost by project, model, and provider.
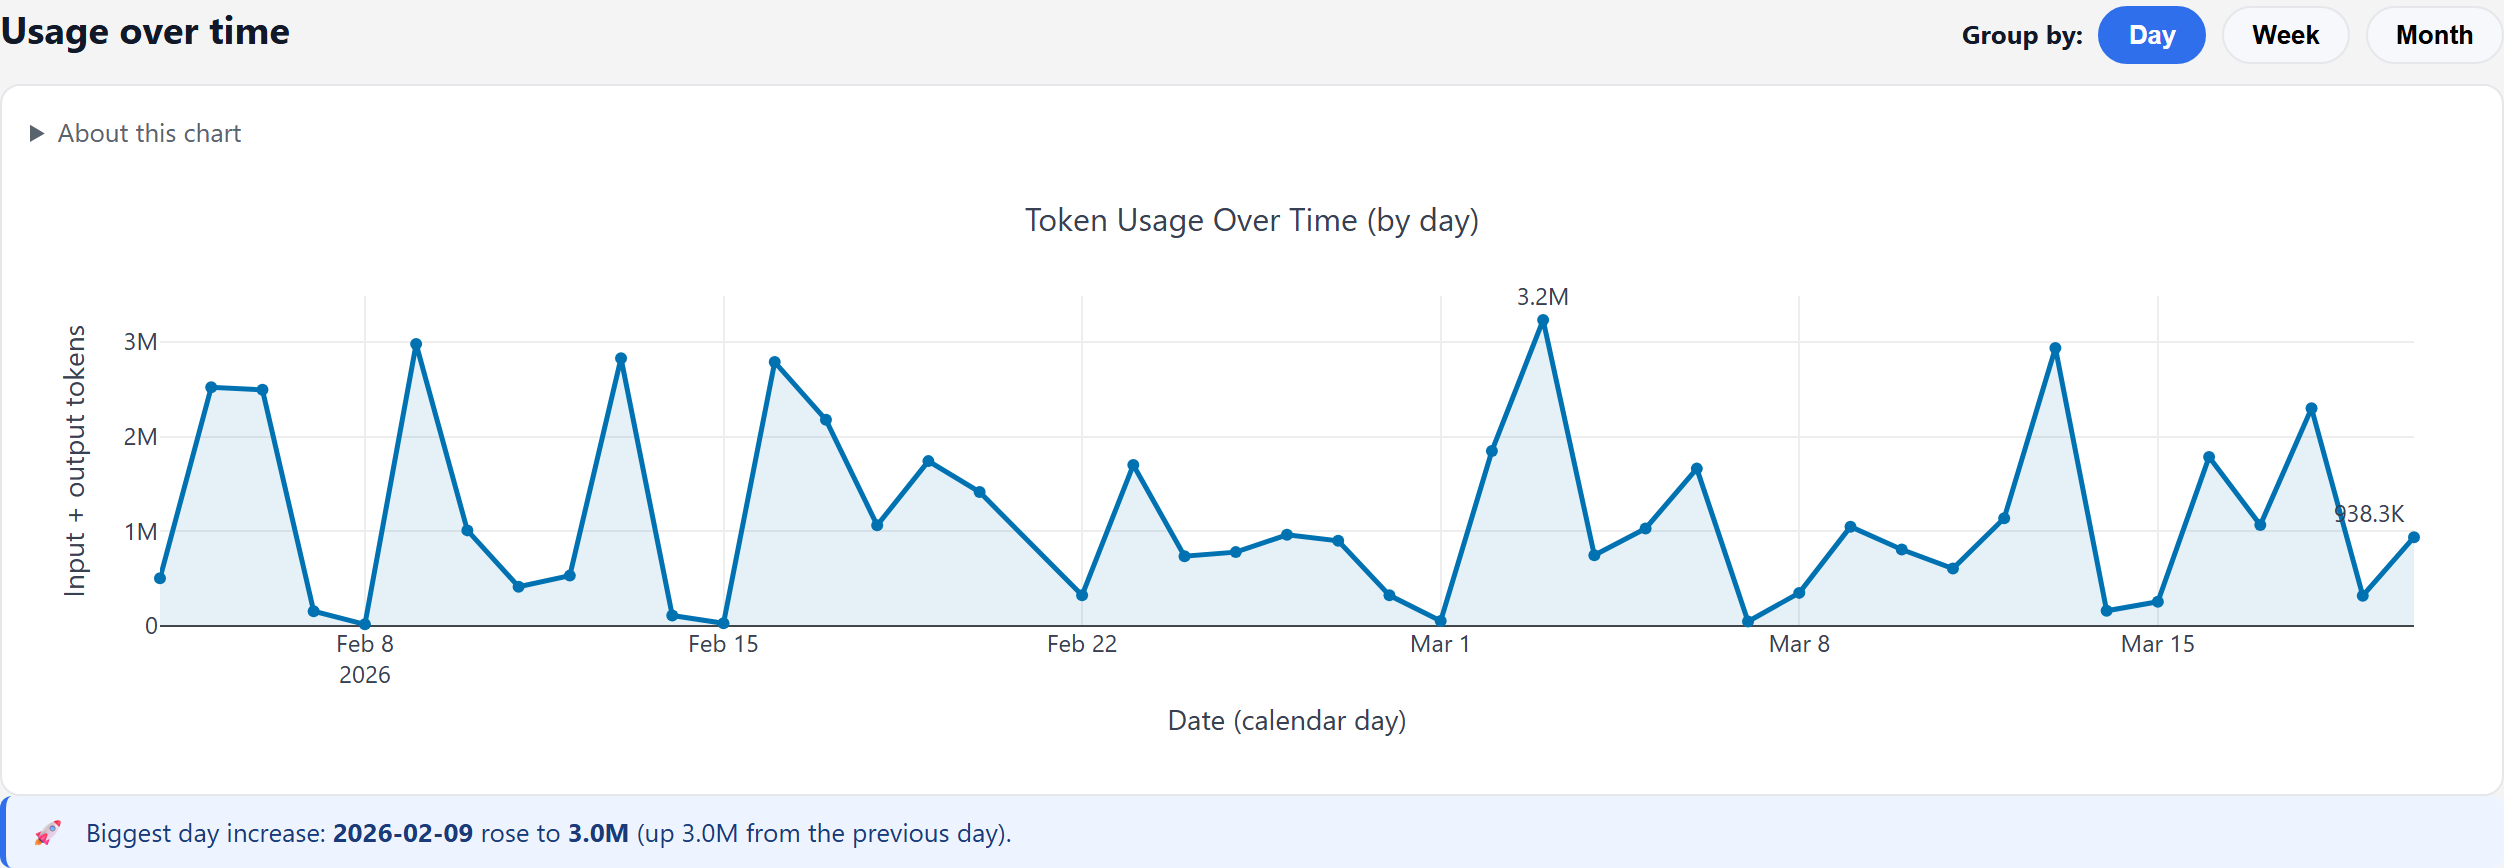
- Trends by day, week, or month.
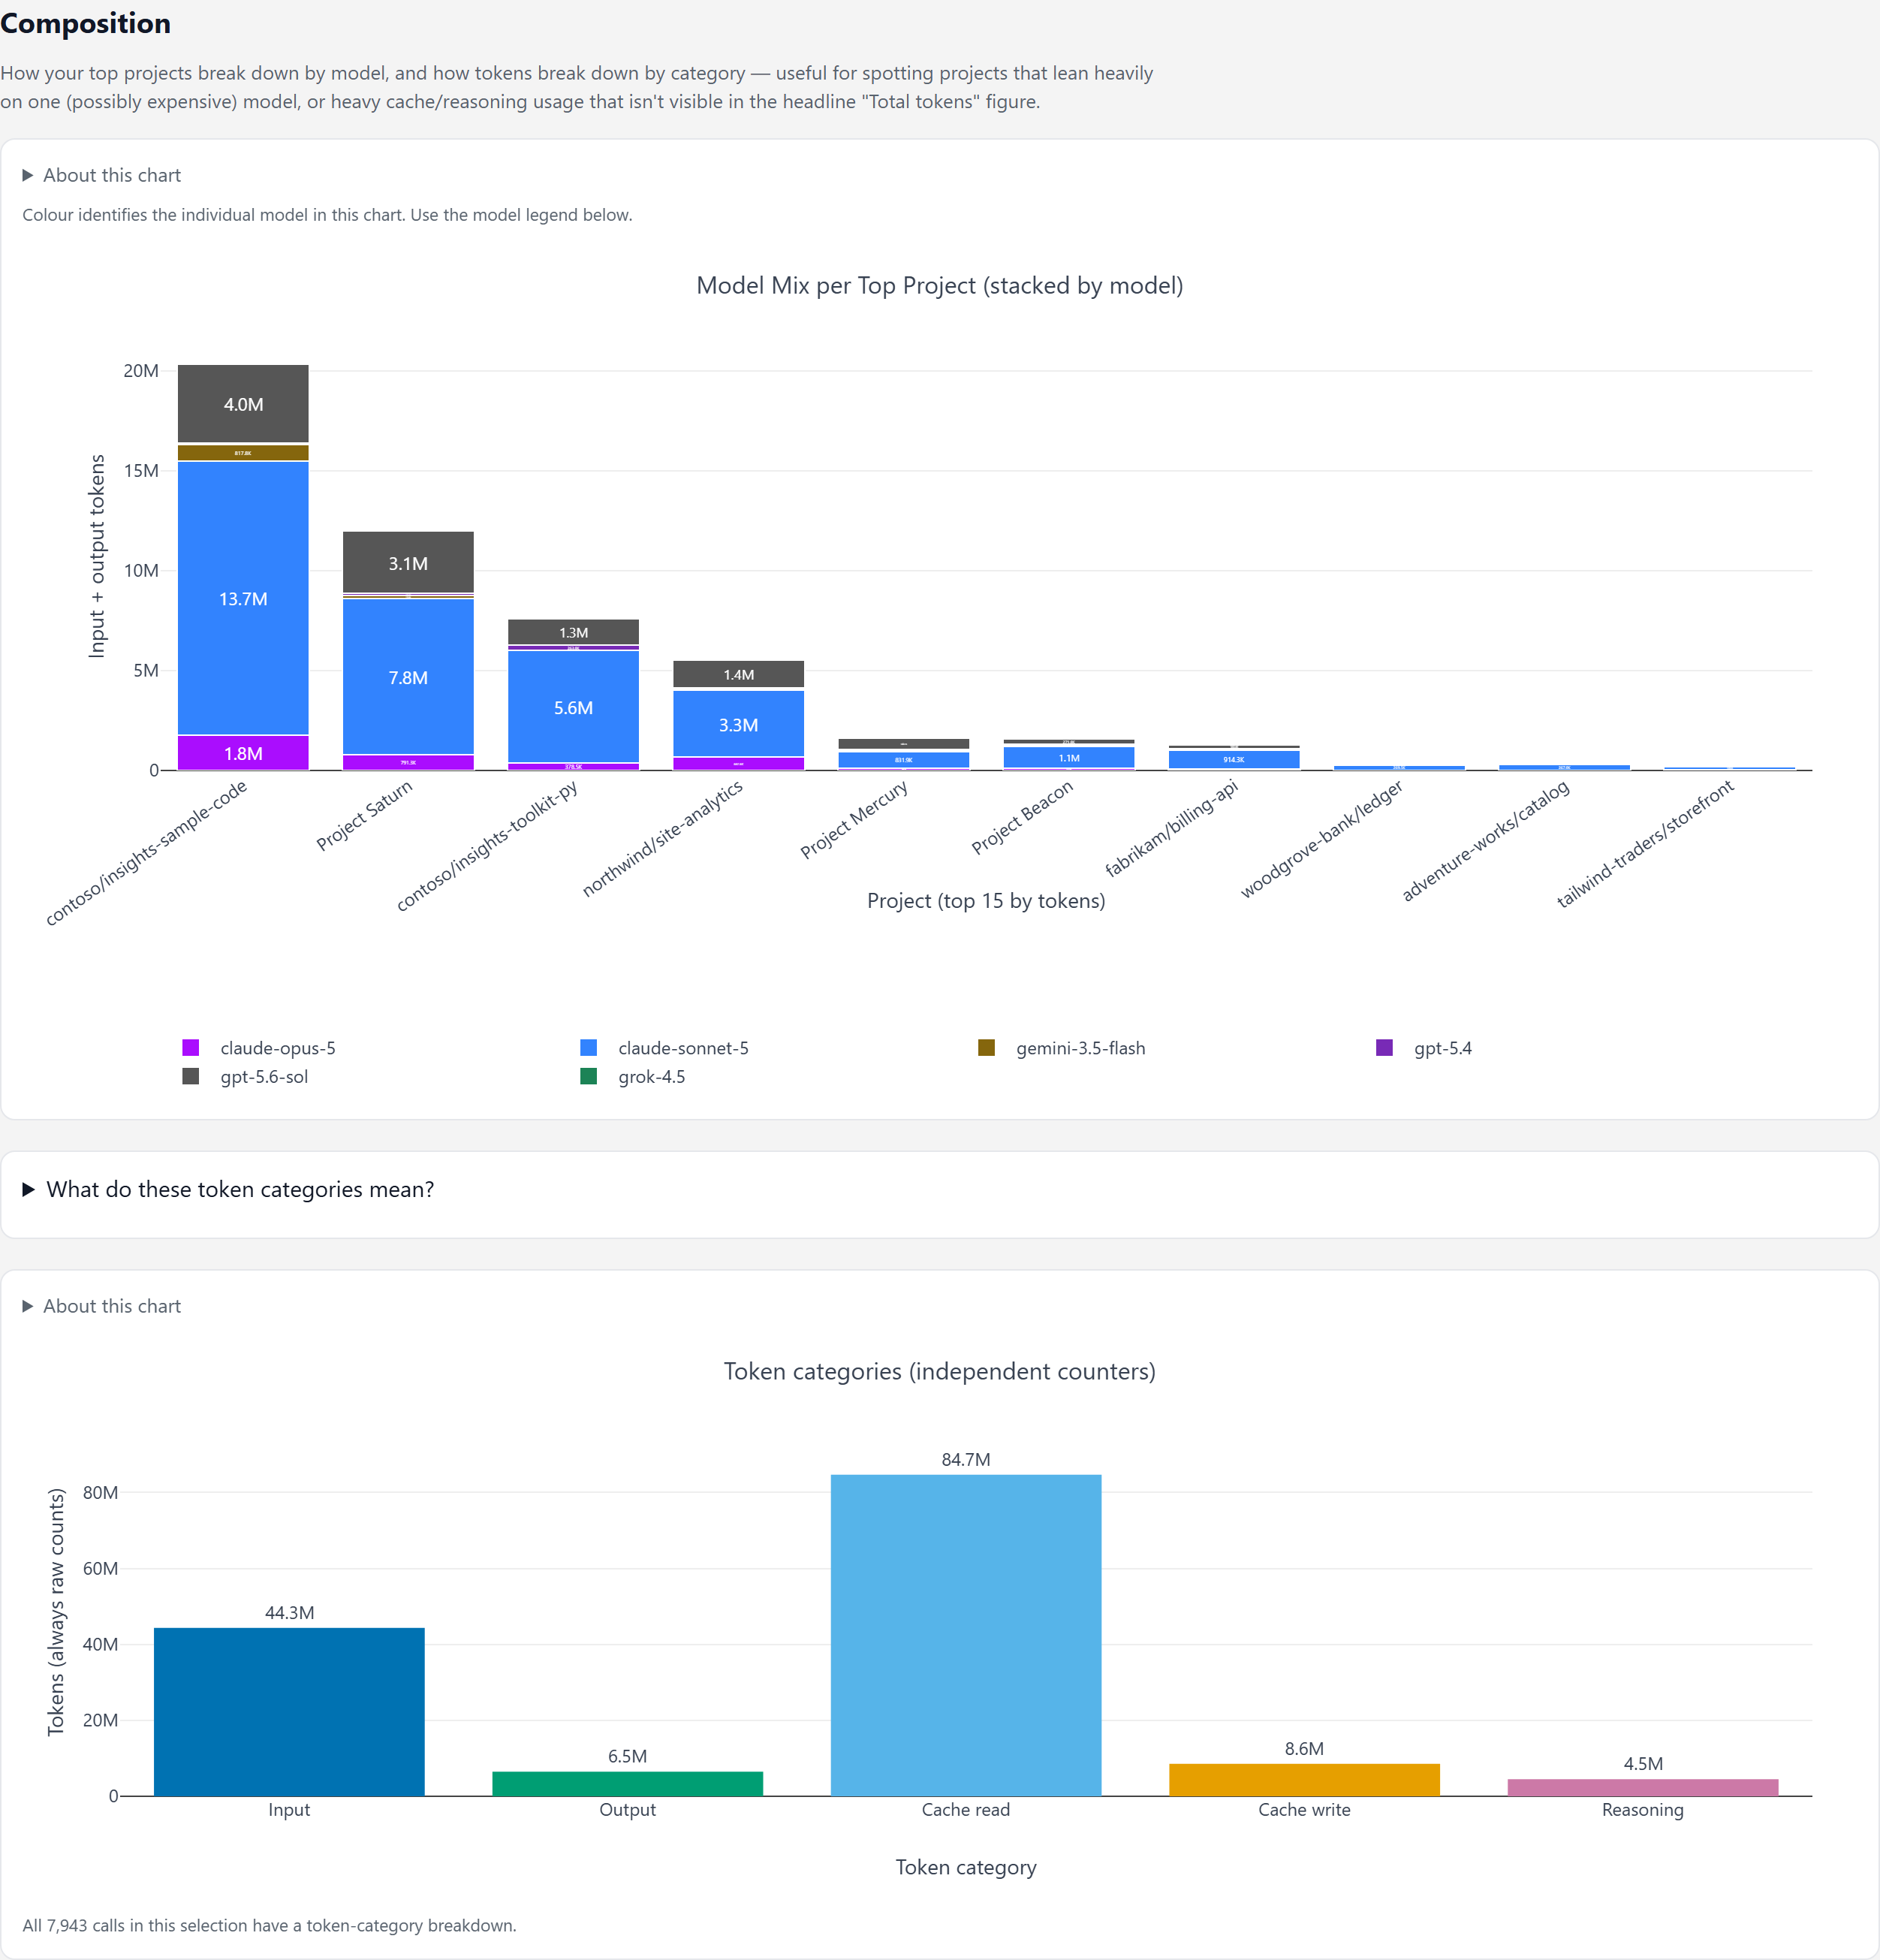
- Input, output, cache, and reasoning token categories.
- Model mix, provider mix, reasoning effort, and task detail.
The dashboard estimates cost from usage data recorded by Copilot CLI. It does not represent an invoice.
Exploring your usage
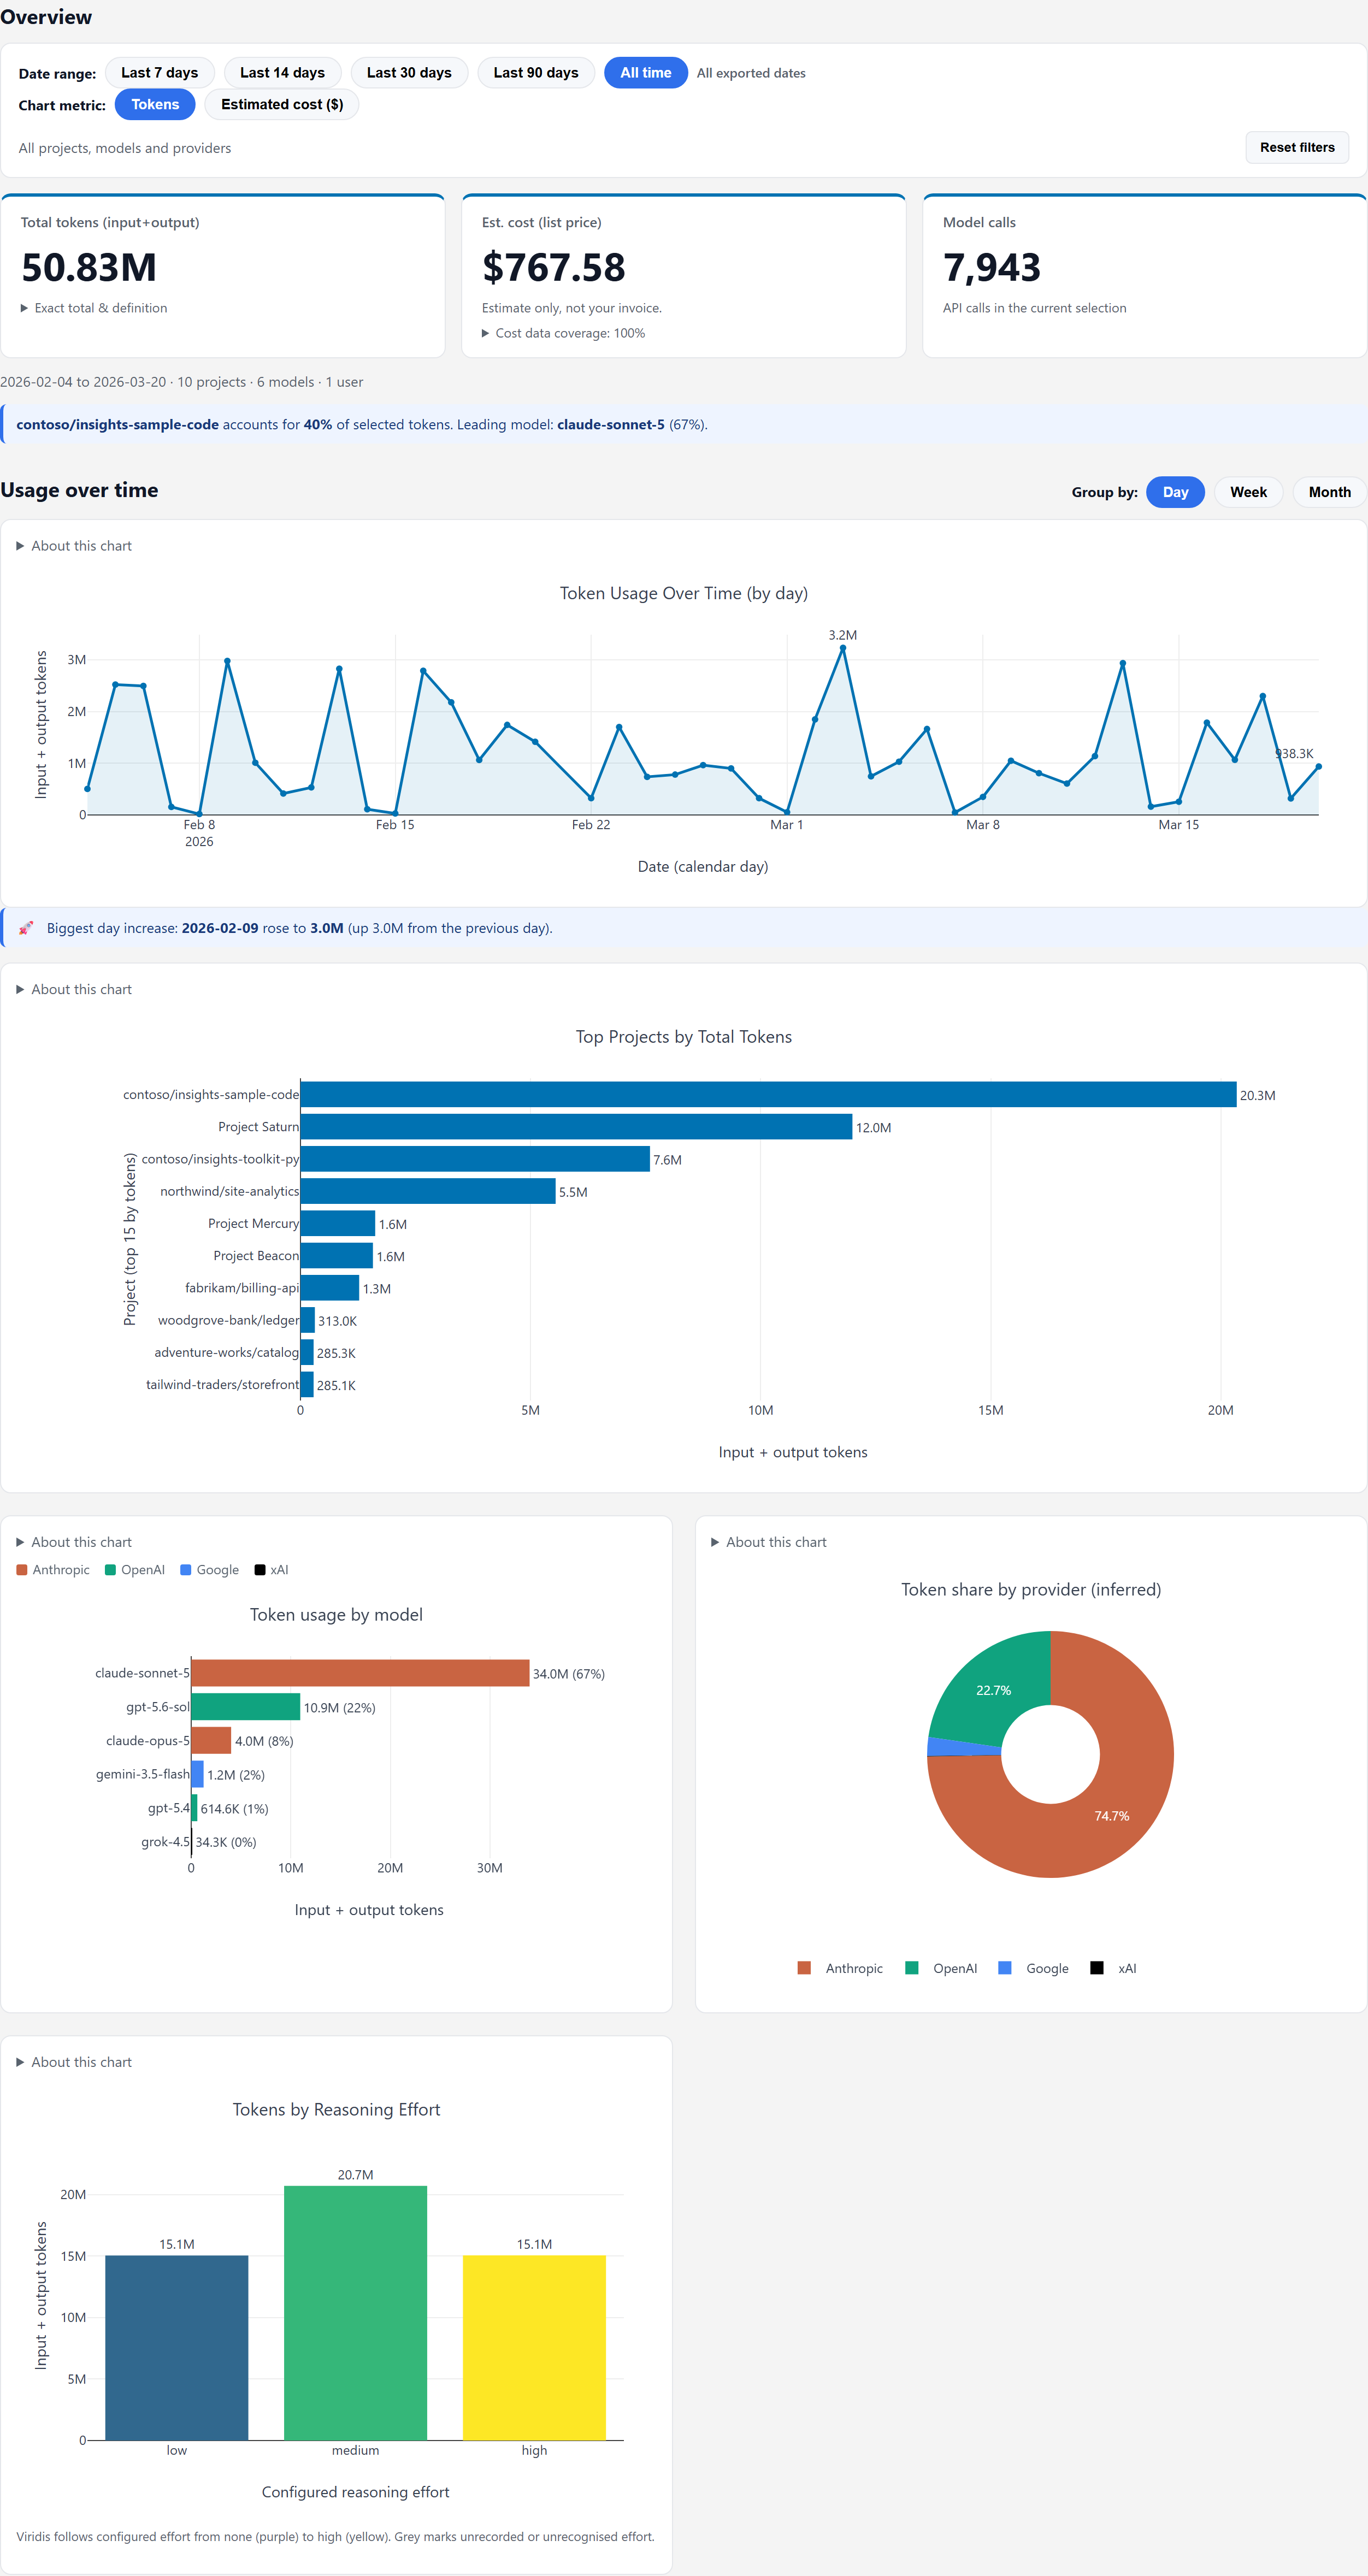
The overview puts date and metric controls above three headline metrics and the usage trend. Cost coverage is attached to the cost card, with incomplete coverage expanded automatically. Expand the token card for its exact total and definition.
Search projects or models in the filter panel, use Only to select one item in a group, or Show more to browse beyond the first eight items. Reset filters includes all projects, models, providers and dates. Search only changes which filter options are visible, not the usage being shown. The sidebar has its own Hide filters control. When collapsed, a narrow reopen rail stays available as you scroll, and the choice is remembered on reload. On narrow screens, Show filters expands the panel below the controls. Collapsing hides the filter list only, not project names in charts or tables.
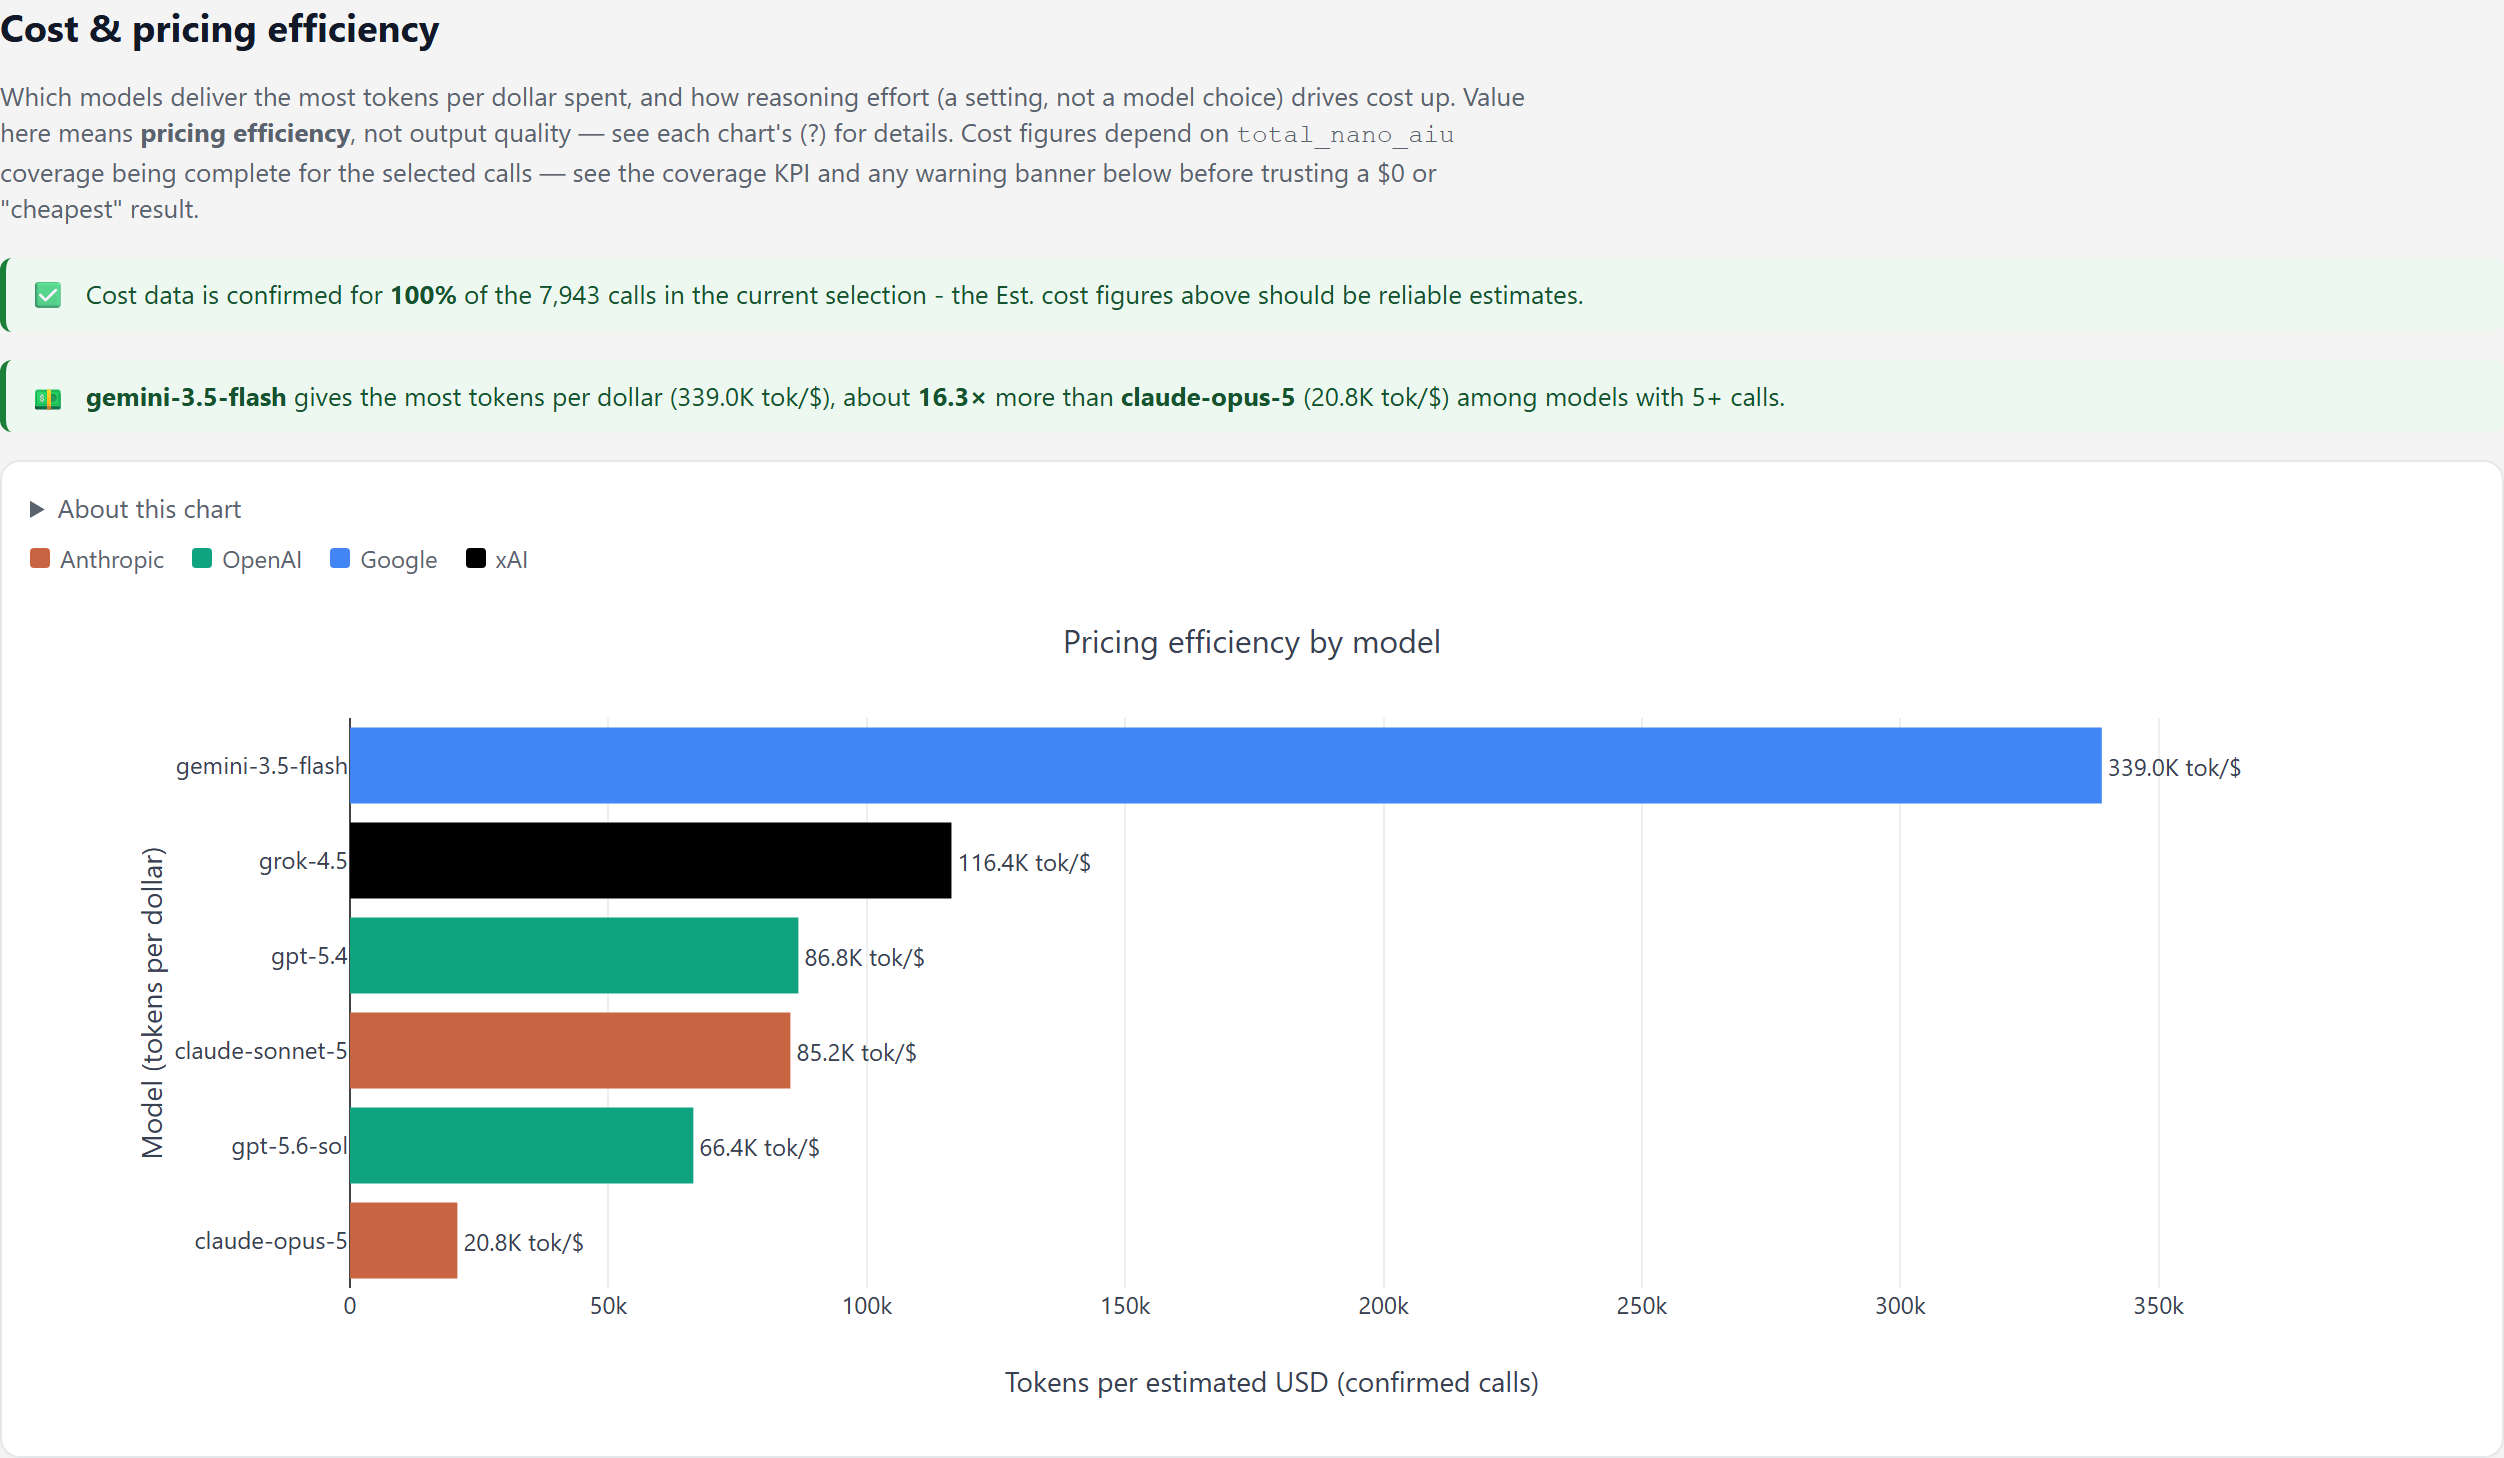
Models use their provider’s colour consistently across rankings and pricing efficiency. Model Mix per Top Project is an exception: its categorical palette assigns a distinct colour to each model so its legend is unambiguous. Anthropic is terracotta, OpenAI is teal, Google is blue, xAI is black, and unknown providers are grey. Other charts use palettes matched to the data: Okabe-Ito for categories, Viridis for continuous heatmaps and ordered reasoning-effort levels, and one blue for aggregate totals and trends. See filter behaviour for details.
Screenshots
All screenshots use synthetic data generated by tools/make_sample_data.py. No real usage data is shown.
Headline numbers, usage trend, top projects, and model and provider mix:
Usage over time, with daily, weekly, and monthly grouping:
Estimated cost against usage, to show where spend concentrates:
Token categories, including an explainer for cache read and cache write:
Privacy
The export CSV and generated dashboard can contain usernames, project names, session IDs, dates, models, and optional task summaries. Generated HTML embeds its source rows.
Review files before sharing them. Use build-time redaction when needed:
python dashboard.py --in "copilot_usage_*.csv" --out shared_dashboard.html `
  --exclude-project "Personal Project" `
  --omit-task-summaries
The .gitignore excludes generated CSV and HTML files. Do not commit them. See Advanced usage for sharing, redaction, and combining multiple exports.
Documentation
| Topic | Guide |
|---|---|
| Compatibility, CSV format, and schema boundary | Compatibility and data format |
| Token fields and cost estimates | Token and cost data |
| Privacy, redaction, filters, providers, and combined exports | Advanced usage |
| Development and tests | Development |
Dependencies
The project uses pandas for data processing and Plotly for charts. Generated dashboards bundle Plotly.js so they can open without a web server.
Contributing and support
Telemetry
This project does not collect, transmit, or enable telemetry. It reads local files and writes local CSV and HTML files.
Trademarks
This project may contain trademarks or logos for projects, products, or services. Authorized use of Microsoft trademarks or logos is subject to and must follow Microsoft’s Trademark & Brand Guidelines. Use of Microsoft trademarks or logos in modified versions of this project must not cause confusion or imply Microsoft sponsorship. Any use of third-party trademarks or logos is subject to those third-party’s policies.