vivainsights is a Python package for analyzing and visualizing data from Microsoft Viva Insights.
Access to the Viva Insights Analyst Experience is required. With this library, you can generate visualizations and compute analyses in a way that adheres to the analysis best practices of the Viva Insights query outputs.
This library is available on the Python Package Index (PyPi). For users who prefer R to Python, we recommend the R library counterpart which mirrors the design of the Python package.
Installation
You can install vivainsights from PyPI using pip:
pip install vivainsights
To upgrade to the latest version:
pip install --upgrade vivainsights
If you want to install with optional dependencies for development or documentation, you can use:
pip install vivainsights[dev]
To get started, we recommend checking out the demo Jupyter notebook and the code examples below. You can also find more details in our GitHub repository.
Quick start
Once the library is installed, you can get started in just a few lines:
import vivainsights as vi
# Load a built-in sample person query dataset
pq_data = vi.load_pq_data()
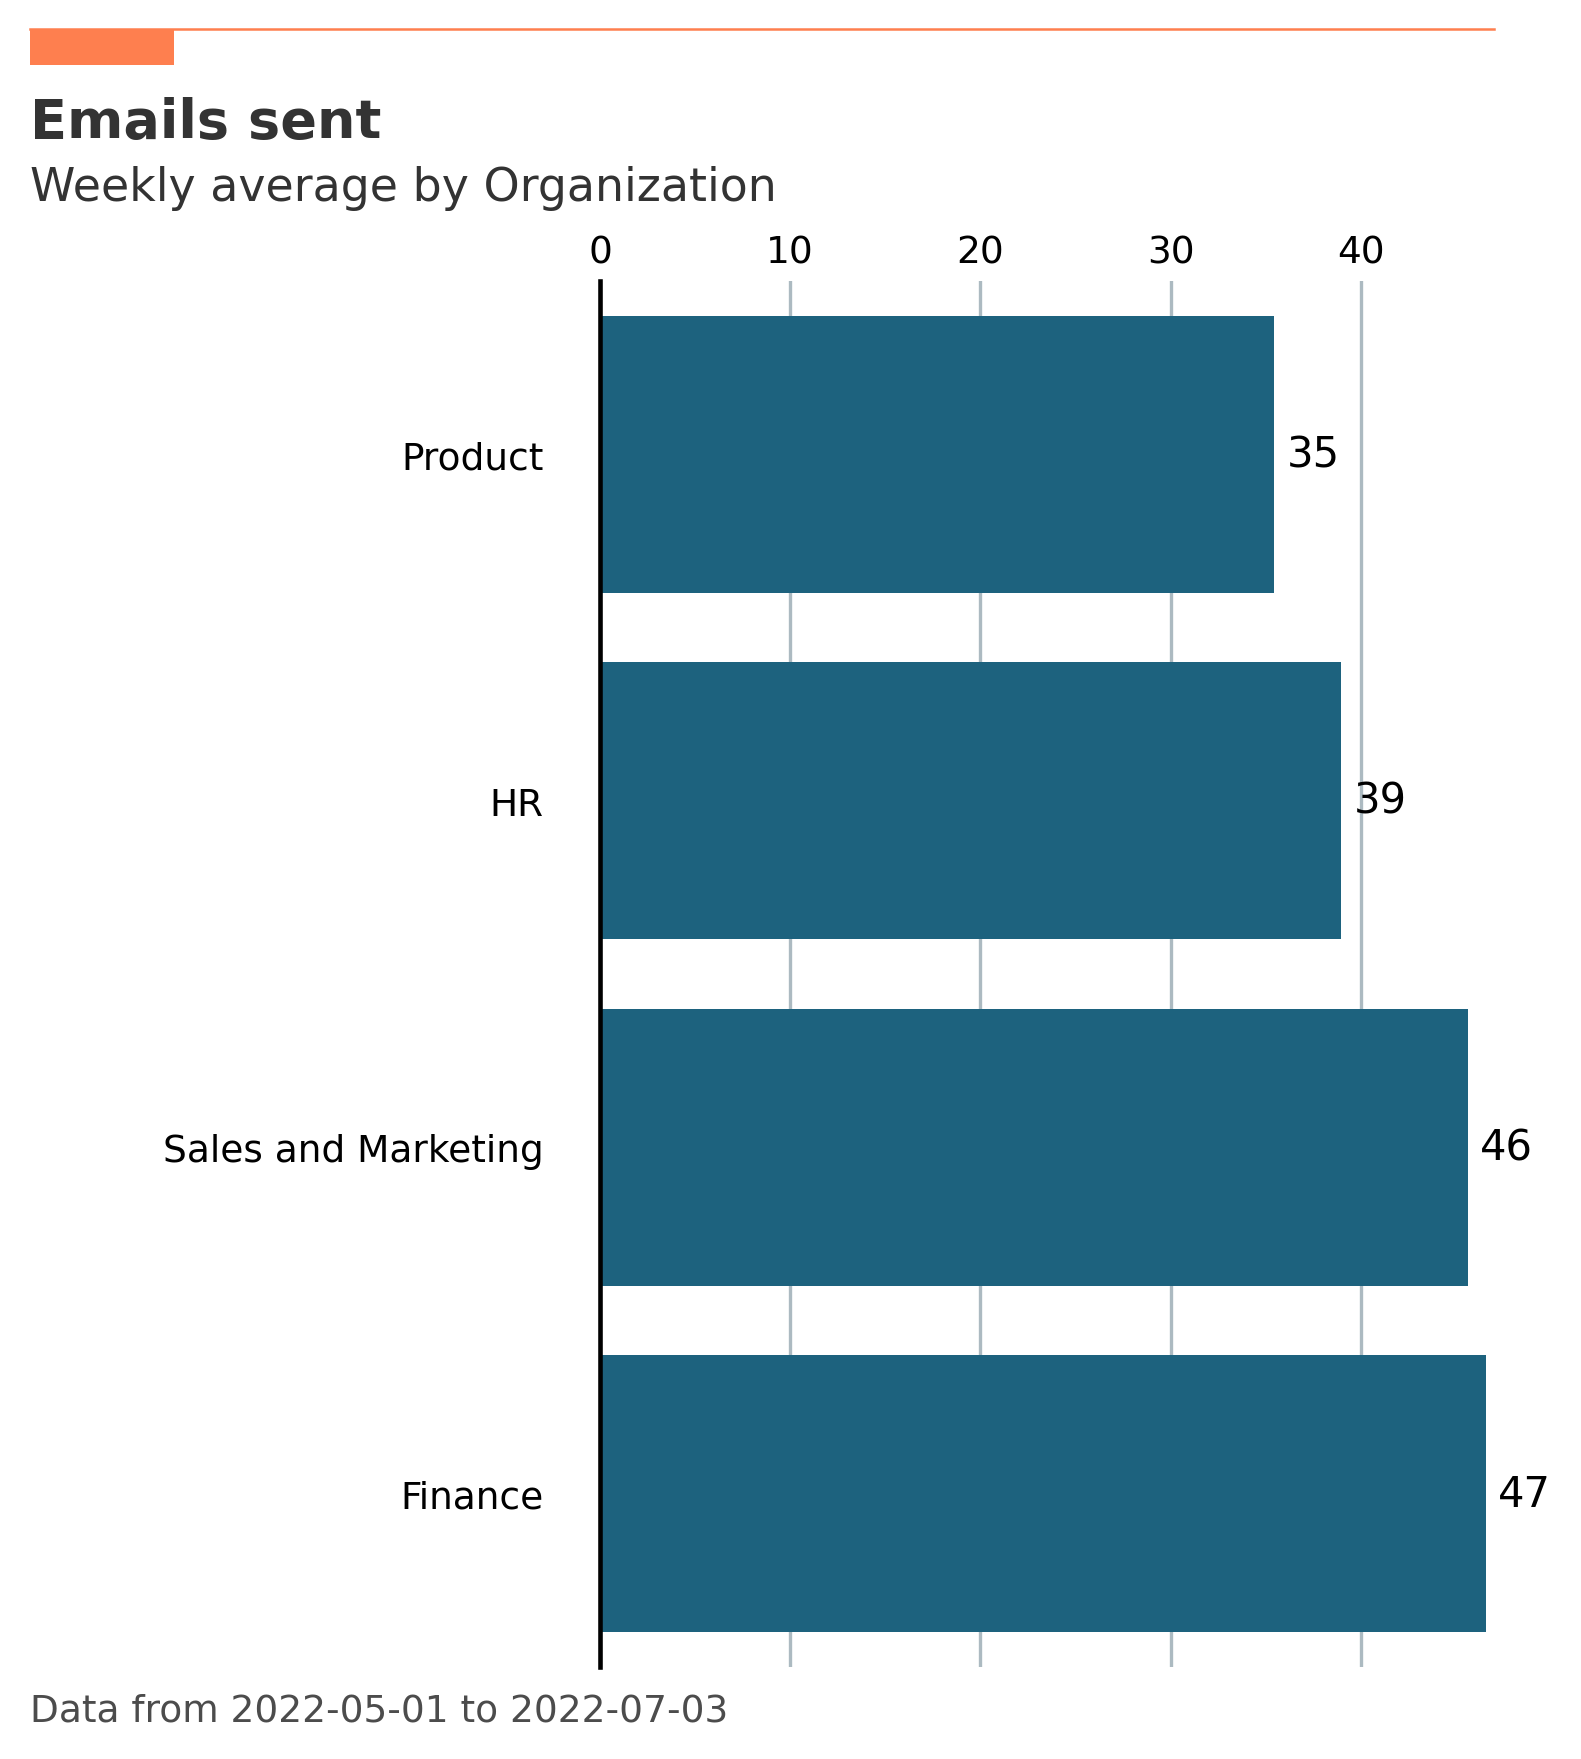
# Create a bar chart of average metrics by group
vi.create_bar(data=pq_data, metric='Emails_sent', hrvar='Organization', mingroup=5)
Most functions accept a return_type argument to switch between a plot ('plot') and a summary table ('table') as a Pandas DataFrame. Use vi.export() to save outputs to clipboard or to a local file.
For a comprehensive walkthrough — including trend analysis, ranking, network visualization, and more — see the demo notebook.
Visualization Gallery
create_rank():
create_bar():
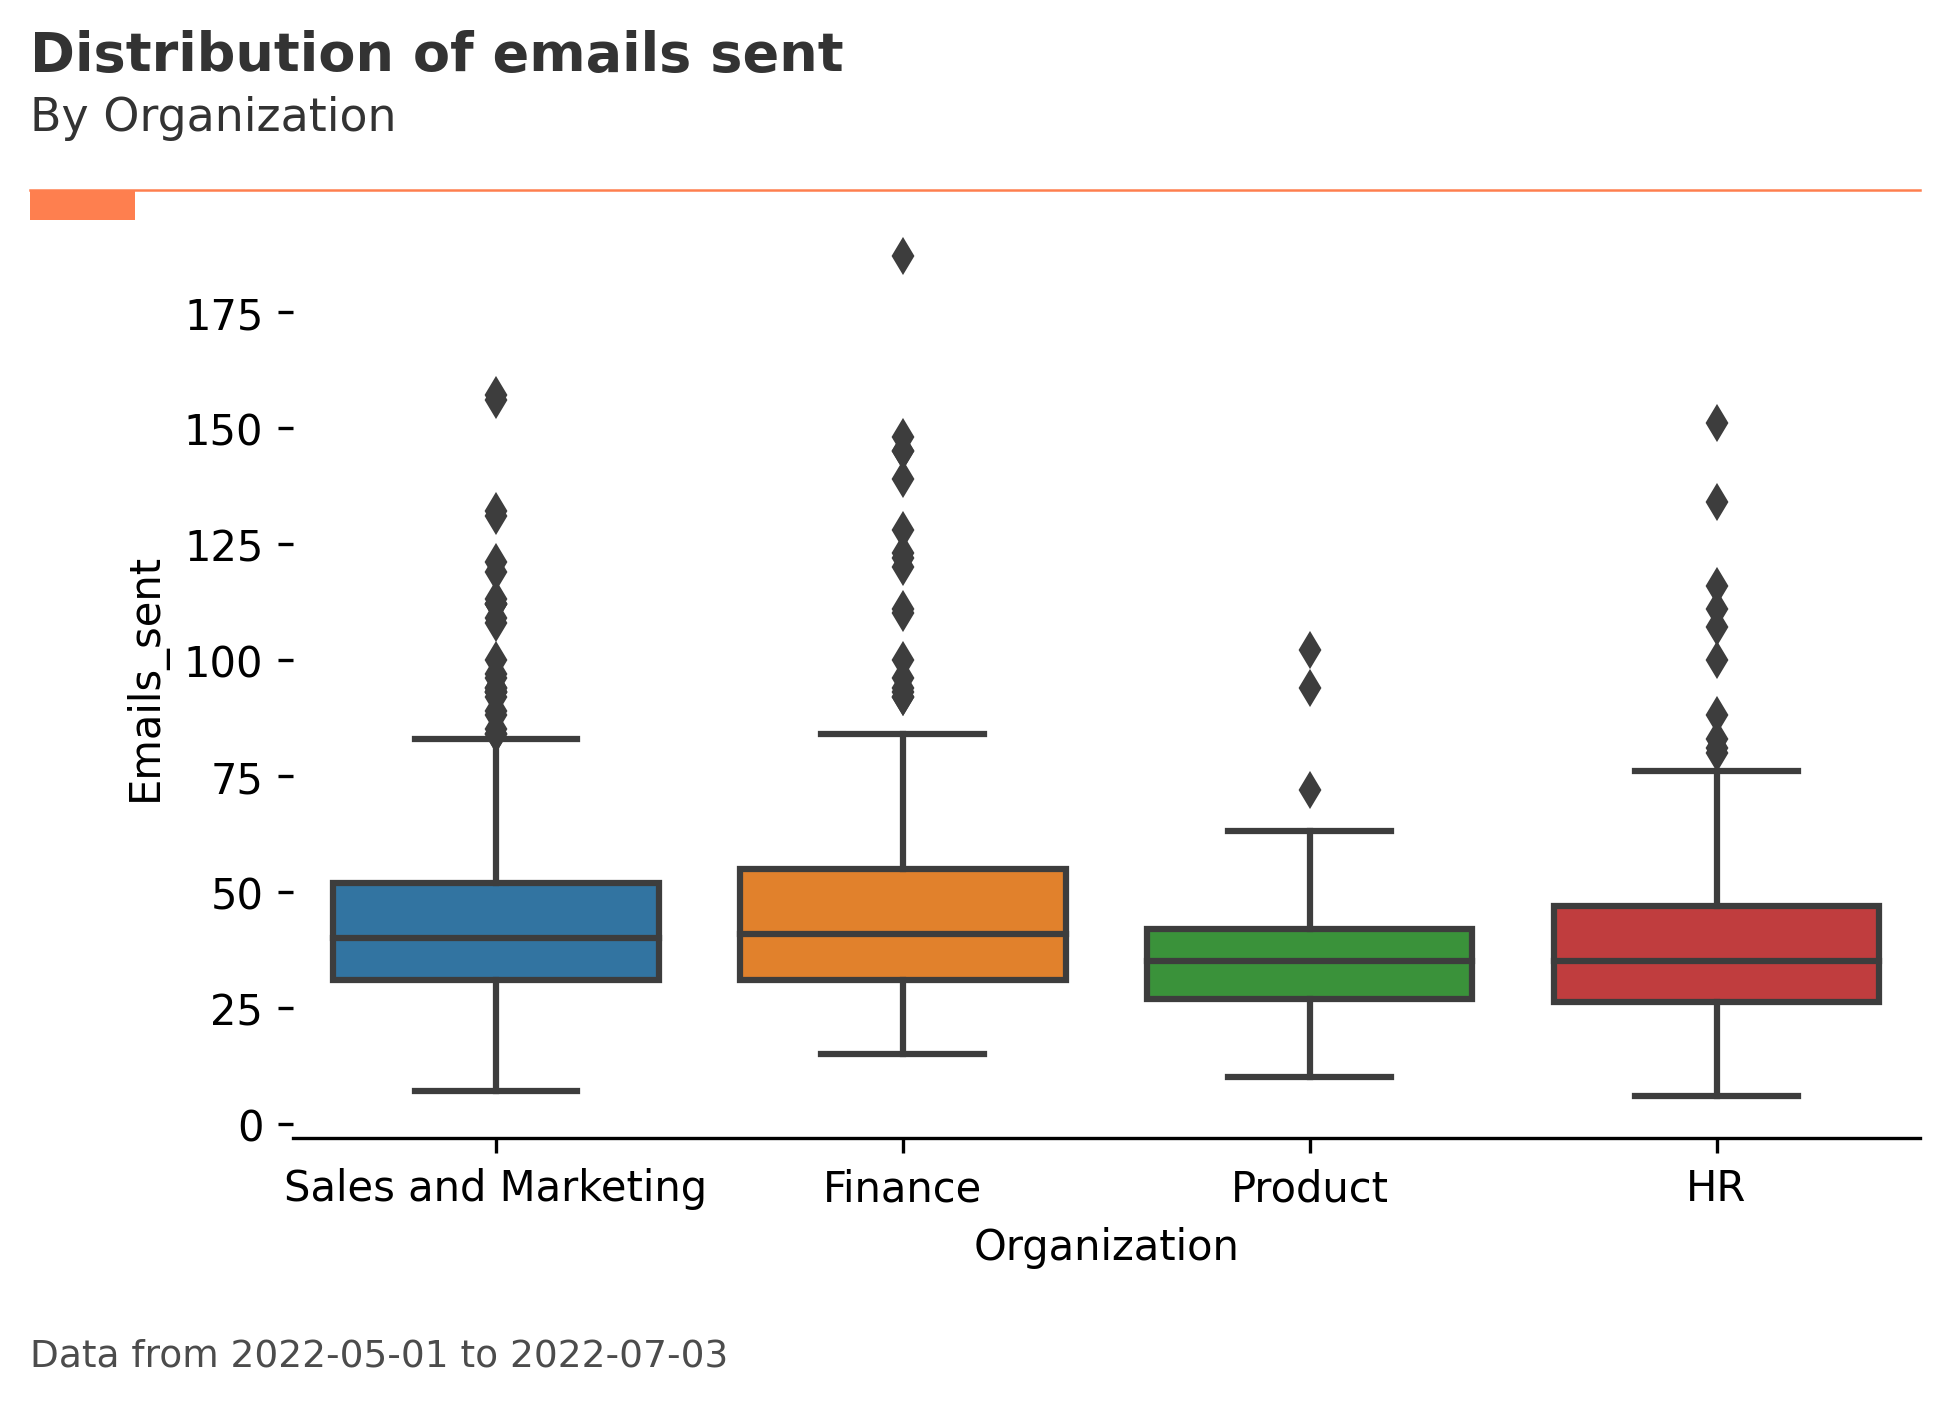
create_boxplot():
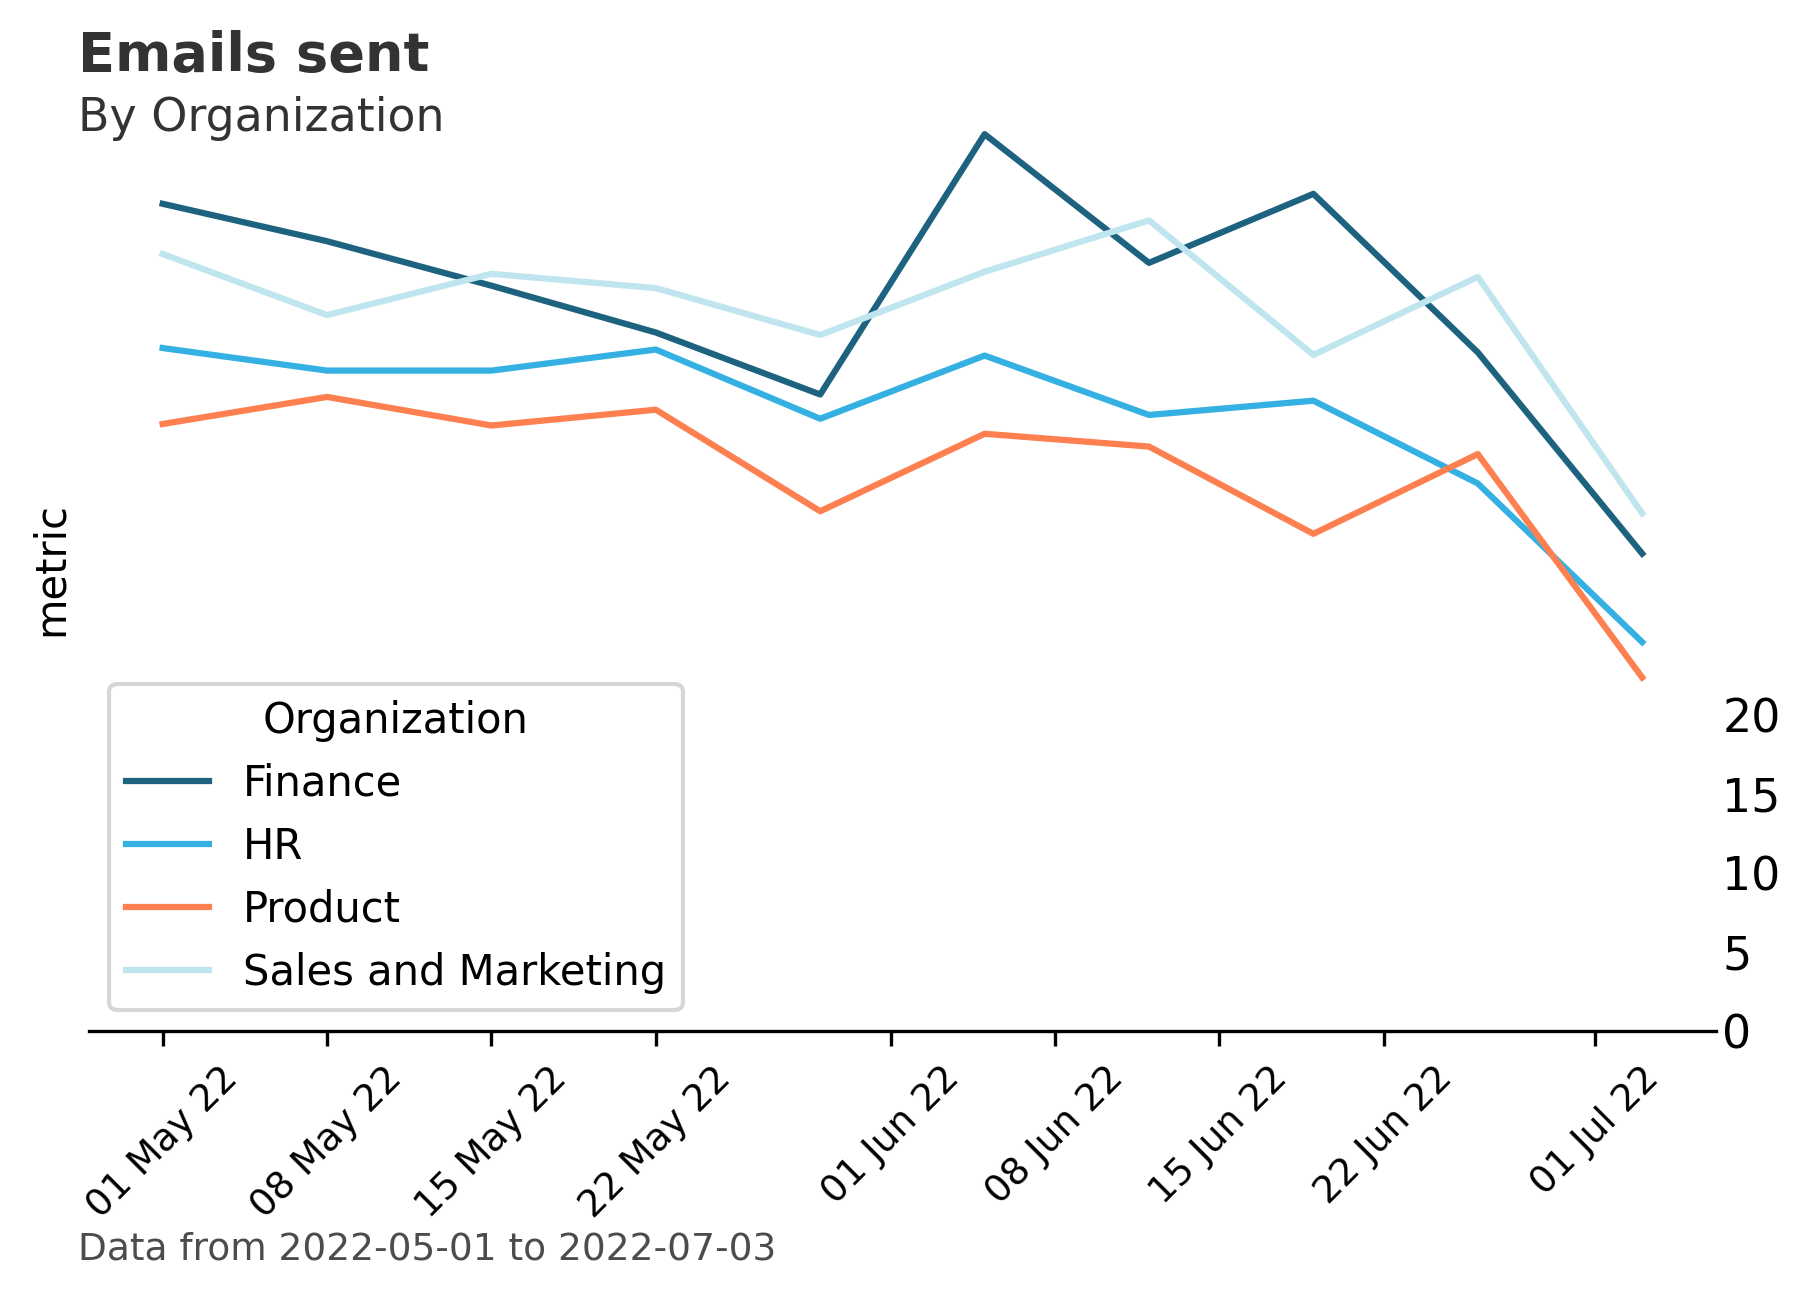
create_line():
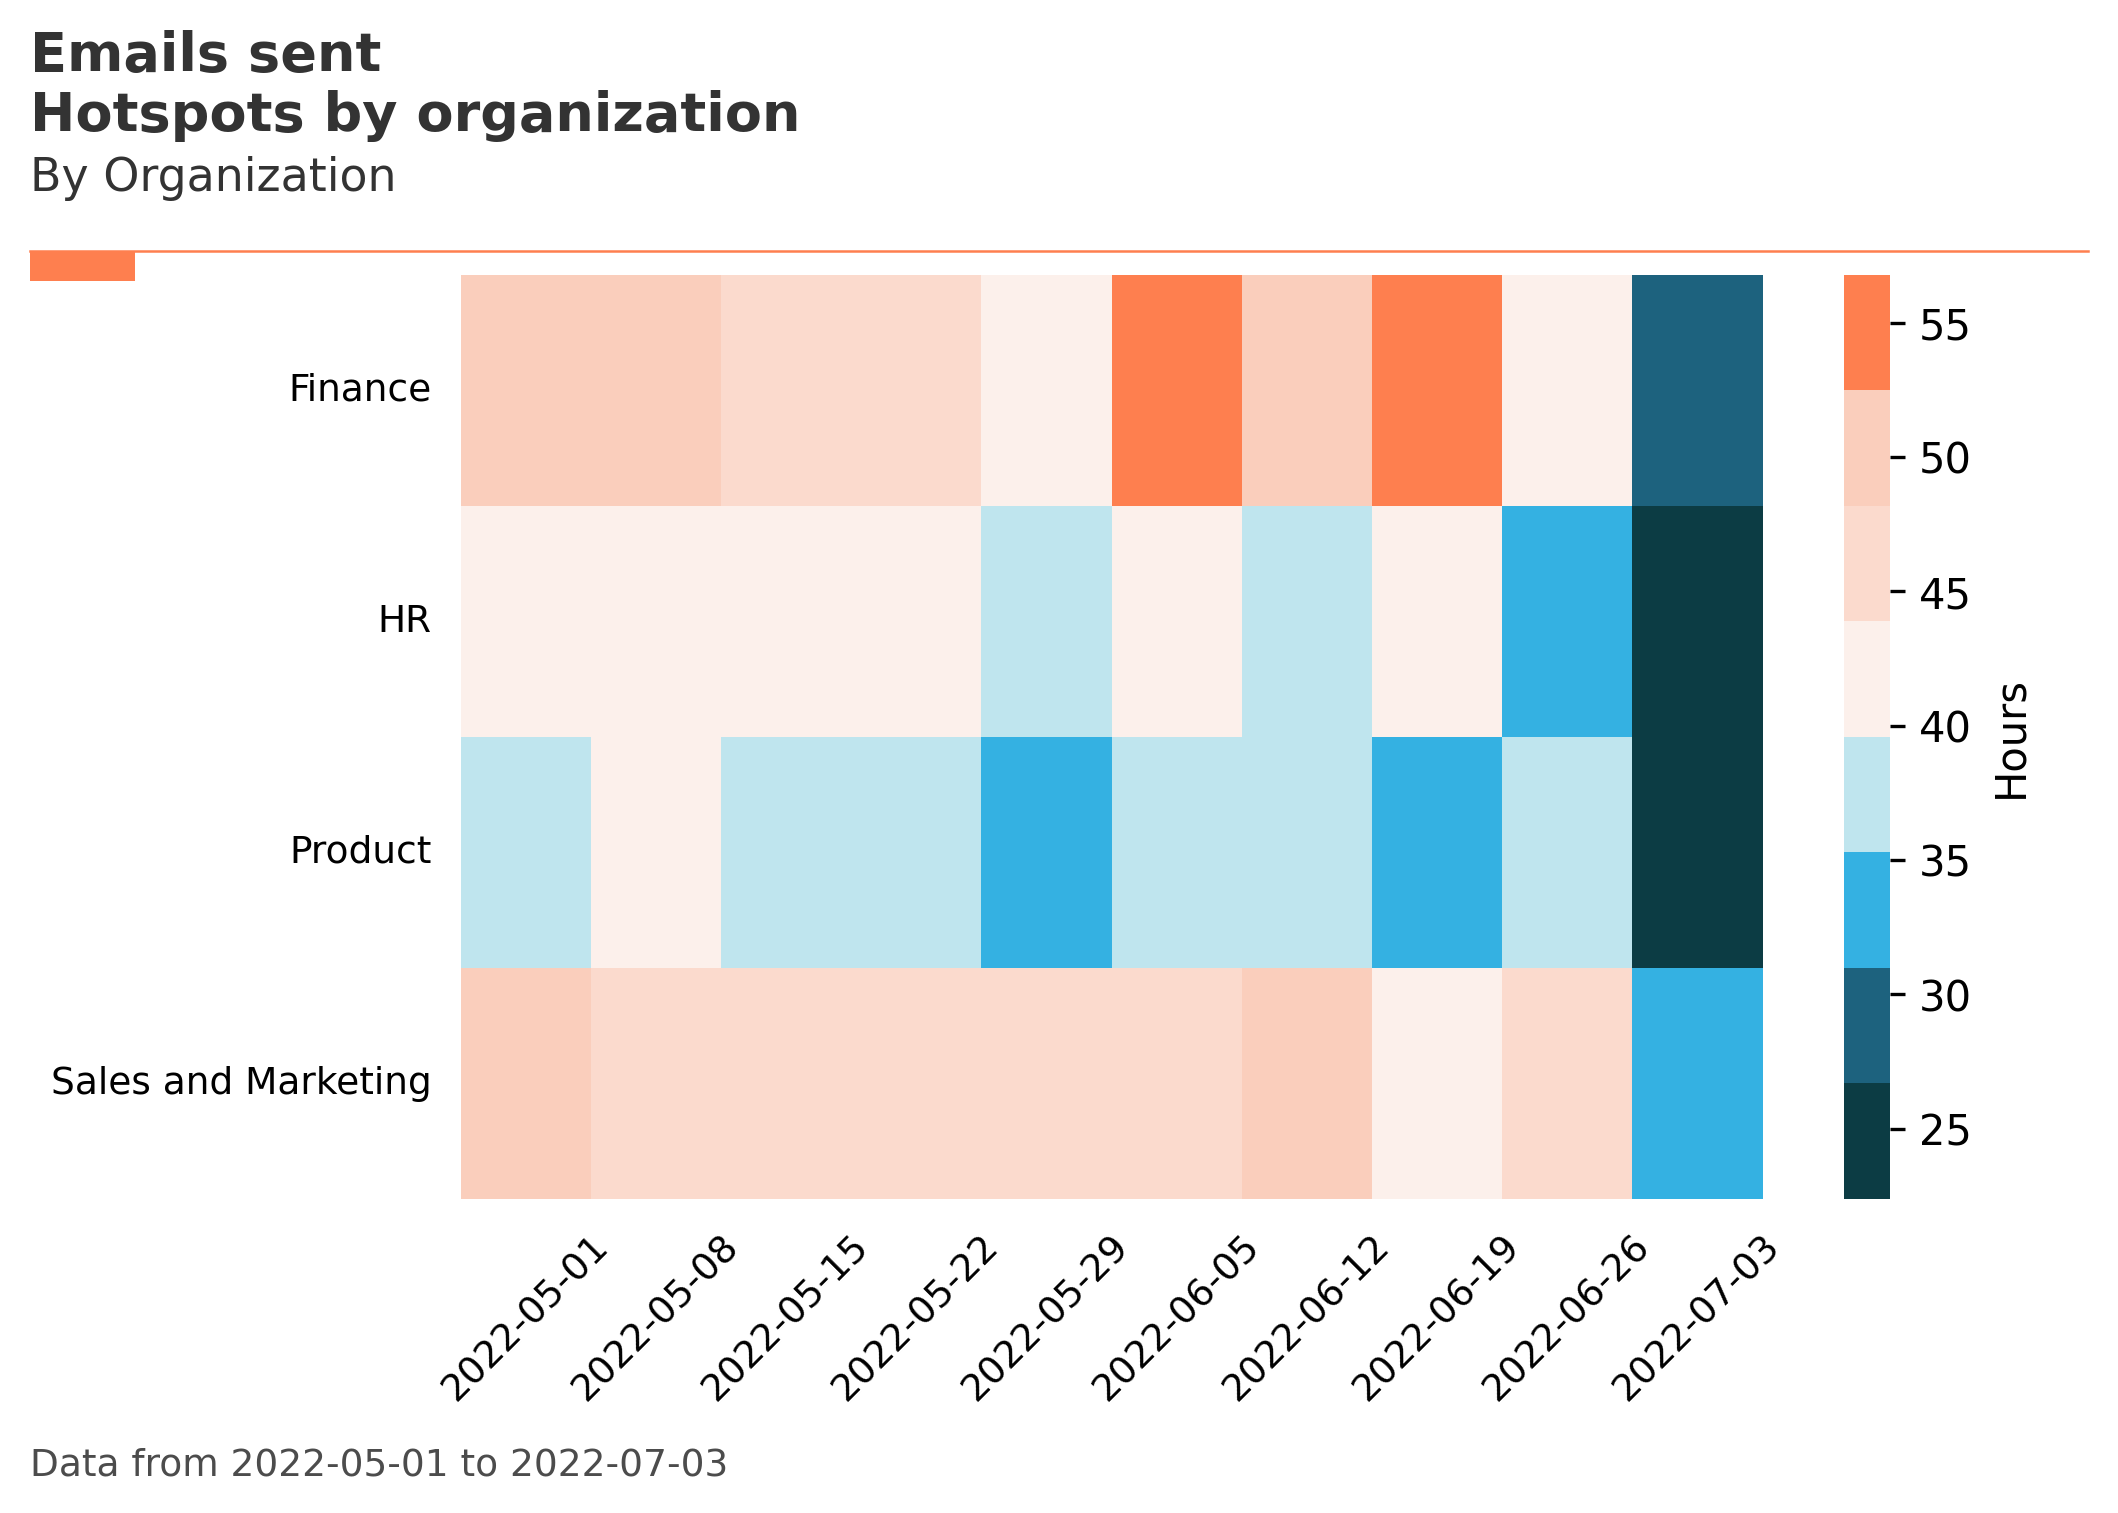
create_trend():
Contributing
This project welcomes contributions and suggestions. For feature and complex bug fix contributions, it is recommended that you first discuss the proposed change with vivainsight’s maintainers before submitting the pull request. Most contributions require you to agree to a Contributor License Agreement (CLA) declaring that you have the right to, and actually do, grant us the rights to use your contribution. For details, visit https://cla.microsoft.com.
When you submit a pull request, a CLA-bot will automatically determine whether you need to provide a CLA and decorate the PR appropriately (e.g., label, comment). Simply follow the instructions provided by the bot. You will only need to do this once across all repos using our CLA.
This project has adopted the Microsoft Open Source Code of Conduct. For more information see the Code of Conduct FAQ or contact opencode@microsoft.com with any additional questions or comments.
License
This library is licensed under the MIT License. For more information, please see the LICENSE file.