COVID Paper Exploration Workshop
This workshop explores the use of Azure Text Analytics and Text Analytics for Health to get some insights from a large corpus of COVID medical papers.
| Project Goal | Learn how to use AI Text Analytics to extract meaningful visual insights from text |
|---|---|
| What will you learn | How to use Azure Text Analytics Cognitive Service, How to process tabular data in Python using Pandas and visualize them using different visualization techniques |
| What you’ll need | Azure Subscription, ability to run Jupyter Notebooks |
| Duration | 1-1.5 hours |
| Just want to try the app or see the solution? | COVIDPaperExploration.ipynb |
| Slides | Powerpoint, SpeakerDeck |
| Author | Dmitry Soshnikov |
This workshop is based on the following publication: arXiv:2110.15453. You can also refer to this blog post for an overview of a larger paper exploration project.
🎥 Watch Microsoft Student Ambassadors give this workshop!
Video walk-through
🎥 Click this image to watch Dmitry walk you through the workshop
What students will learn
In this project, you will automatically process texts of COVID-related scientific papers to draw some meaningful visual insights, such as:
- Which medications are mostly discussed and why
- How strategies of COVID treatment changed over time
- How symptoms are related to different diagnoses
- Which medications are often used together
Prerequisites
For this workshop:
- You need to have an Azure Account. You may have one from your university, otherwise get Azure for Students, GitHub Student Developer Pack or an Azure Free Trial.
Learn more about creating an Azure Account at Microsoft Learn
- You need to be able to run Jupyter Notebooks. Read more on different options in this blog post:
- Install Python locally and use Visual Studio Code with Python extension
- Use GitHub Codespaces
Jupyter Notebooks offer a great way to combine Python code together with text and visualizations, creating executable documents. You can work with Jupyter Notebook either through the browser, or via tools such as Visual Studio Code. To be able to run code, you need to have a Python environment installed, either on your local computer, or in the cloud.
Milestone 1: Getting the Dataset
Let’s begin by getting a dataset of COVID medical papers. You need to replace the data/metadata.csv sample file with the full version of the dataset from Kaggle.
Read more about this process here. You may need to register on Kaggle.com, but that will be useful for your future career.
Milestone 2: Running Jupyter and Exploring the Data
After you get the data, you need to open COVIDPaperExploration.ipynb or COVIDPaperExplorationDetailed.ipynb notebook and start writing code there, following the instructions inside the notebook.
Note: There are two versions of the notebooks provided, and you can chose the one most suitable to you:
- COVIDPaperExploration.ipynb contains only brief descriptions of milestones, and you have the freedom to write most of the code yourself
- COVIDPaperExplorationDetailed.ipynb contains more detailed instructions, and you need to fill in the most important parts of the code, but the overall flow is created for you.
There is also a notebook with the solution, which you can consult should you experience a problem you are not able to solve. However, we suggest you to try and solve all the problems yourself, using stack overflow as a reference to find solutions.
Different options to run Jupyter Notebooks are described in this blog post.
As a result of this step, you should get all the paper data loaded into a Pandas DataFrame, and filter out only those papers that were published after January 2020. You may plot a histogram of publication frequencies:
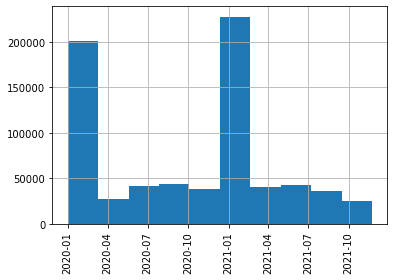
| Pandas is a very frequently used Python library to manipulate tabular data. You can read more about using Pandas for data processing in our Data Science for Beginners Curriculum. |
Milestone 3: Creating and Using Text Analytics Endpoint
At this point, you should have your Azure subscription ready. Start by logging into the Azure Portal.
Then, create an Azure Cognitive Service for Language cloud resource. You can start creating the resource by clicking HERE - it will take you to the corresponding page on the Azure Portal.
Make sure to select S - Standard pricing tier, because Health Analytics is not available under the Free Tier.
Once you have created the resource, you should go to the portal and copy Endpoint URL and Access key into the notebook:
endpoint = 'https://myservice.cognitiveservices.azure.com/'
key = '123456789123456789012345678901'
Numbers here are fictional, you need to substitute them with actual values from a resource in your subscription for the code to work!
To call the service, we first create the endpoint:
from azure.core.credentials import AzureKeyCredential
from azure.ai.textanalytics import TextAnalyticsClient

text_analytics_client = TextAnalyticsClient(
    endpoint=endpoint,
    credential=AzureKeyCredential(key))
And then we can call the service, passing batches of up to 10 documents at a time:
inp = [document_1,document_2,...]
poller = text_analytics_client.begin_analyze_healthcare_entities(inp)
res = list(poller.result())
After this step, you should be able to process a bunch of abstracts and produce the list of entities with corresponding types, like this:
Dexmedetomidine (MedicationName)
improve (Course)
organ dysfunction (SymptomOrSign)
critically (ConditionQualifier)
ill (Diagnosis)
randomized controlled trial (AdministrativeEvent)
Dexmedetomidine (MedicationName)
Sepsis (Diagnosis)
...
Milestone 4: Processing Abstracts
Now it’s time to go big and process abstracts at scale! However, because we are limited in time, and we do not want to waste your cloud resources, we will process only a limited number of random abstracts (say, 200-500).
Keep in mind that some abstracts are not present (they will have ‘NaN’ ) in the corresponding abstract field.
It is important to select abstracts randomly, because later on we will want to explore the change is treatment tactics over time, and we need to have uniform paper representation across all time period. Alternatively, to further minimize time/spend, you can select a time sub-interval (say, only year 2020), and then process random papers in that interval.
Spend some time thinking about the way you will store the result of processing. You can add processing results as additional columns to the DataFrame, or you can use separate list/dictionary.
You want to make sure that for each paper you keep essential info such as title and publication time, together with all entities and relations.
Processing can take quite a long time. You may start (and proceed until the end of the workshop) with small sample size (~50 papers) to make sure your code works and your data structure is right, and then increase the sample size to 200-500 towards the end to obtain the results.
If you are really short on time, you can skip this step and load the results of processing random 500 papers from
data\processed.pkl.bz2file using the following code:
import pickle, bz2

with bz2.BZ2File('data\processed.pkl.bz2','r') as f:
    store = pickle.load(f)
Milestone 5: Get Top Symptoms, Medications and Diagnoses
Now it is time to process our raw data and get some insights! Let’s start by grouping entities together by their ontology ID (UMLS ID) and seeing which are the top mentions in different categories. As a result, you should build a table similar to the following:
| UMLS ID | Name | Category | Count |
|---|---|---|---|
| C0020336 | hydroxychloroquine | MedicationName | 99 |
| C0008269 | chloroquine | MedicationName | 43 |
| C0939237 | lopinavir + ritonavir | MedicationName | 28 |
| … | … | … | … |
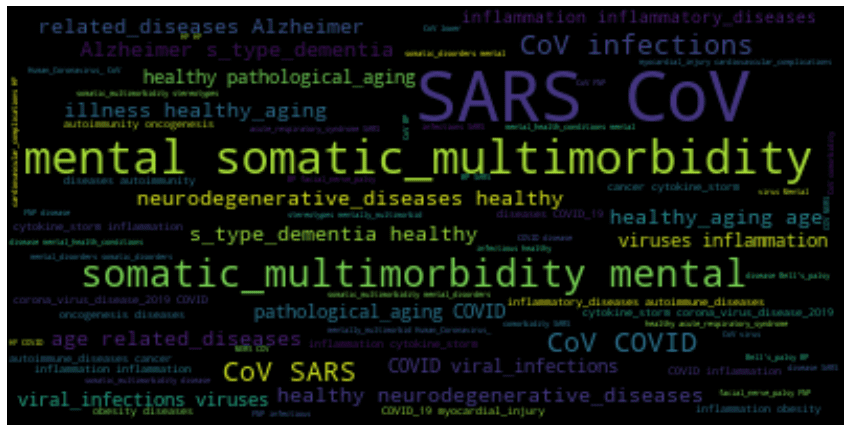
You can also build a word cloud of diagnoses, symptoms or medications:
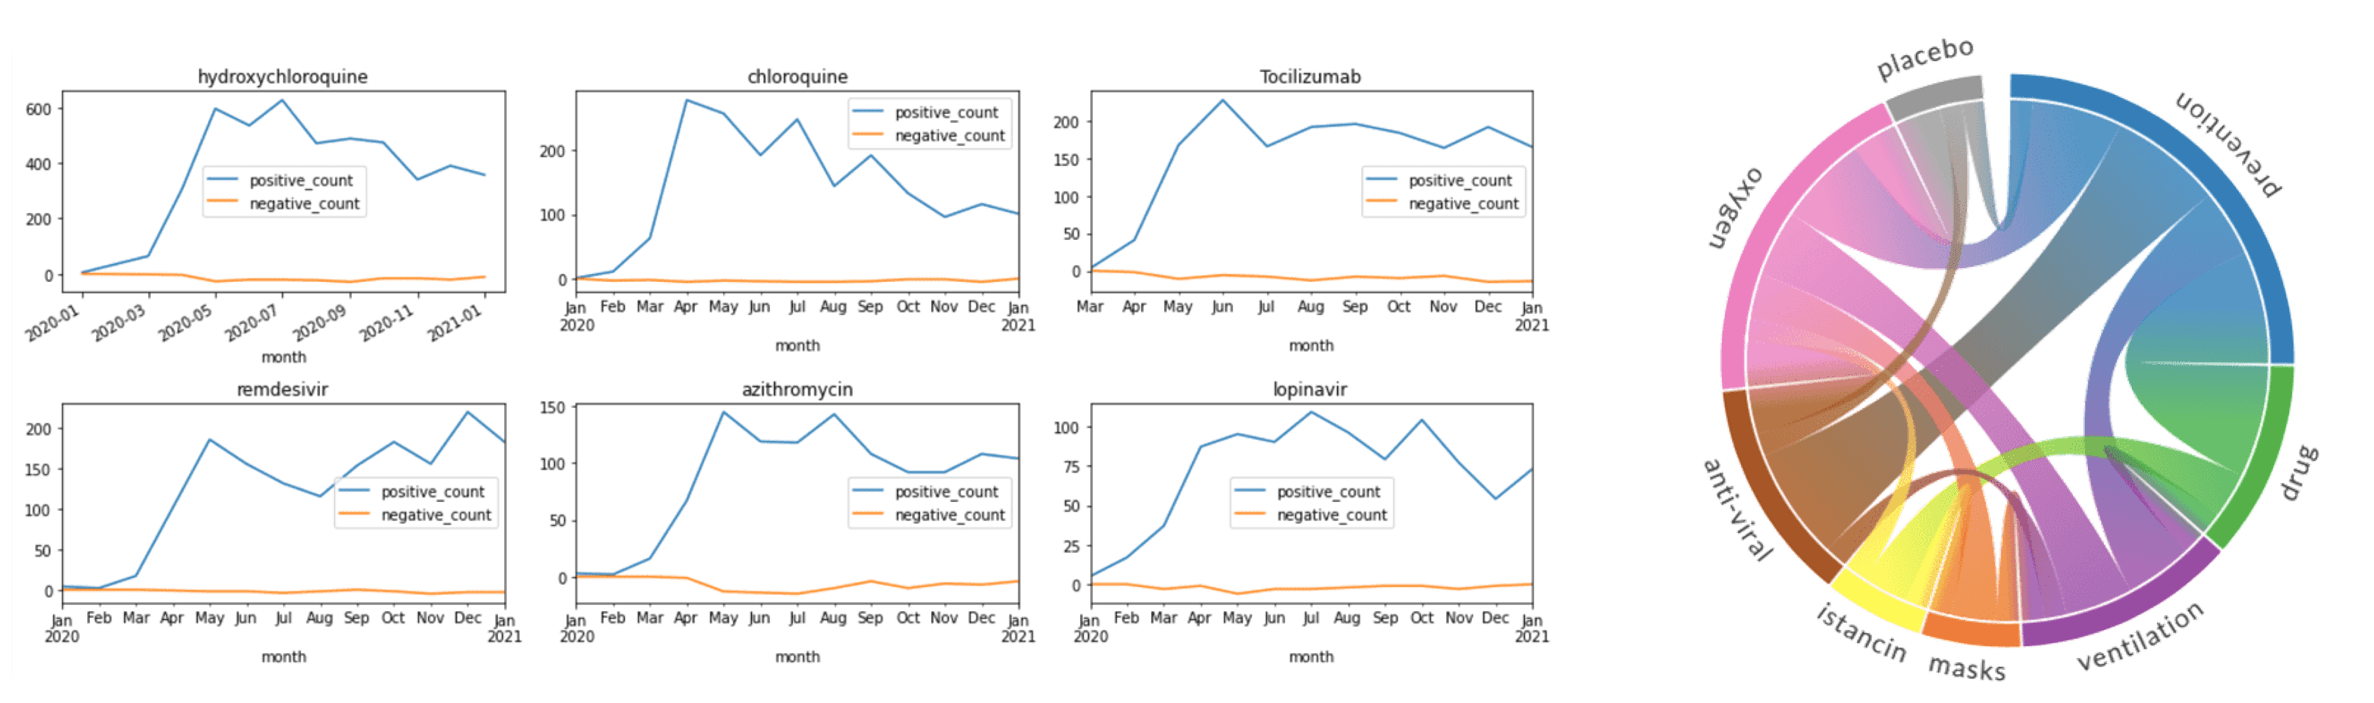
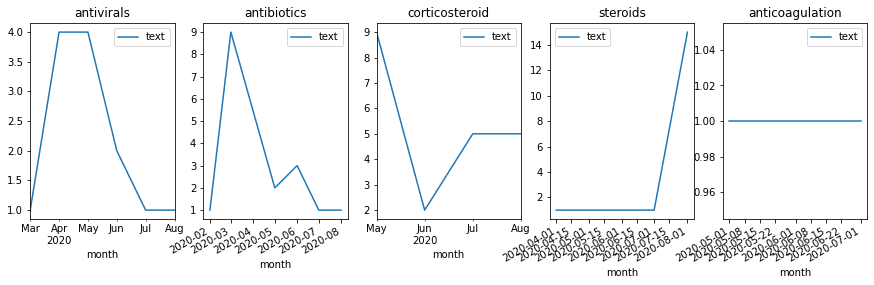
Milestone 6: Visualize Change in Treatment Strategies
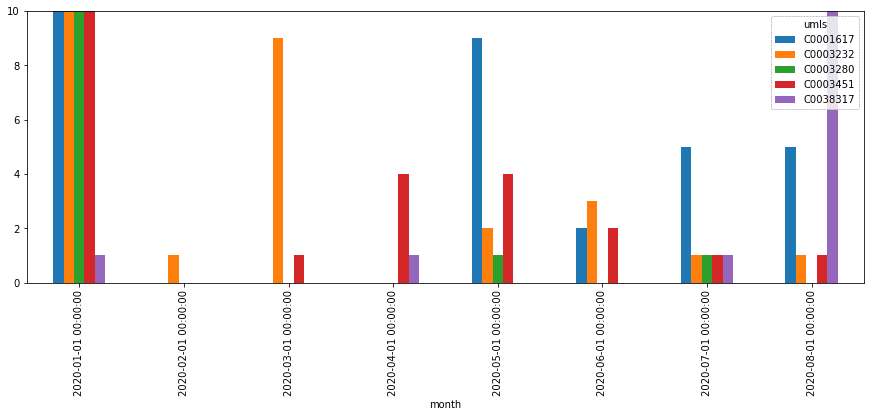
In addition to calculating the total count of mentions, you can see how they are distributed by month, and thus detect changes in treatment strategies. Select top medications/strategies and compute the distribution of their mentions by months (or weeks). First, get the list of top-5 UMLS IDs for medications and medication classes (AKA treatment strategies), and then use only those classes to plot graphs similar to the following:
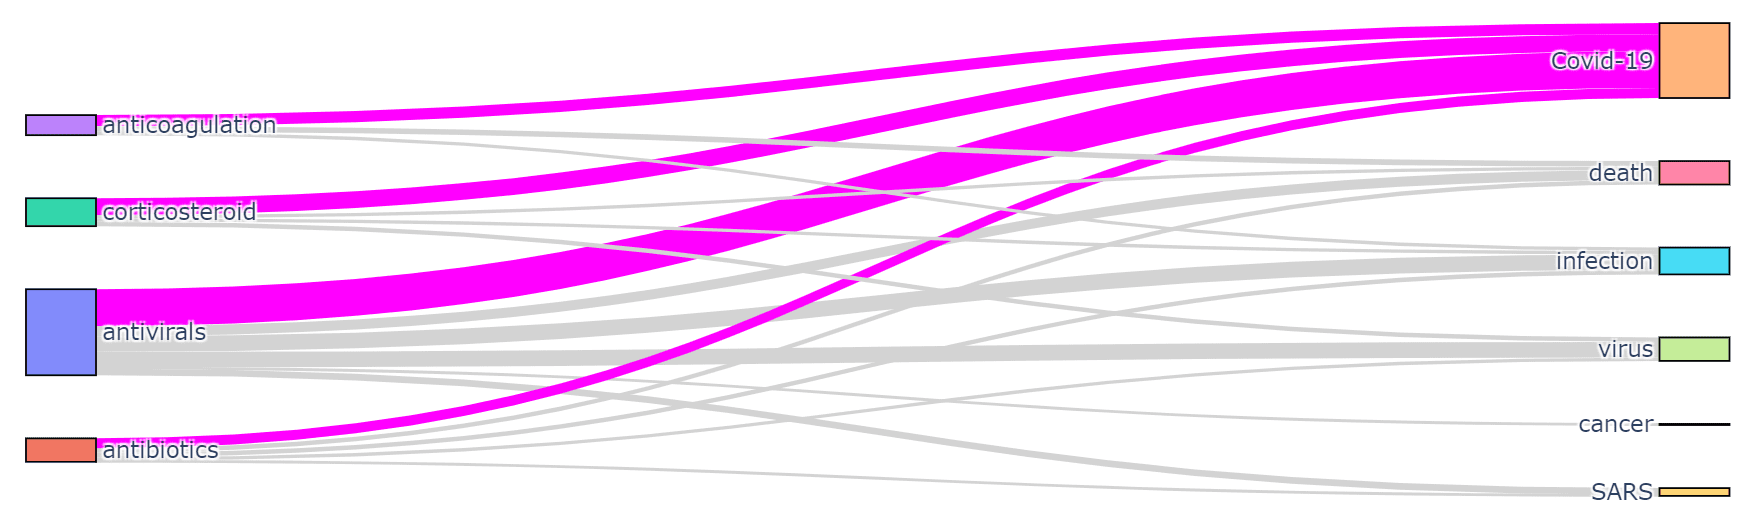
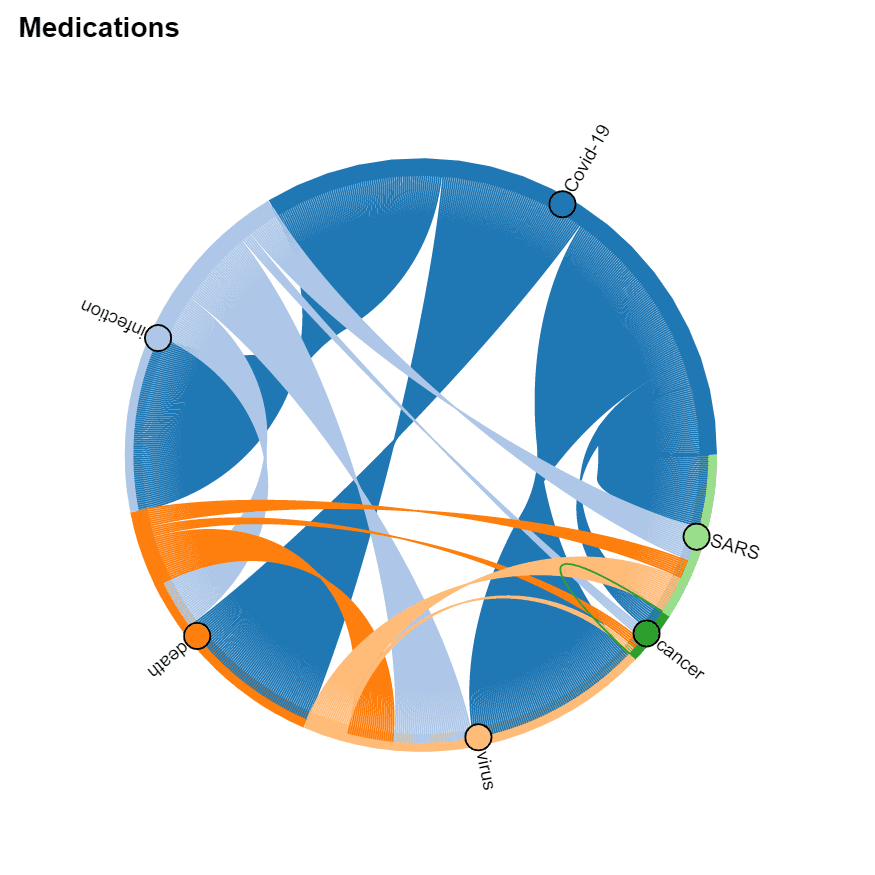
Milestone 7: Visualize Co-occurrence of Terms
It is interesting to see which terms occur together within one paper, because it can give us an idea about relationships between, for example, diagnoses and medications, or symptoms and treatments. You should also be able to see which medications are often used together, and which symptoms occur together.
You can use two types of diagrams for that:
- Sankey diagram allows us to investigate relations between two types of terms, eg. diagnosis and treatment
- Chord diagram helps to visualize co-occurrence of terms of the same type (eg. which medications are mentioned together)
To plot both diagrams, we need to compute the co-occurrence matrix, which in the row i and column j contains the number of co-occurrences of terms i and j in the same abstract (one can notice that this matrix is symmetric).
To actually plot the diagrams, we can use the Plotly graphics library. This process is well described here. For the Chord diagram, you can use Holoviews
 |
|  —-|—-
—-|—-
Next steps
If you want to learn more:
- MS Learn Learning Path: Microsoft Azure AI Fundamentals: Explore natural language processing
- Read more about full-scale project on analyzing COVID dataset using CosmosDB/PowerBI/AzureML in this blog post
- If you are planning to use this approach in your research, cite this paper arXiv:2110.15453
Practice
The knowledge extraction that we have performed in this workshop was possible thanks for Text Analytics for Health service, which did most of the job for us. For different knowledge domains, you would need to train your own NER neural network model, and for that you will also need a dataset. The Custom Named Entity Recognition service can help you do that.
However, the Text Analytics Service has some pre-built entity extraction mechanism, as well as keyword extraction. As an additional challenge, experiment with text from a different problem domain, and see if you can extract some meaningful insights from them.
Things you can build:
- Analyze a blog or social network posts and get the idea of different topics that author is writing about. See how interests change over time, as well as the mood. You can use the blog of Scott Hanselman that goes back to 2002.
- Analyze COVID 19 twitter feed to see if you can extract changes in major topics on twitter.
- Analyze your e-mail archive to see how the topics you discuss and your mood change over time. Most e-mail clients allow you to export your e-mails to plain text or CSV format (here is an example for Outloook).
Learn more about text analytics by following this module.
Feedback
Be sure to give feedback about this workshop!