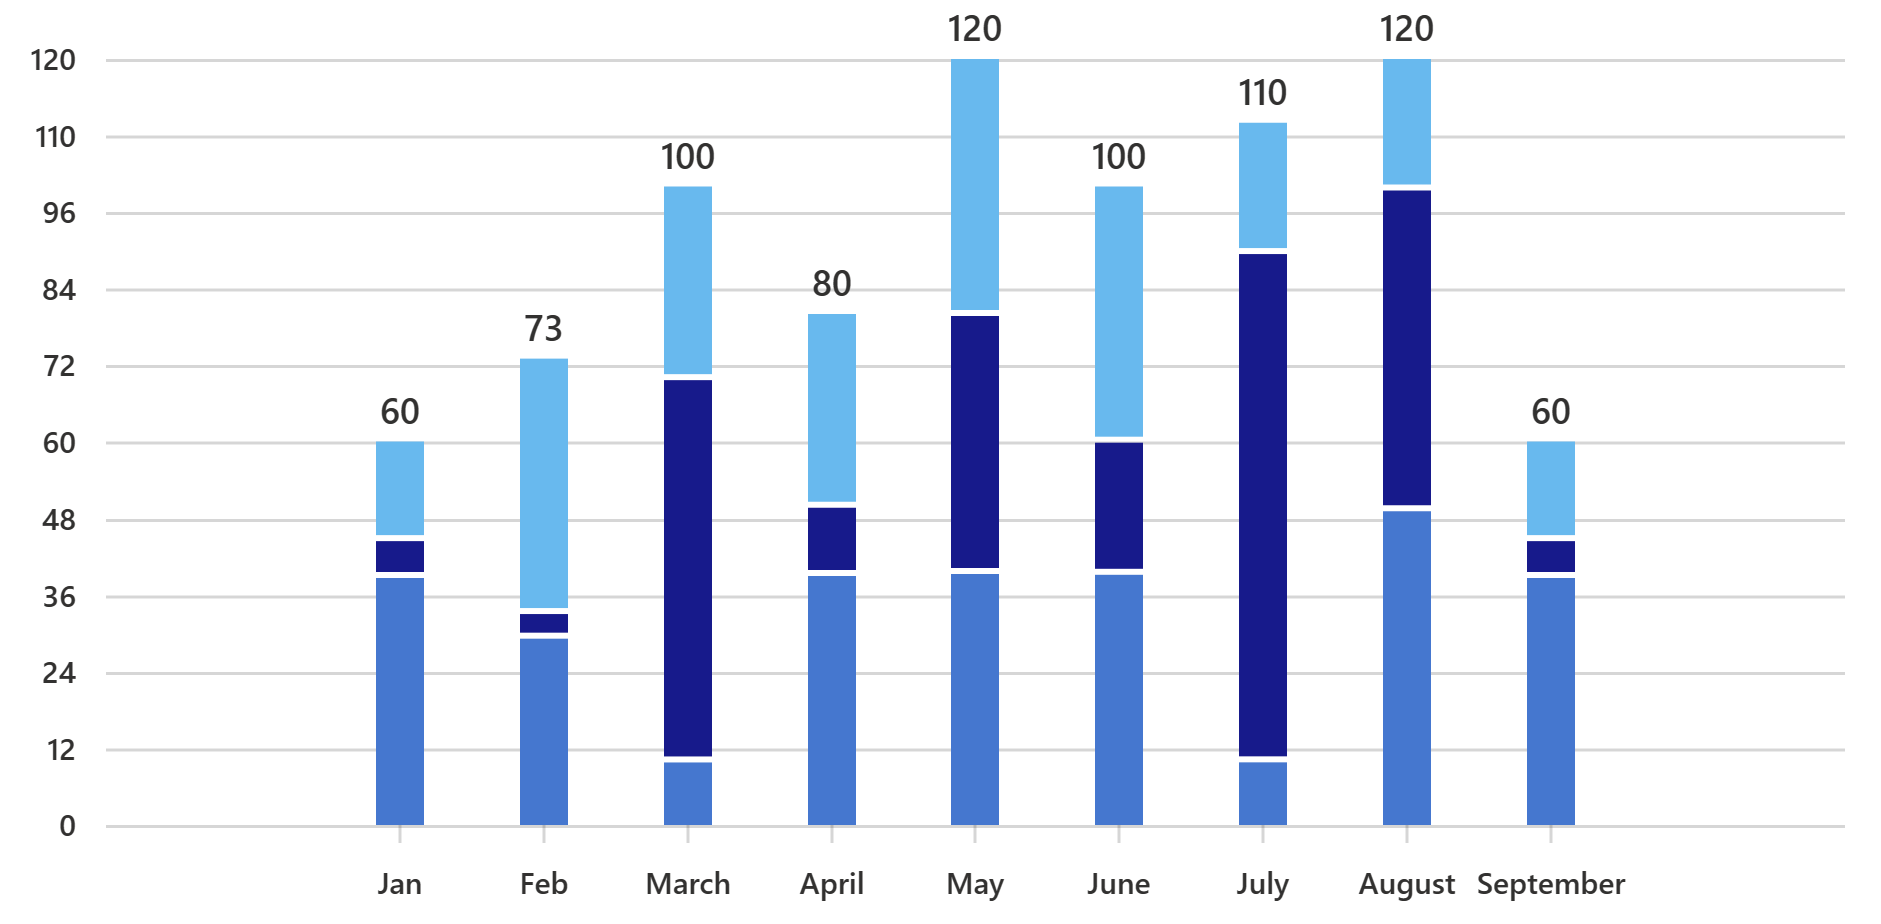
Implementing 2:1 spacing
Discrete Axis
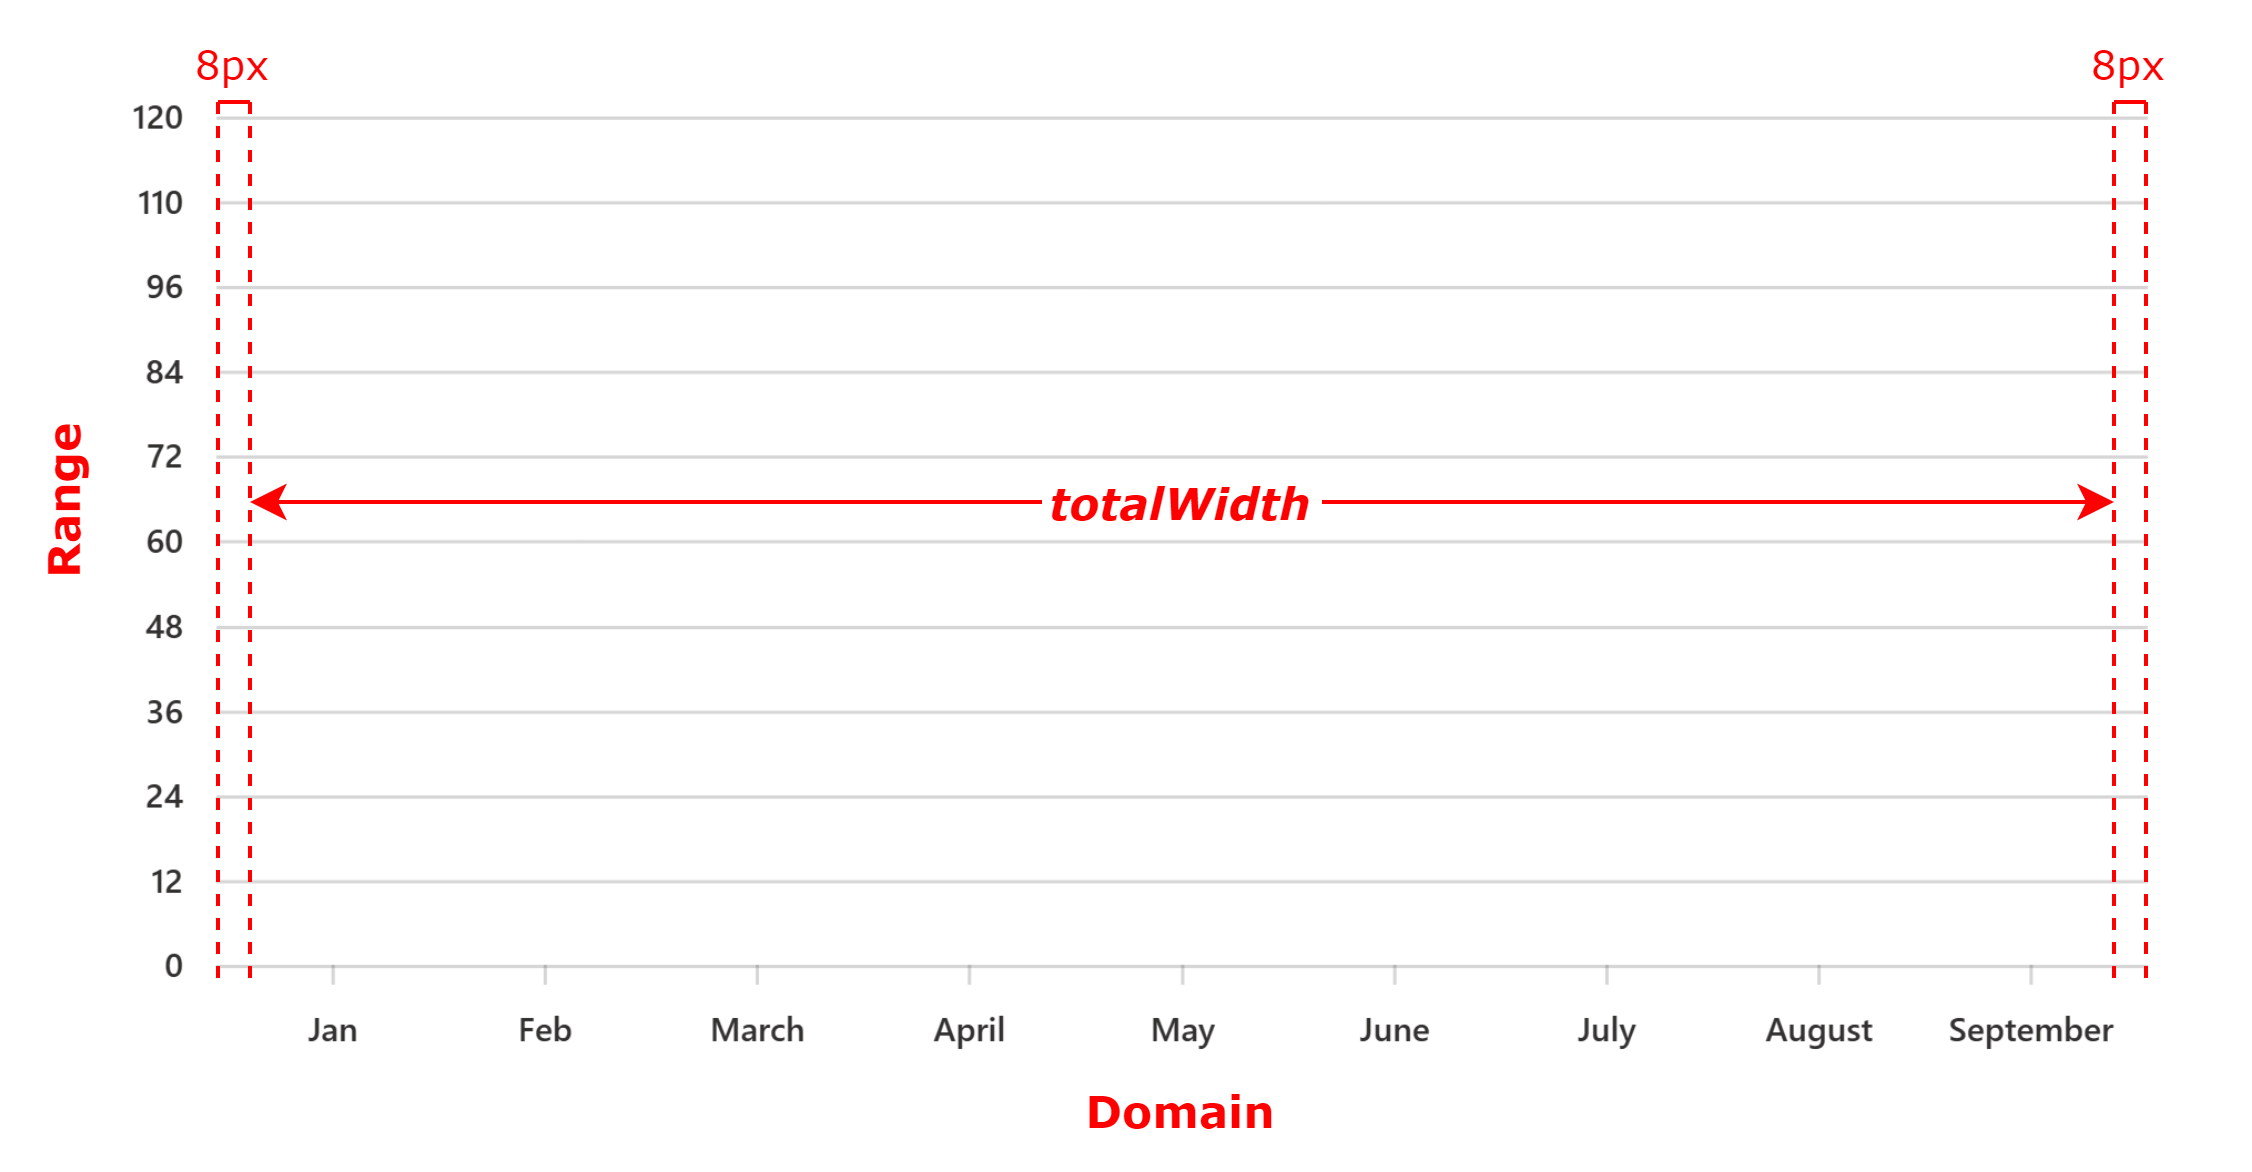
As per design specs, there should be a minimum space of 8px before the first bar and after the last bar of a vertical bar chart. Let’s call this space MIN_DOMAIN_MARGIN.
const MIN_DOMAIN_MARGIN = 8;
The total space available to render the bars:
const totalWidth = containerWidth - (this.margins.left! + MIN_DOMAIN_MARGIN) - (this.margins.right! + MIN_DOMAIN_MARGIN);
where
containerWidth is the total width of the SVG,
margins define the space from the SVG edges that must be excluded before rendering the bars. It helps to prevent the bars from overlapping with the axis labels.
Construct a scale to define the geometry of the bars:
const xBarScale = d3ScaleBand()
    .domain(this._xAxisLabels)
    .range([this.margins.left! + MIN_DOMAIN_MARGIN, containerWidth - this.margins.right! - MIN_DOMAIN_MARGIN])
    .paddingInner(2 / 3);
where
_xAxisLabels is an array of labels in the x-axis,
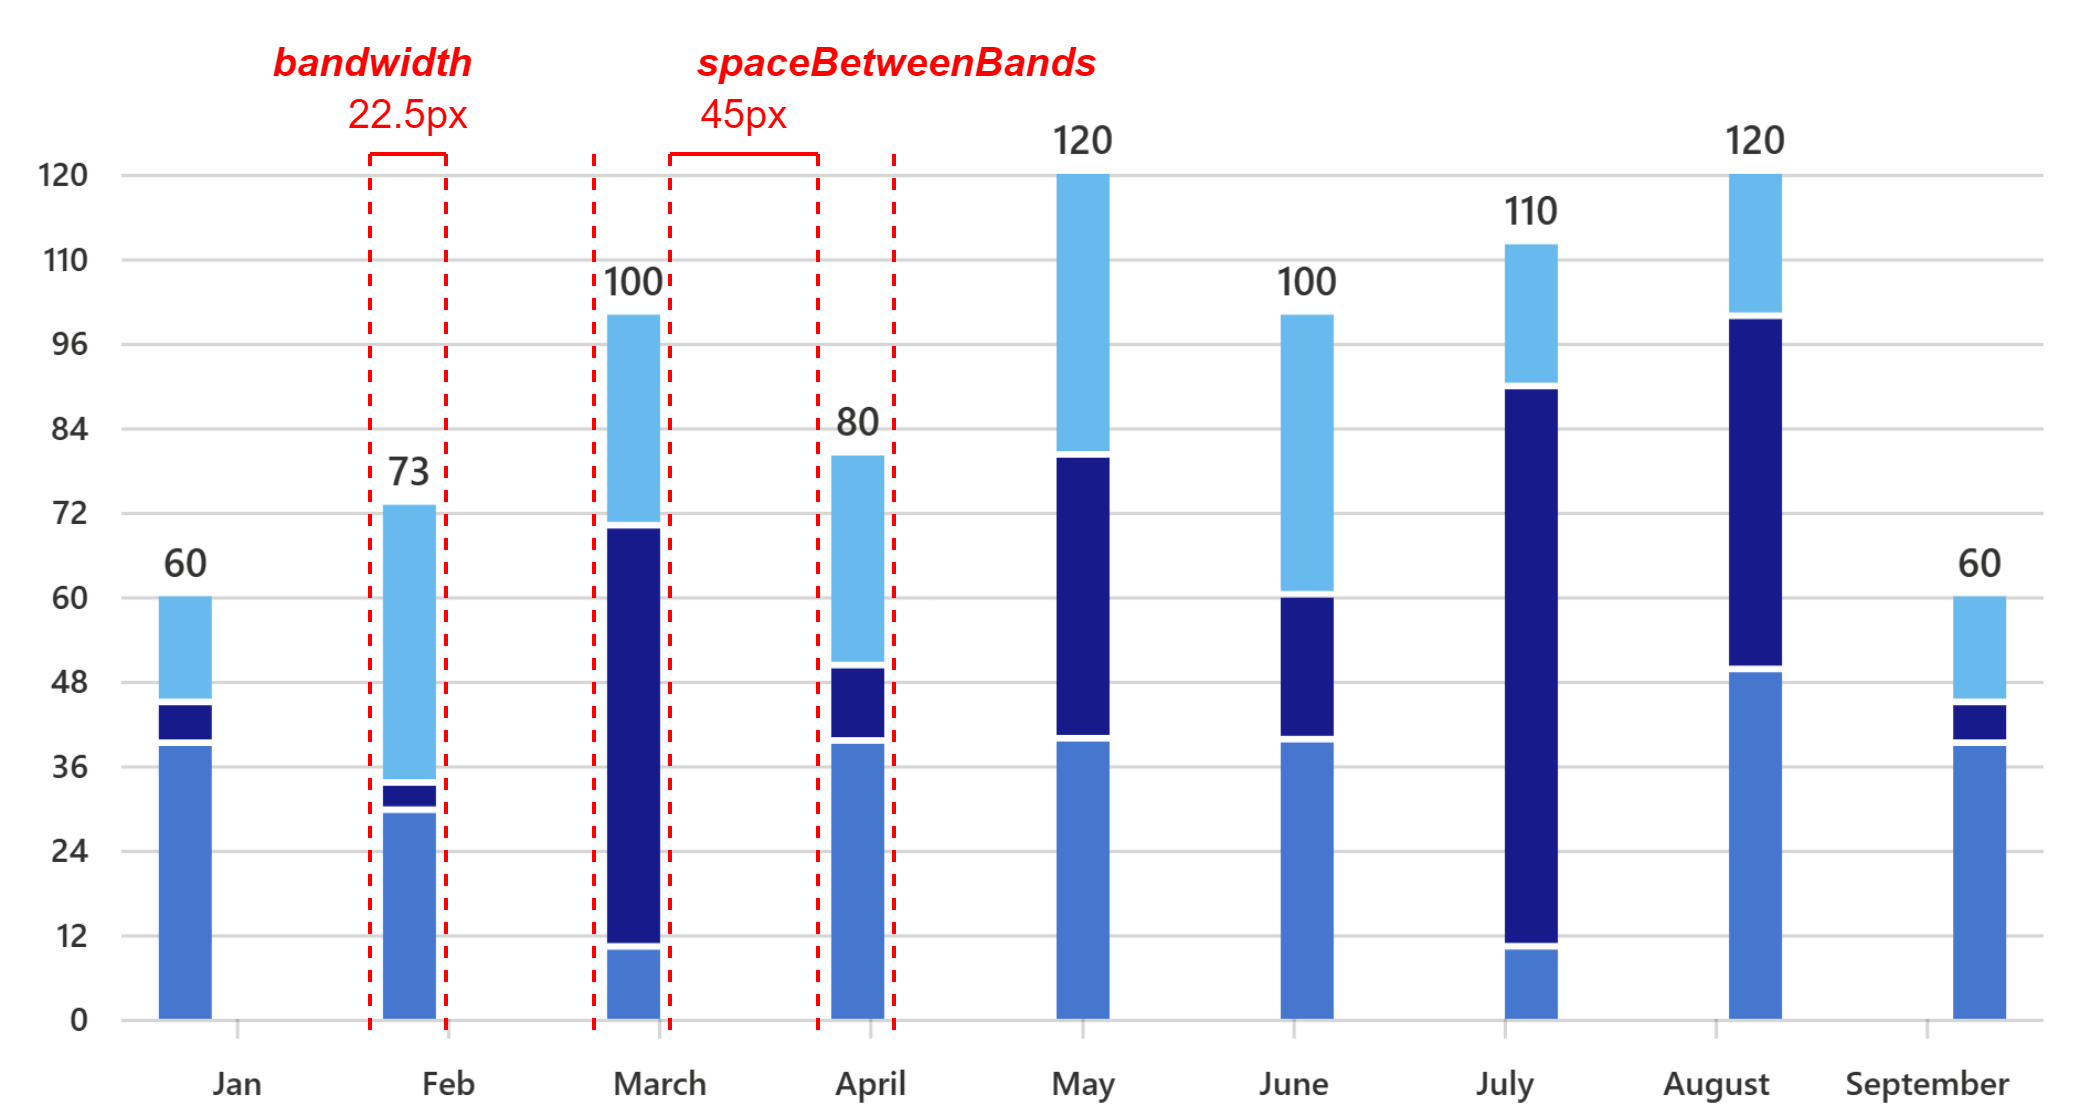
paddingInner is the ratio of the range that is reserved for blank space between bands (bars).
Problem
The bandwidth generated by the scale can be different from the bar width provided by the user.
Solution
As per design specs, the default bar width is 16px. Users can adjust it with values ranging from 1px to 24px.
let barWidth = Math.min(this.props.barWidth || 16, 24);
The total space required to render the bars of provided width with 2:1 spacing:
const reqWidth = this._xAxisLabels.length * barWidth + (this._xAxisLabels.length - 1) * barWidth * 2;
where
_xAxisLabels.length is equal to the maximum number of bars.
this._domainMargin = MIN_DOMAIN_MARGIN;
where
_domainMargin keeps track of the blank space before the first bar and after the last bar.
If more space is available after rendering the bars, center align the chart.
if (totalWidth >= reqWidth) {
    this._domainMargin += (totalWidth - reqWidth) / 2;
}
If more space is required to render the bars of provided width, decrease the bar width to maintain 2:1 spacing.
else {
    const maxBandwidth = totalWidth / (this._xAxisLabels.length + (this._xAxisLabels.length - 1) * 2);
    barWidth = maxBandwidth;
}
where
maxBandwidth is the maximum possible bar width such that the bars can be rendered within the total available space with 2:1 spacing. Derived from the formula for reqWidth.
Make the adjusted bar width available to use everywhere inside the component:
this._barWidth = barWidth;
Update the scale range to take the extra space into account by replacing MIN_DOMAIN_MARGIN with _domainMargin:
const xBarScale = d3ScaleBand()
    .domain(this._xAxisLabels)
    .range([this.margins.left! + this._domainMargin, containerWidth - this.margins.right! - this._domainMargin])
    .paddingInner(2 / 3);
Problem
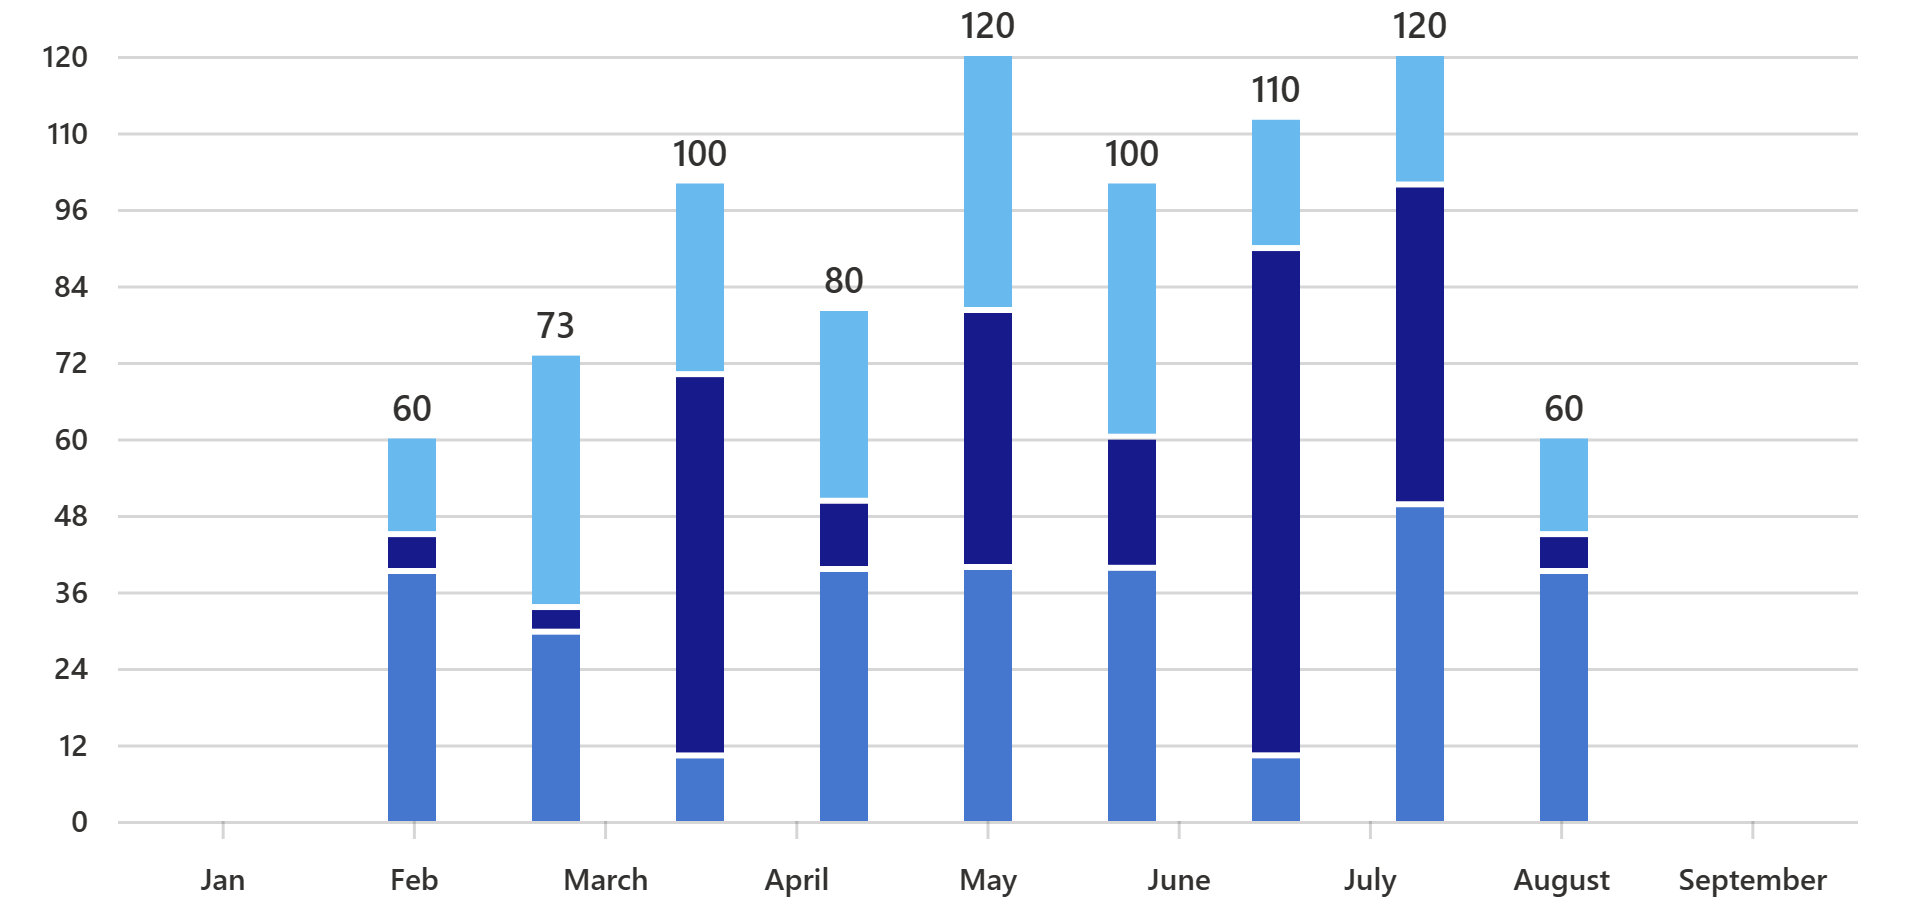
The domain (x-axis labels) doesn’t sync with the bars.
Solution
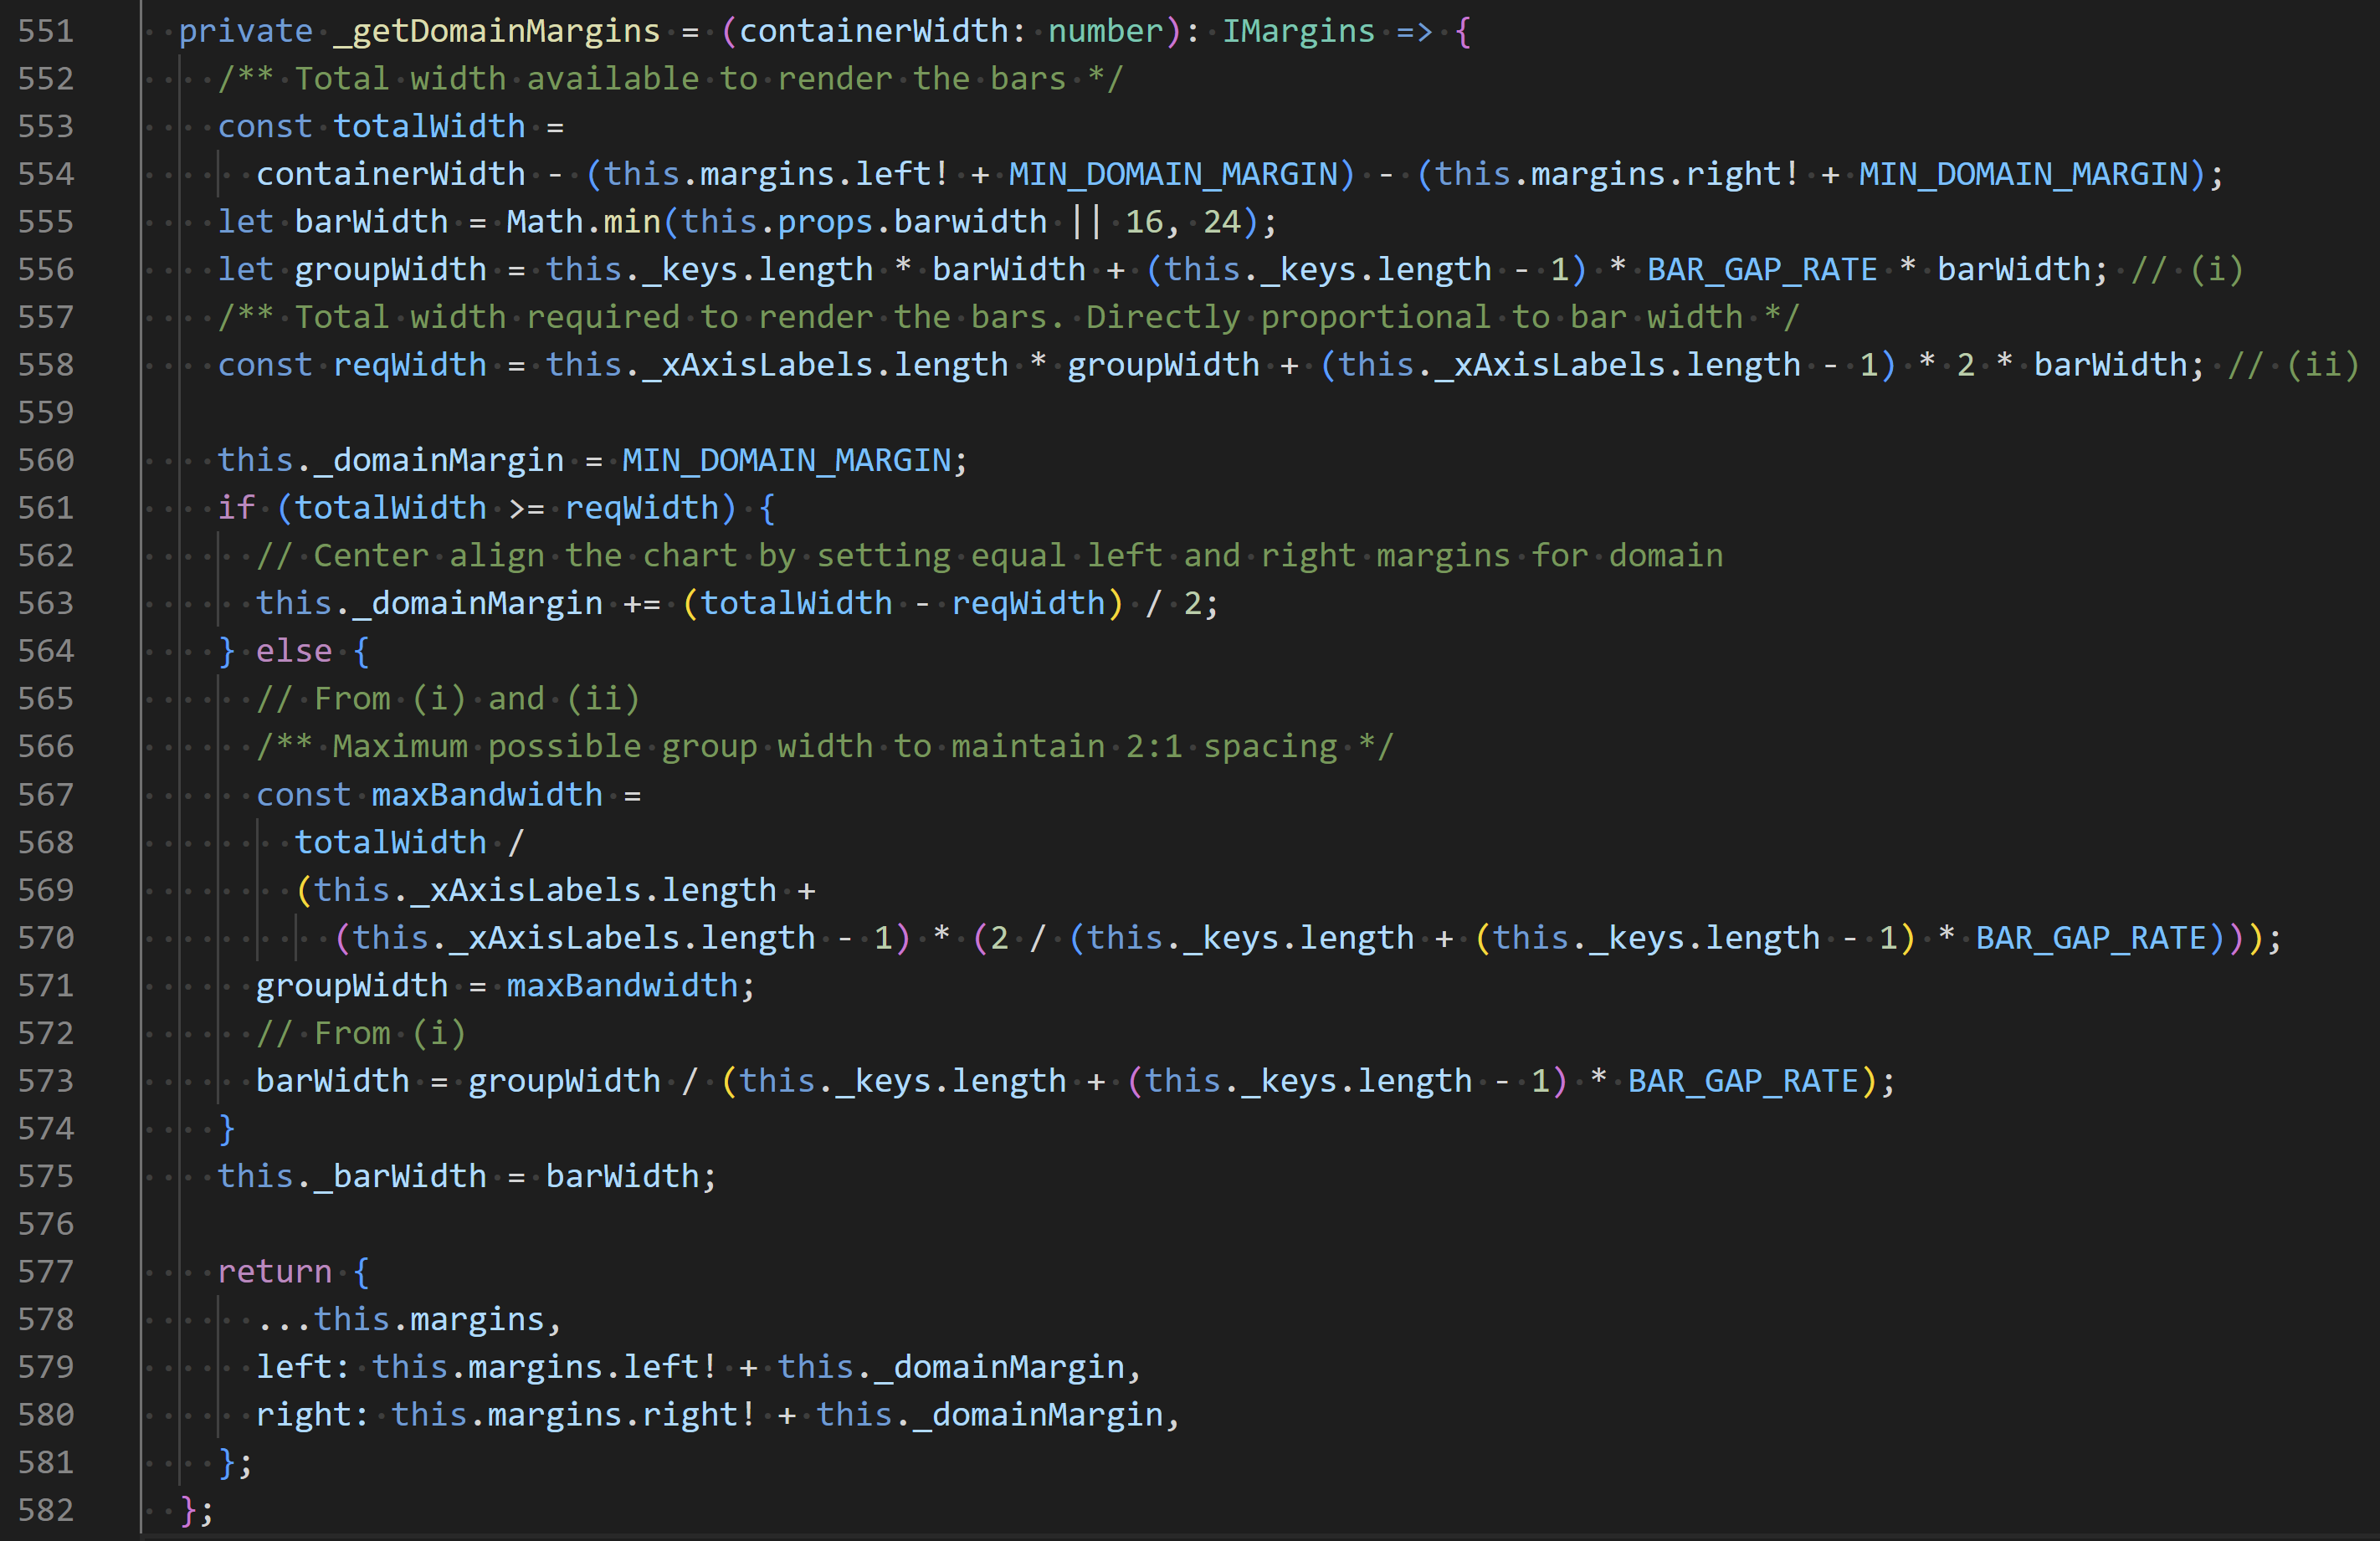
Create a function to generate margins for the domain, taking the extra space into account:
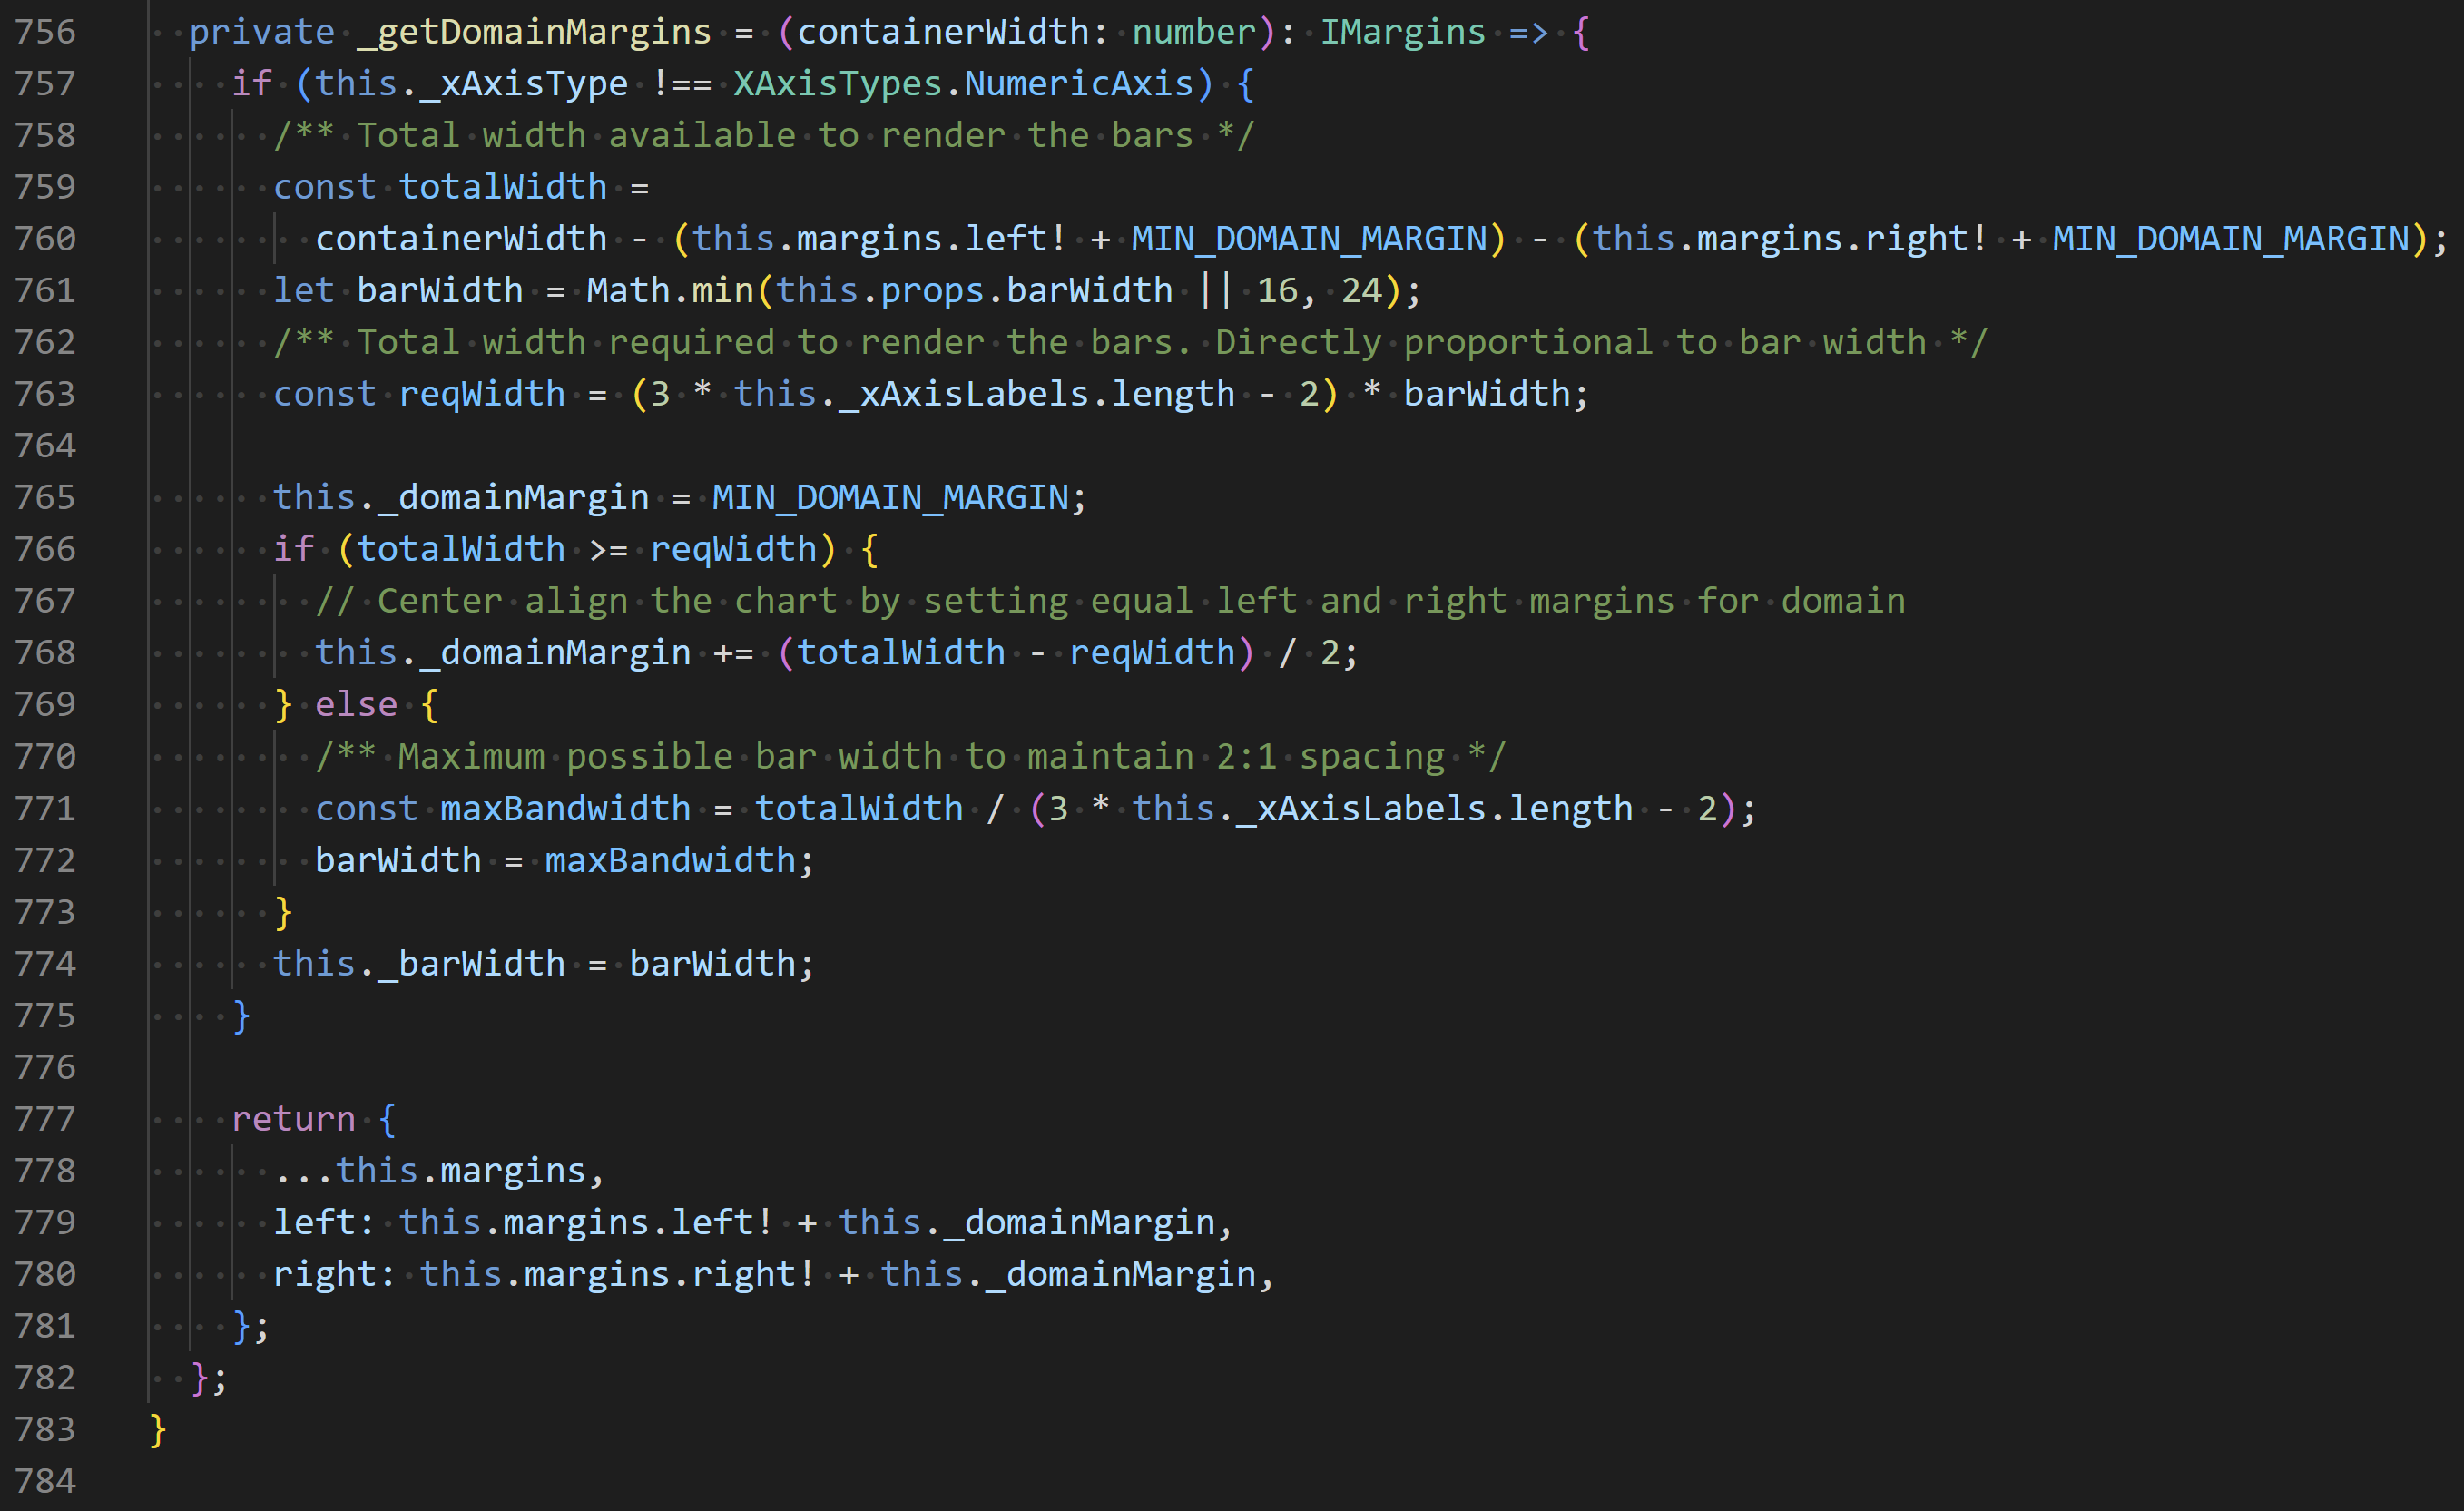 VerticalStackedBarChart.base.tsx
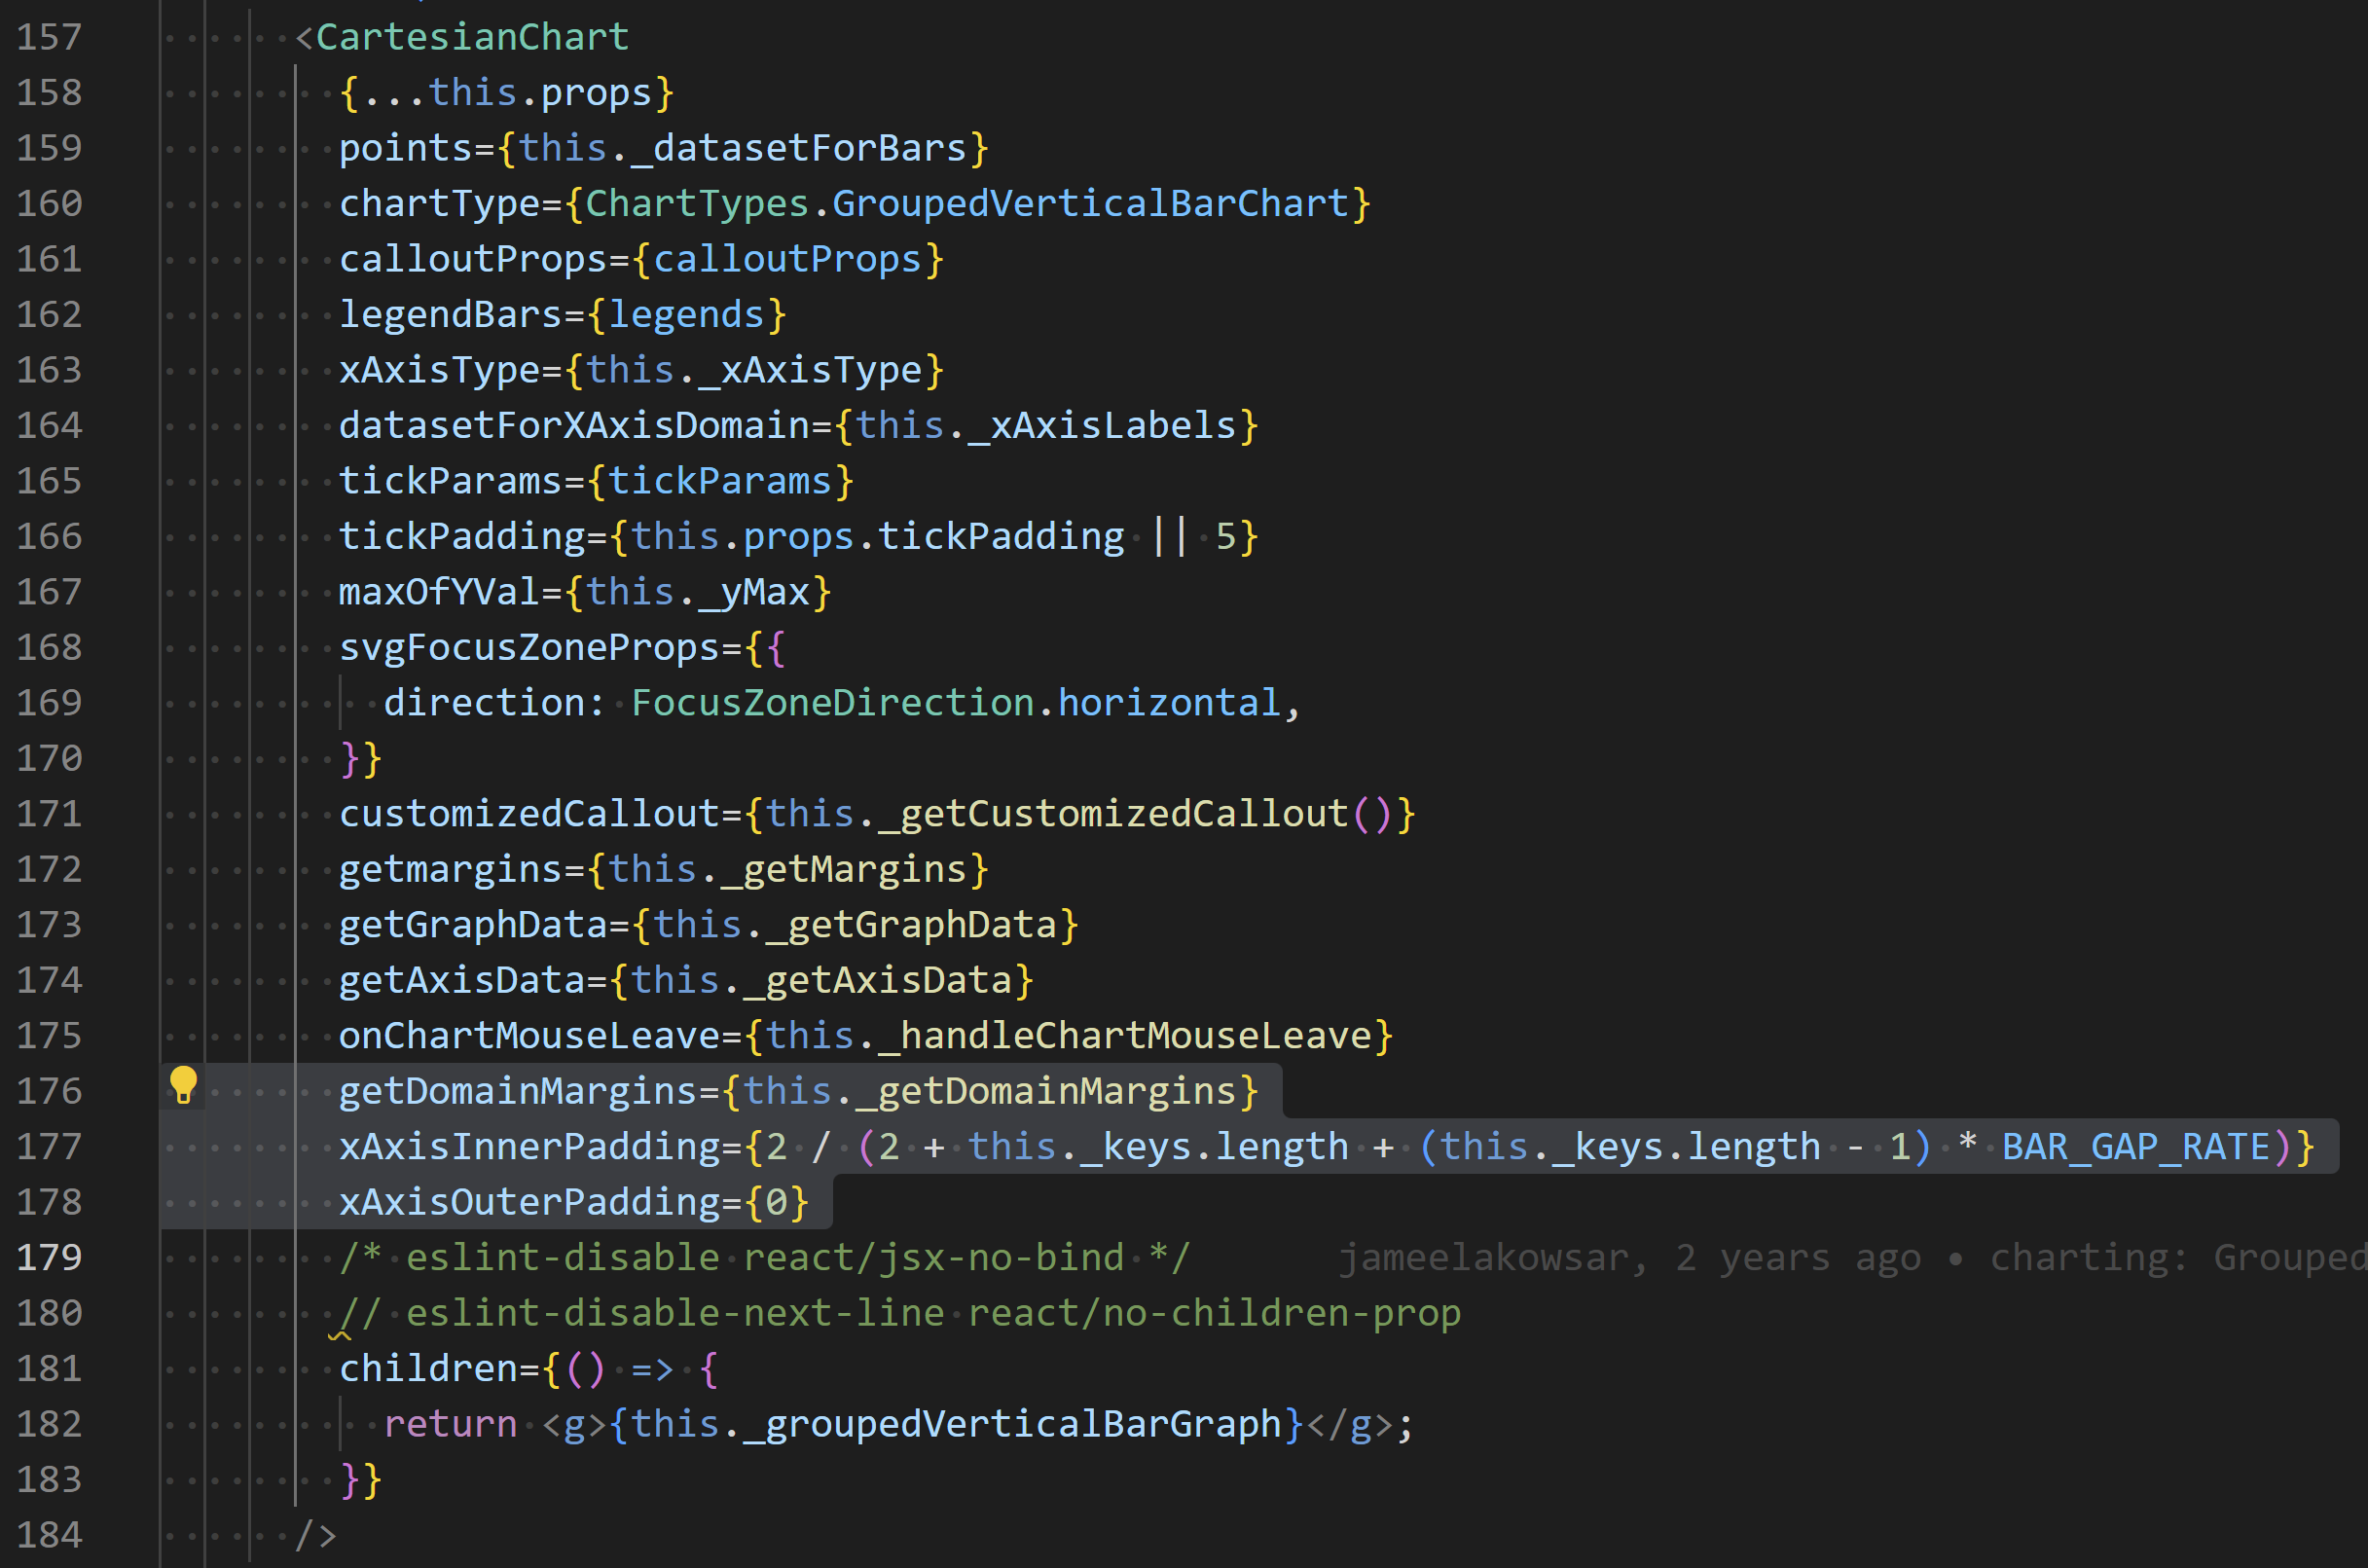
Pass the function and the same inner padding to the CartesianChart common component where the axes are created:
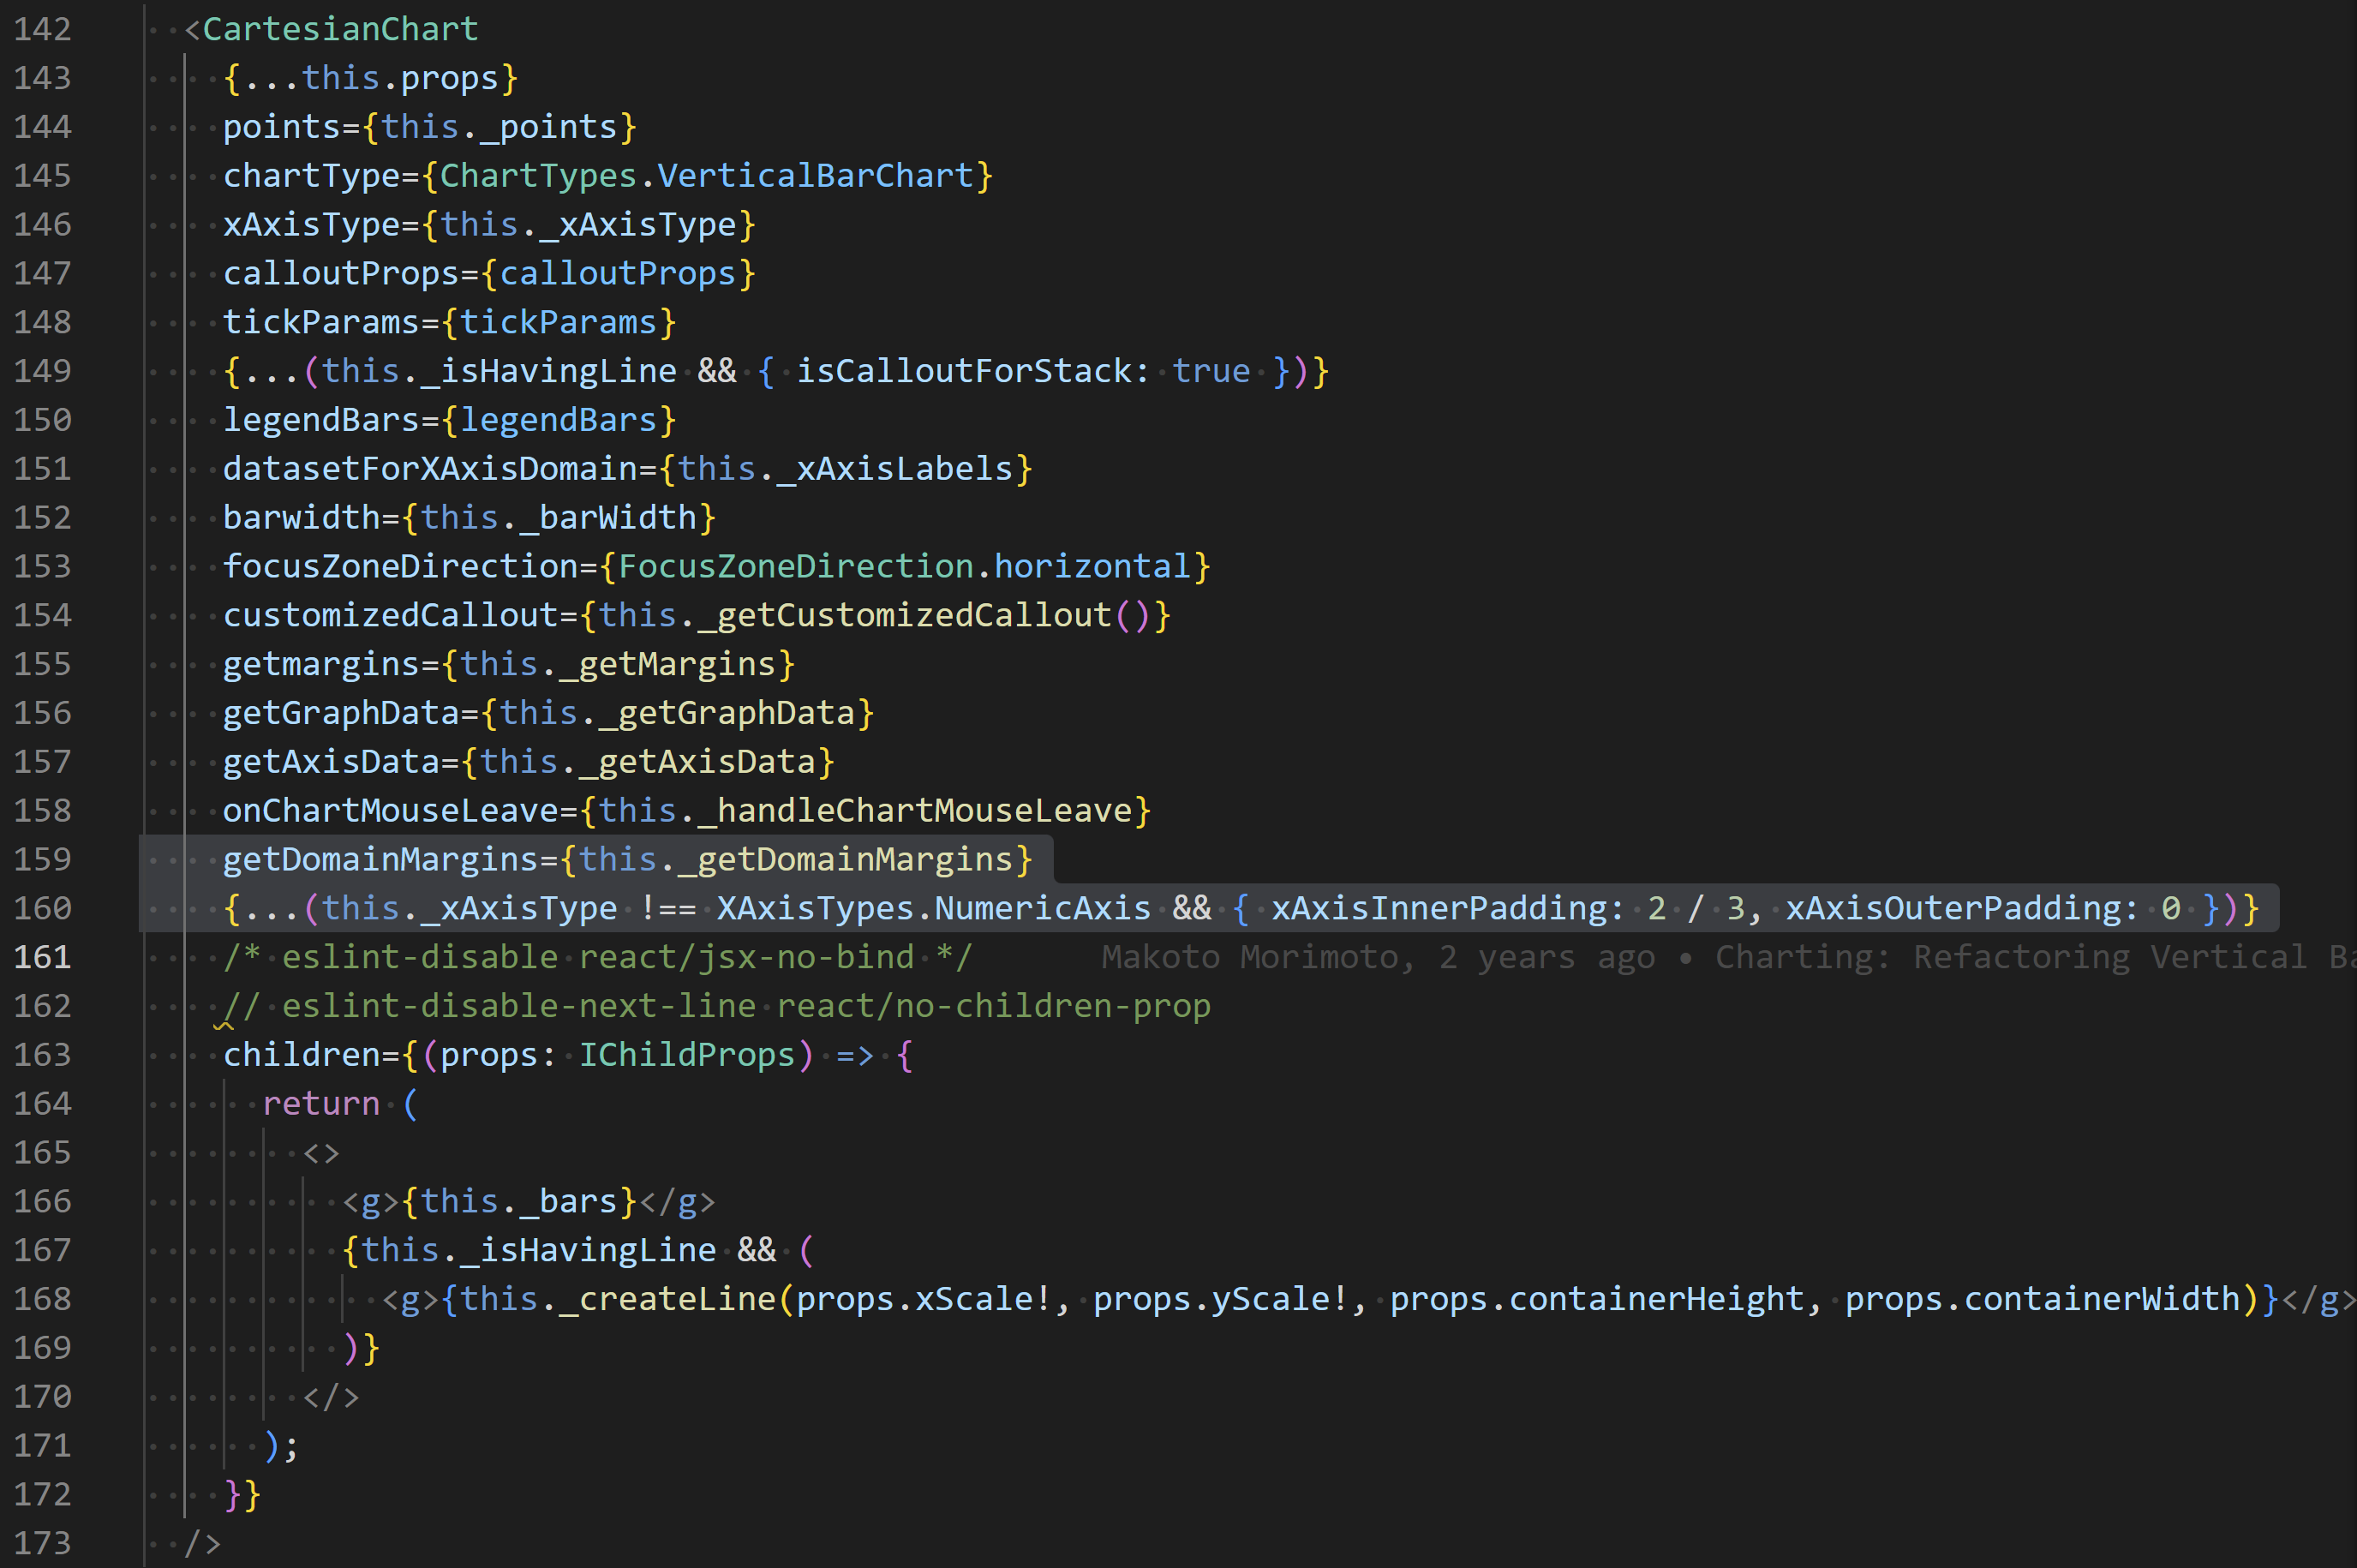 VerticalStackedBarChart.base.tsx
Update parameters of the function that creates the axis:
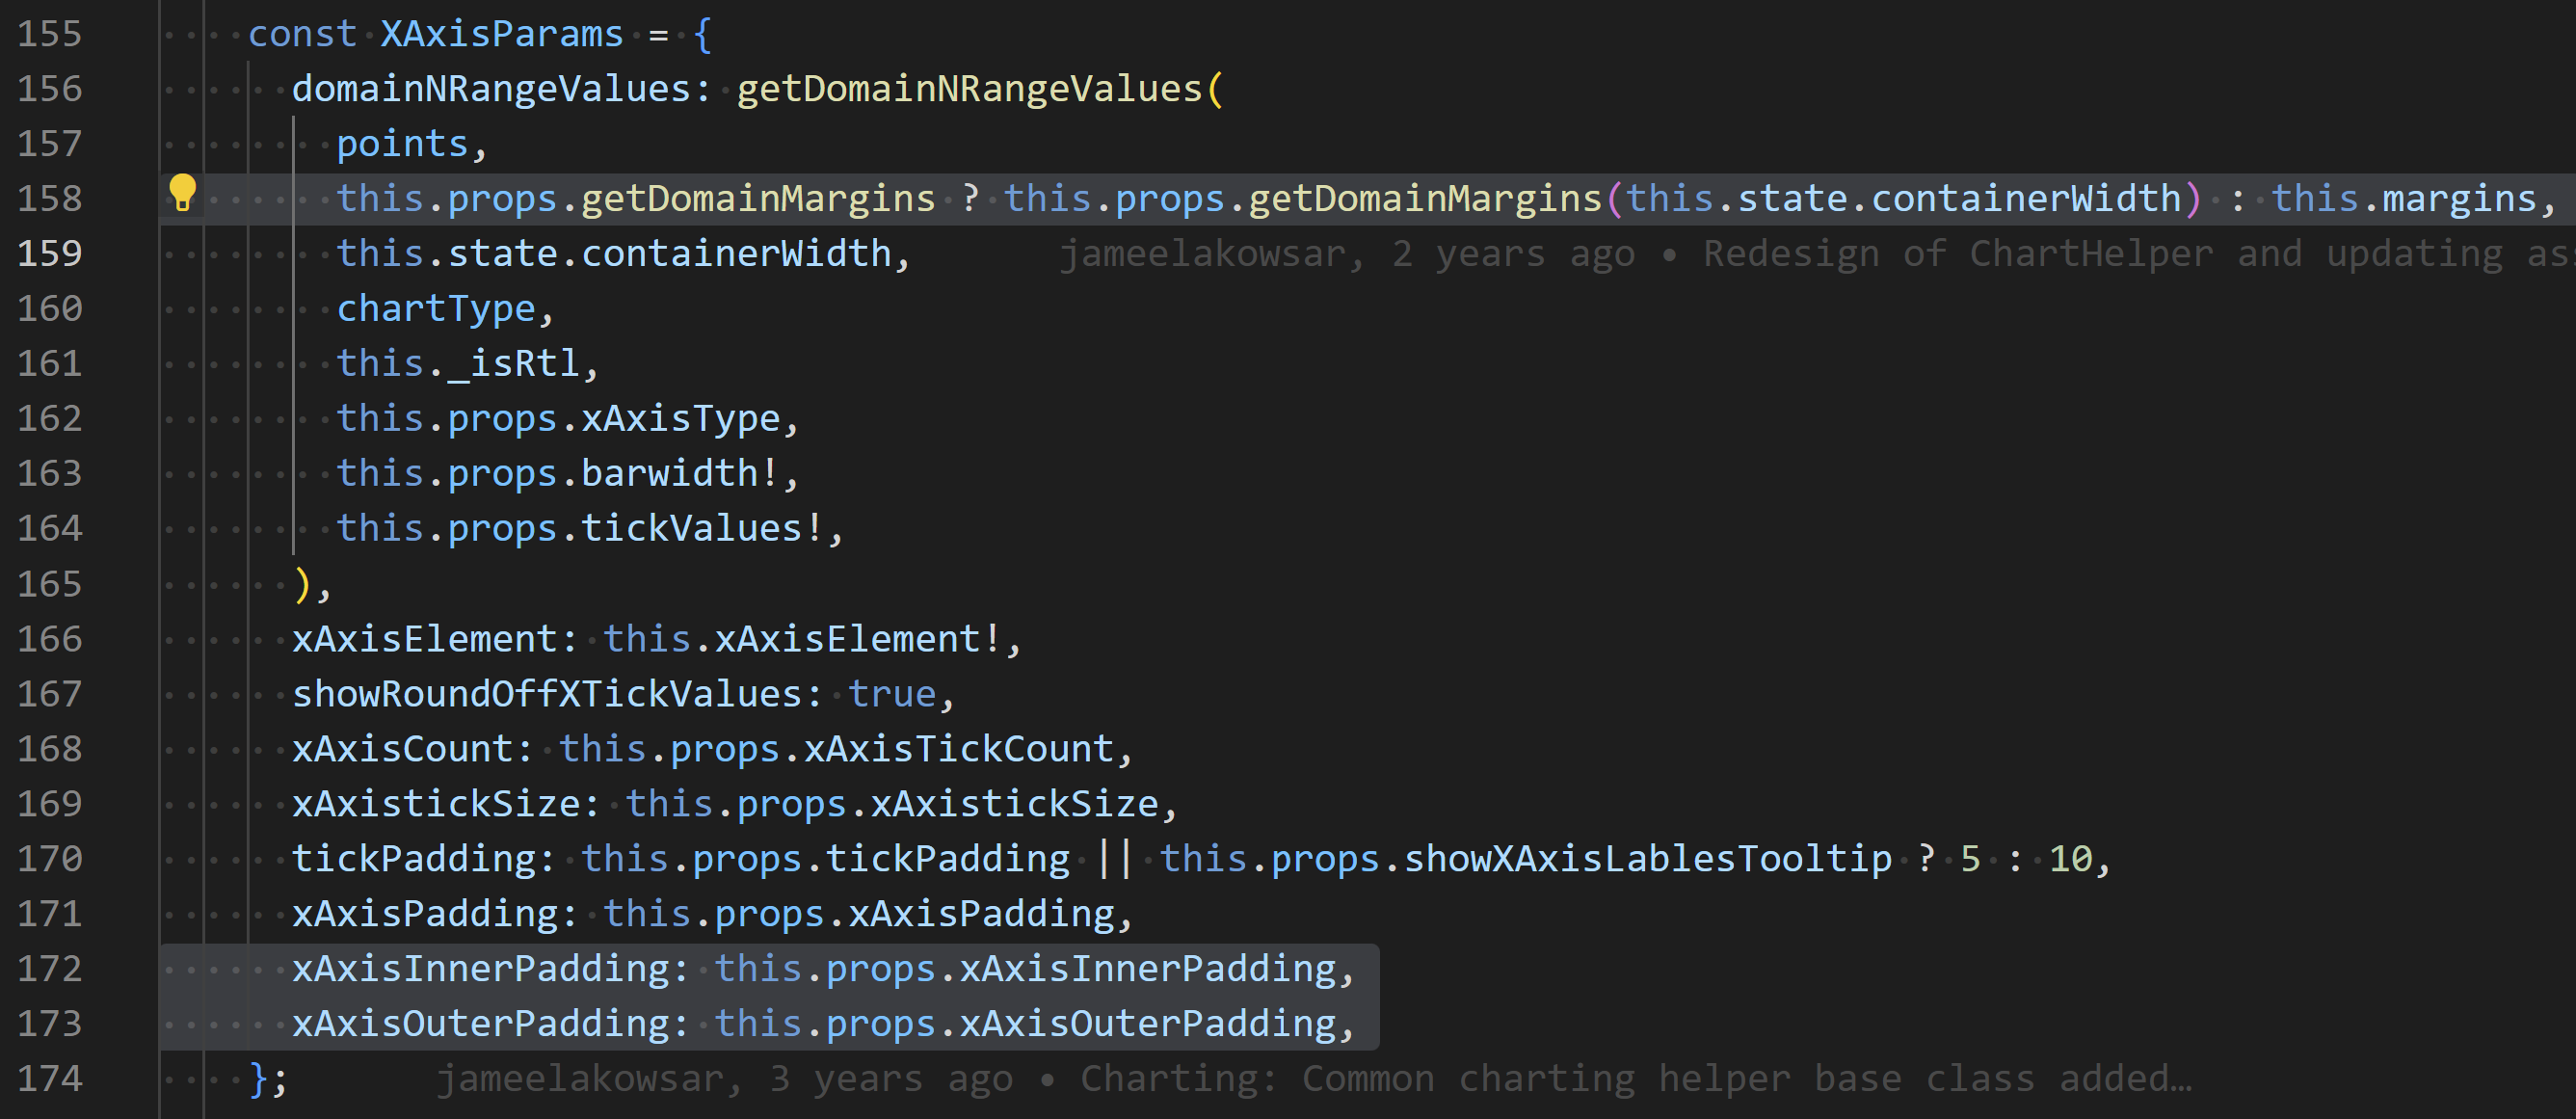 CartesianChart.base.tsx
Set the inner padding while constructing the scale for the axis:
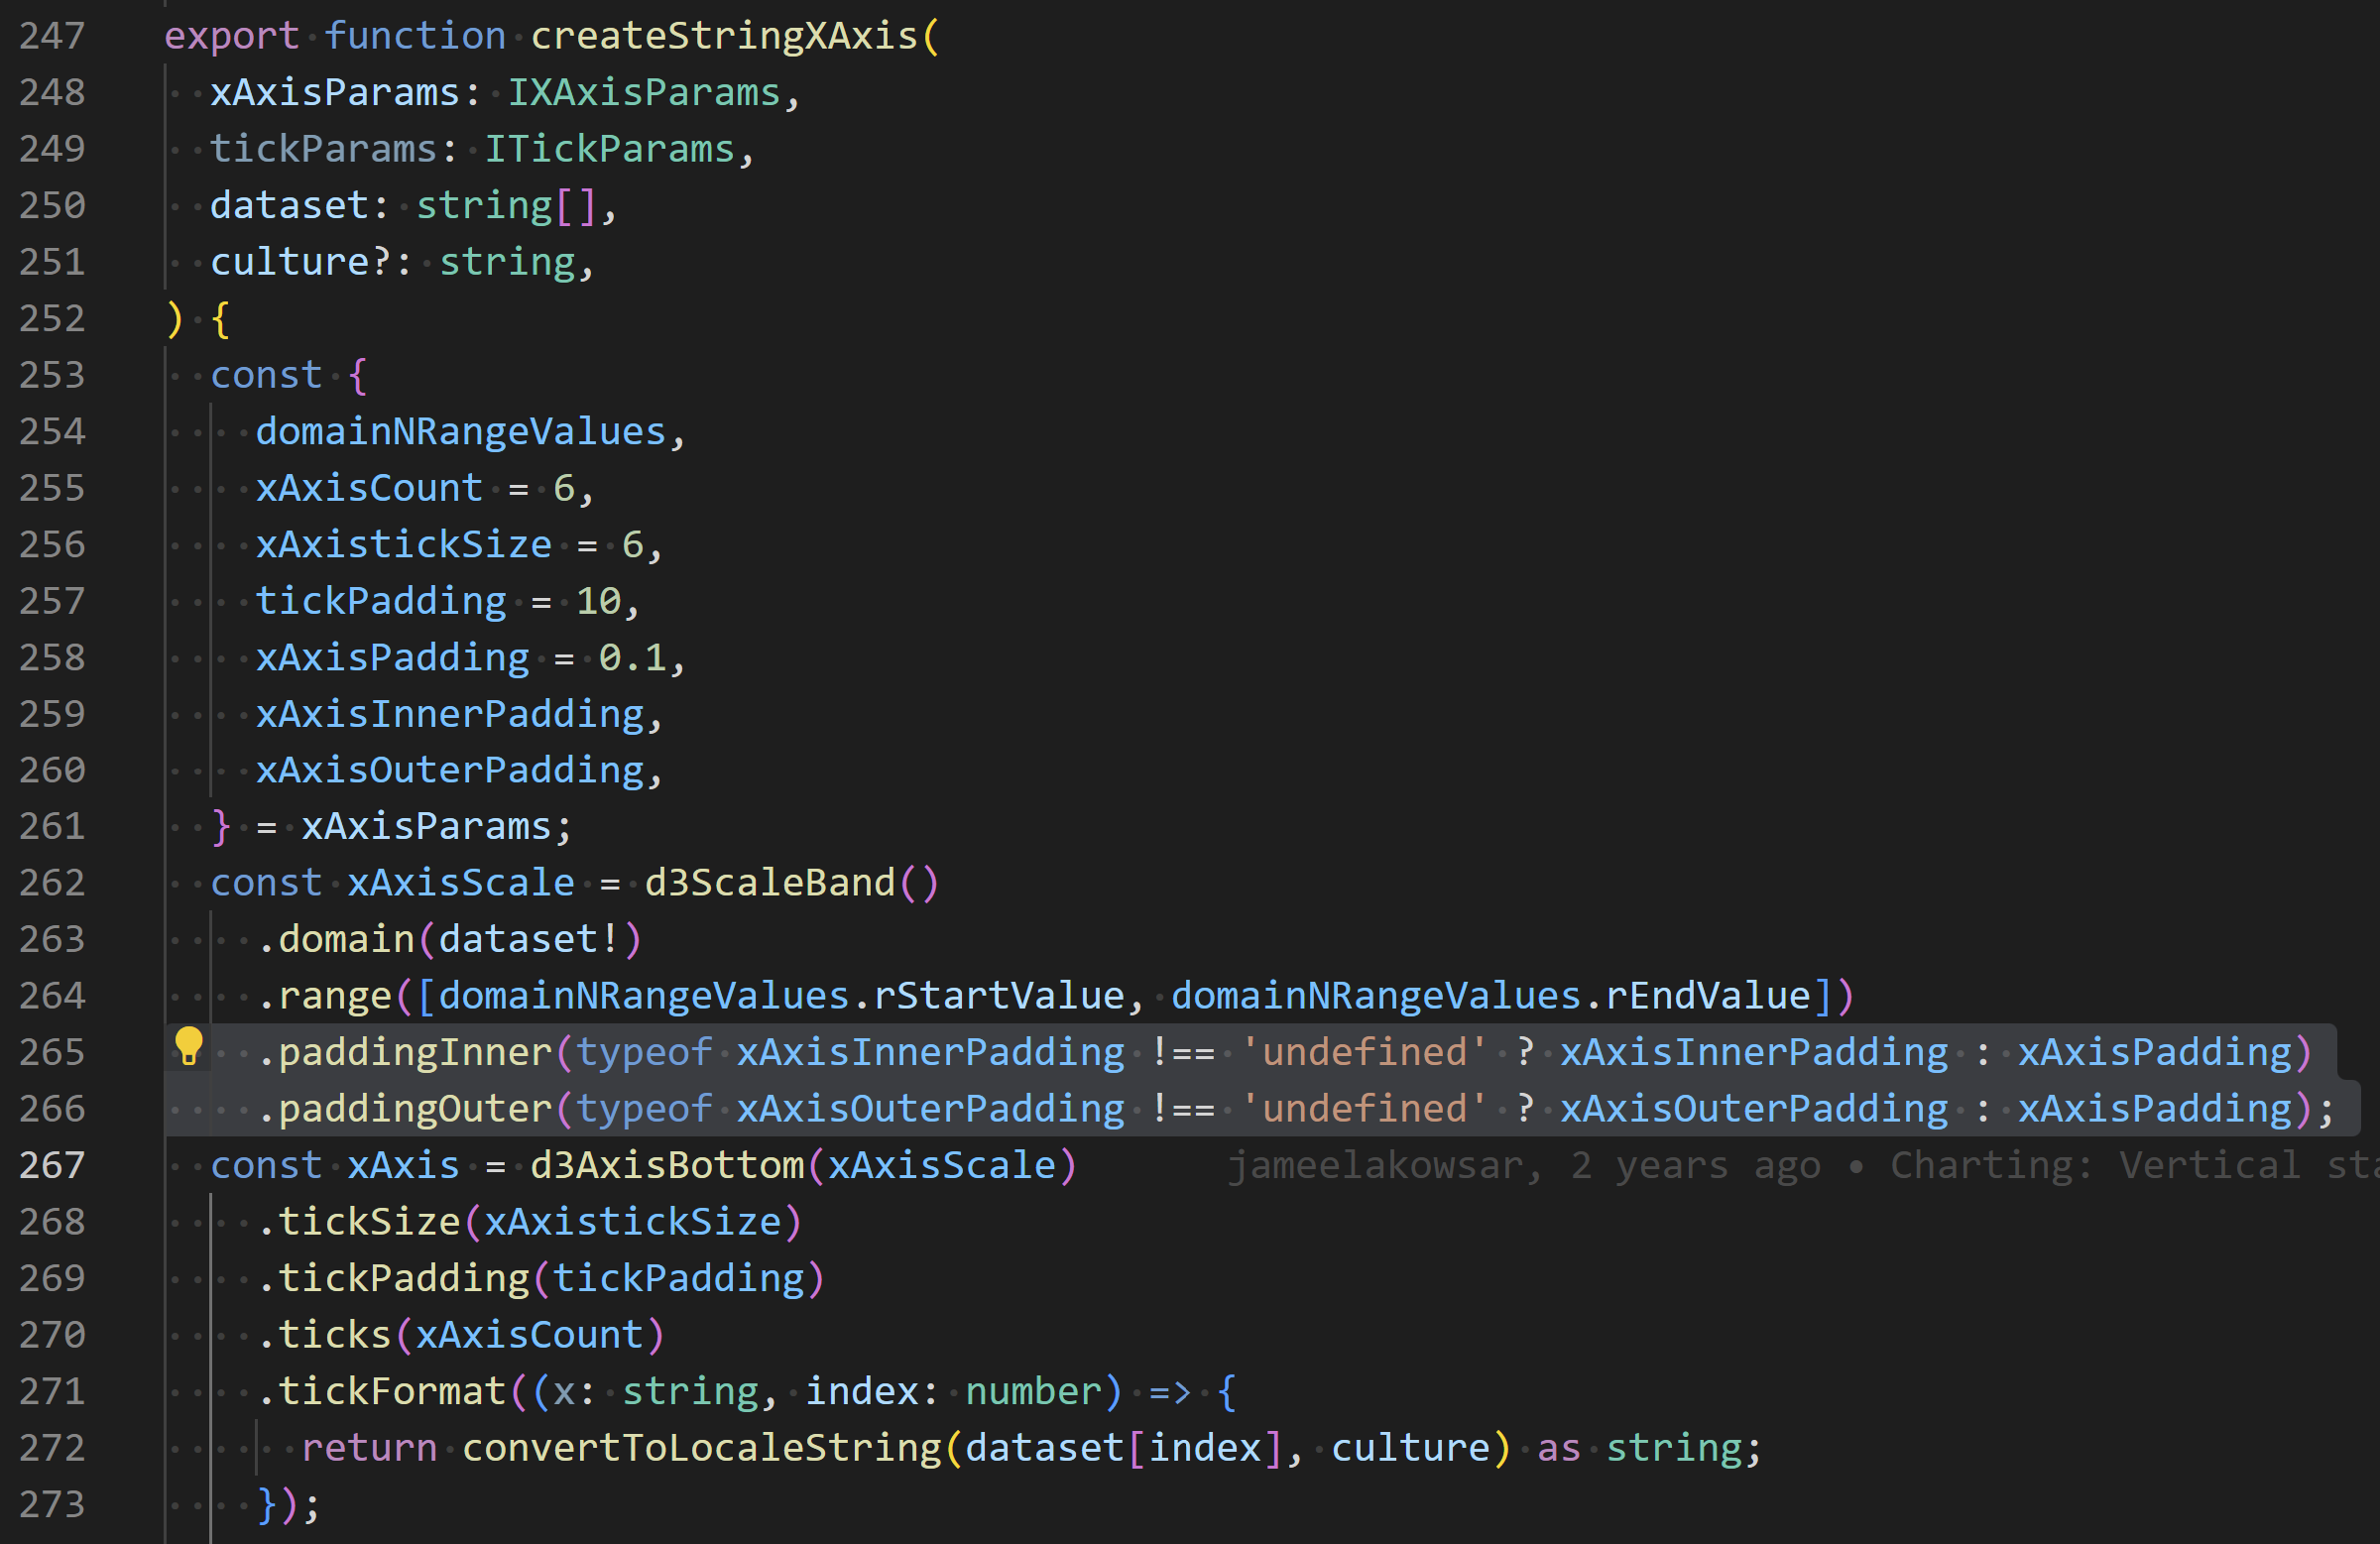 utilities.ts
Special Case: GroupedVerticalBarChart
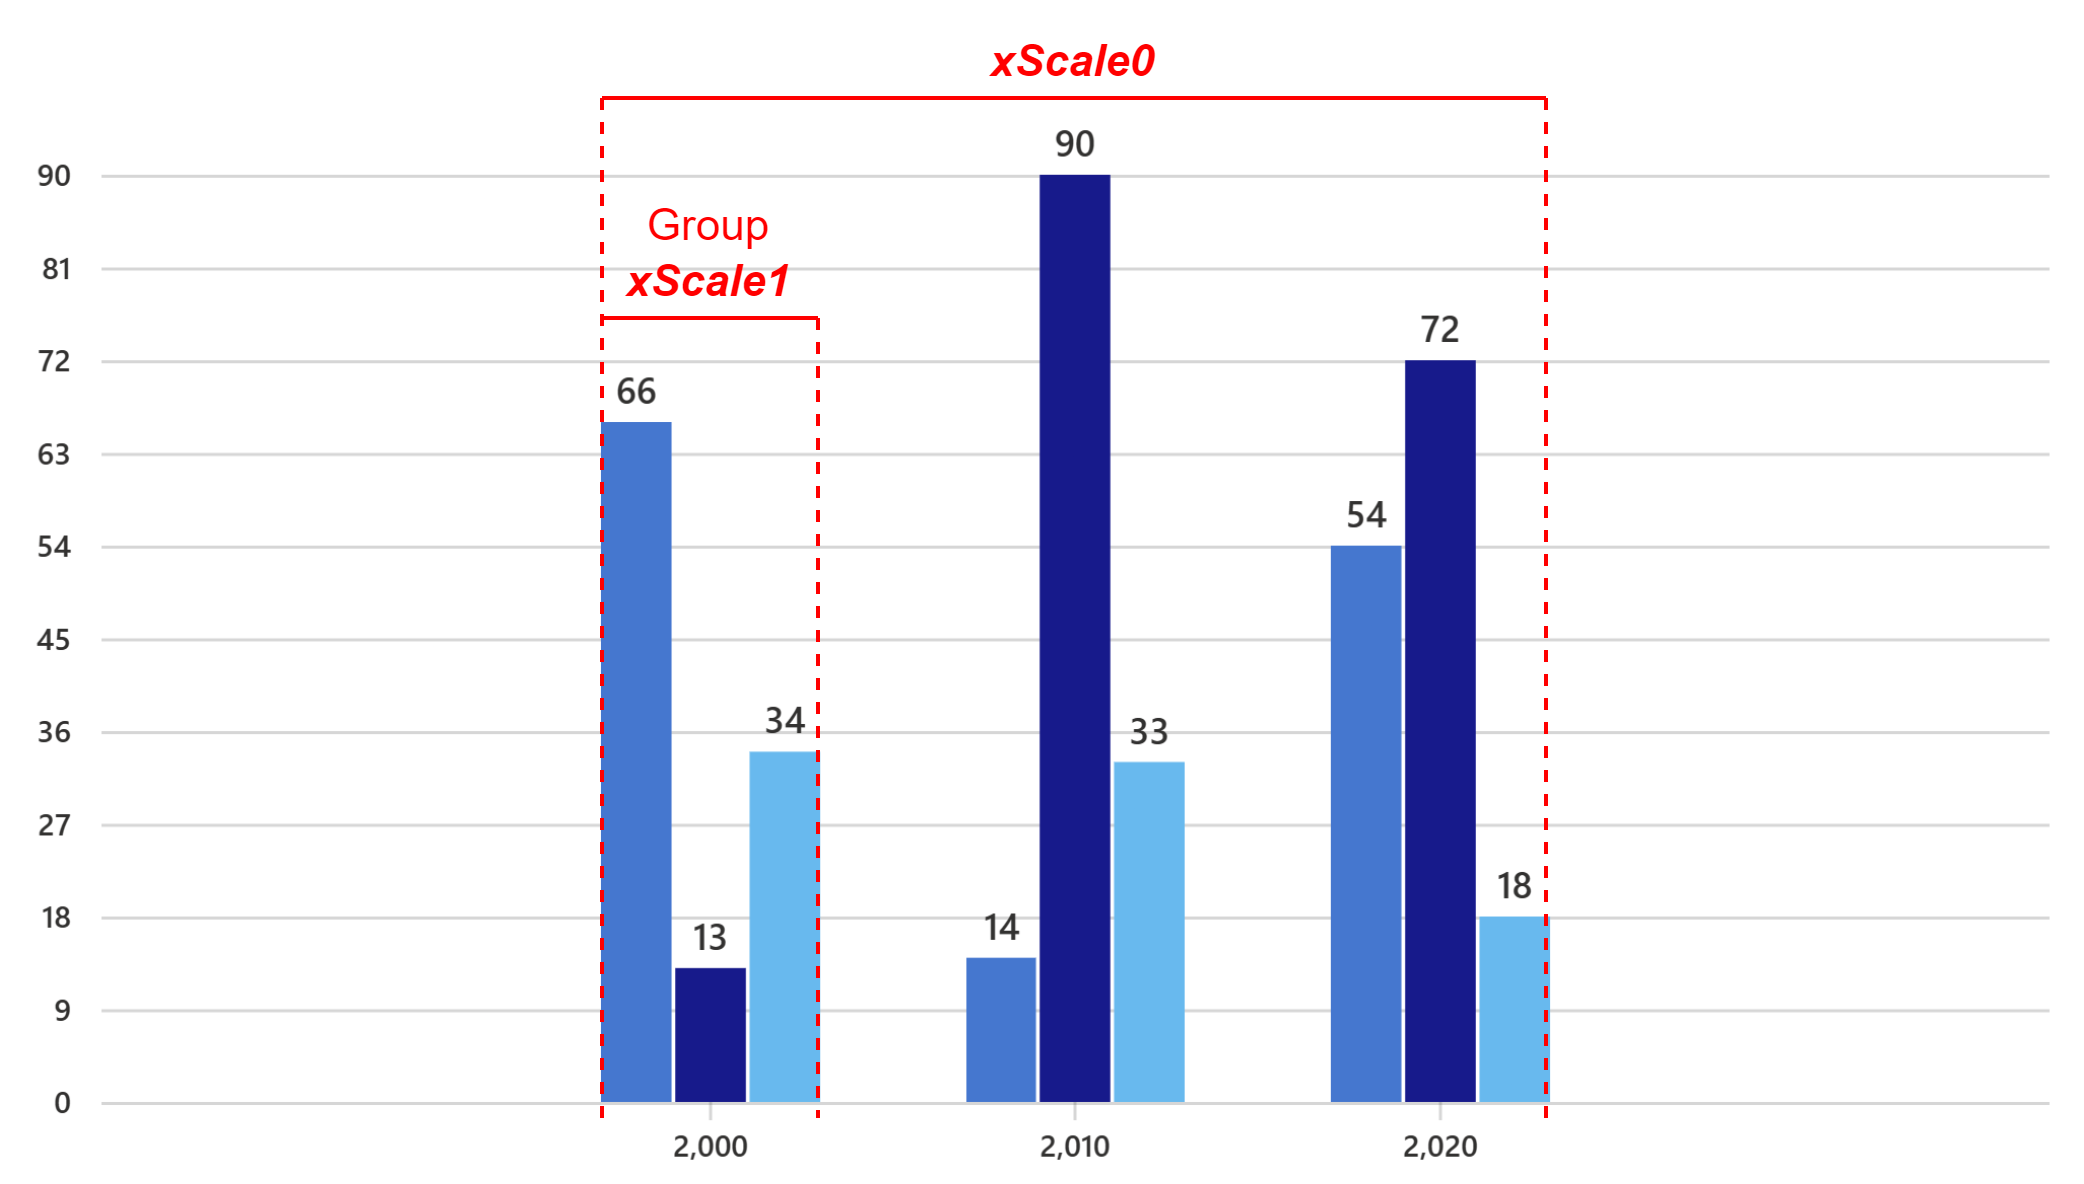
Construct a scale to define the geometry of the bars in a group:
const X1_INNER_PADDING = 0.1;

const xScale1 = d3ScaleBand()
    .domain(this._keys)
    .range([0, xScale0.bandwidth()])
    .paddingInner(X1_INNER_PADDING);
where
_keys is an array of strings that identify the bars in a group.
const BAR_GAP_RATE = X1_INNER_PADDING / (1 - X1_INNER_PADDING);
Construct a scale to define the geometry of the groups:
const xScale0 = d3ScaleBand()
    .domain(this._xAxisLabels)
    .range([this.margins.left! + this._domainMargin, containerWidth! - this.margins.right! - this._domainMargin])
    .paddingInner(2 / (2 + this._keys.length + (this._keys.length - 1) * BAR_GAP_RATE));
where
_keys.length is equal to the number of bars in a group.
Create a function to generate margins for the domain, taking the extra space into account:
 GroupedVerticalBarChart.base.tsx
Pass the function and the same inner padding to the CartesianChart common component where the axes are created:
 GroupedVerticalBarChart.base.tsx
Note: The bars and the x-axis use separate scales for rendering, and code changes are done to sync these scales. A better solution would be to share the same scale with both, but doing so will need a lot of refactoring in the shared/common code.