plotting#
onnxrt_backend_dev.plotting.memory#
memory_peak_plot#
- onnxrt_backend_dev.plotting.memory.memory_peak_plot(df1: List[Dict[str, Any]] | pandas.DataFrame, key: str | Tuple[str, ...] = 'export', suptitle: str = 'Memory Peak', bars: float | List[float] | None = None, figsize: Tuple[int, int] = (10, 6), fontsize: int | None = 6) matplotlib.axes.Axes[source]#
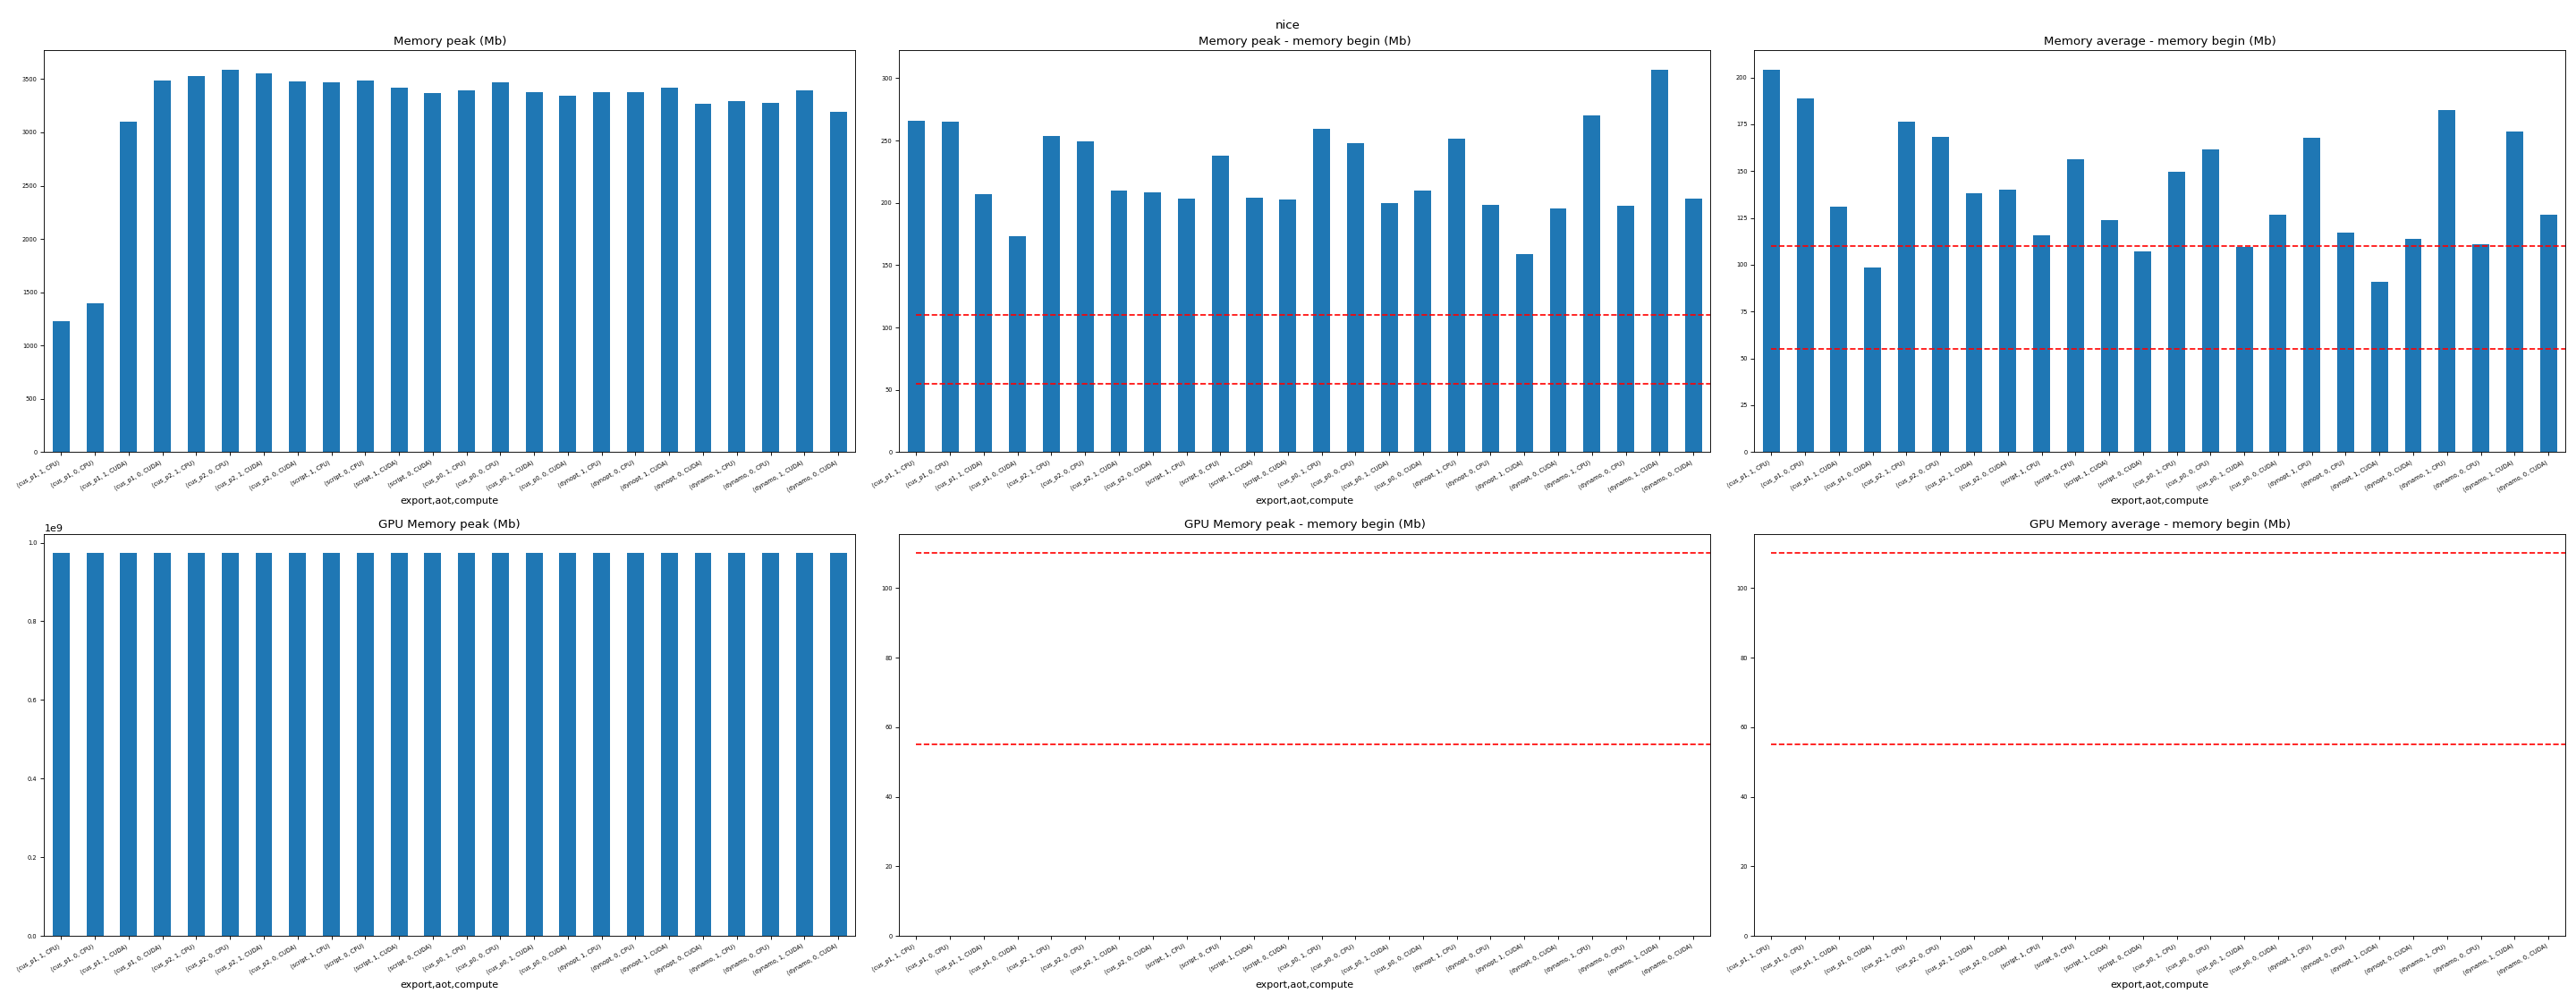
Draws a plot showing data coming from a memory profiling. See function
onnxrt_backend_dev.monitoring.memory_peak.start_spying_on().- Parameters:
df1 – data
key – used to index figures
subtitle – title for the whole graph
bars – horizontal bars to show thresholds or limits
figsize – figure size
fontsize – font size
- Returns:
axes
(
Source code,png,hires.png,pdf)