Joining People Skills Data with Viva Insights: Complete Tutorial
This comprehensive tutorial walks through how to join People Skills data with Viva Insights to answer common business questions that analysts frequently encounter. We’ll demonstrate practical scenarios using both R and Python, showing you how to transform raw skills data into actionable organizational insights.
What You’ll Learn
By the end of this tutorial, you’ll be able to:
- Set up and join multiple skills datasets with Viva Insights data
- Answer strategic questions about organizational capabilities and talent
- Identify specific expertise within your organization (e.g., “Who has AI skills?”)
- Analyze broader capabilities using skill hierarchies and relationships
- Map your skills landscape to understand organizational strengths
- Assess talent well-being by combining skills data with collaboration metrics
- Evaluate technology adoption patterns based on employee skills
Business Scenarios Covered
This tutorial demonstrates five key scenarios that analysts commonly need to address:
- Deep Knowledge Discovery: Finding people with specific skills (e.g., “Prompt Engineering”)
- Broader Capability Assessment: Understanding AI skills across the organization including subskills and related skills
- Skills Landscape Mapping: Identifying top skill areas and organizational strengths
- Talent Well-being Analysis: Comparing work patterns between different skill groups
- Technology Adoption Insights: Analyzing the relationship between skills and tool usage (e.g. Copilot)
Each scenario includes:
- Business context and questions being answered
- Methodology explanation for the analytical approach
- Complete code examples in both R and Python
- Interpretation guidance for the results
Prerequisites
Required Access & Data
To perform this analysis, you’ll need:
-
Analyst role in Viva Insights - This enables you to run the Skills landscape report template.
-
Skills data download - Once you run the query, you’ll download a zip folder containing these datasets:
- MetricOutput: Main join table with PersonId, MetricDate, PeopleHistoricalId, and MetricPrimaryKey
- HR: Organizational context for each user
- PersonSkillsMappingMetadata: Mapping between persons and skills
- PersonSkills: Skills data for individuals
- SkillsLibrary: Complete skills library/catalog
- RelatedSkills: Information about related skills
- HierarchicalSkills: Hierarchical structure of skills
It is recommended that you save the data within a project directory structure detailed below.
Project Structure Setup
To ensure reproducibility, set up your project folder with this structure:
📁 skills-analysis-project/
├── 📁 data/
│   └── 📁 demo-data/           # Unzipped Skills landscape data
│       ├── 📁 MetricOutput/
│       ├── 📁 HR/
│       ├── 📁 PersonSkillsMappingMetadata/
│       ├── 📁 PersonSkills/
│       ├── 📁 SkillsLibrary/
│       ├── 📁 RelatedSkills/
│       └── 📁 HierarchicalSkills/
├── 📁 scripts/
│   ├── 📄 analysis.R          # Your R analysis script
│   └── 📄 analysis.ipynb      # Your Python Jupyter notebook
│   └── 📄 analysis.py         # OR Python script
└── 📁 output/
    └── 📄 results.html        # Generated reports
Additional analysis scripts that you create on top can be added under scripts.
💡 Tip: This structure makes it easy to reference files and ensures your analysis is reproducible across different environments.
Development Environment Setup
For performing data joins and analyses, this tutorial covers example scripts in both the R and Python analysis environments. On how to set this up, see Skills Data Join Requirements.
Data Loading and Joining
Understanding the Data Structure
The Skills landscape data consists of multiple interconnected tables:
- MetricOutput (main join table): Links people to their skills through key relationships. This contains a Person query, where the key identifier variables are
PersonIdandMetricDate. Other additional Viva Insights metrics likeCollaboration hoursandTotal Copilot actions takencan be added to this query. - HR: Provides organizational context (department, level, etc.)
- SkillsLibrary: Contains the catalog of all available skills
- PersonSkills + PersonSkillsMappingMetadata: Bridge tables connecting people to their skills
- HierarchicalSkills: Shows parent-child relationships between skills (e.g., “Machine Learning” under “AI”)
- RelatedSkills: Shows adjacent/complementary skills
Step 1: Load Required Packages
The first step here is to load the required packages. A different set of packages are loaded in for R and Python:
R Setup:
# Load required packages
library(vivainsights)
library(tidyverse)
library(here)
Python Setup:
# Import required libraries
import pandas as pd
import numpy as np
from pathlib import Path
import plotly.express as px
import vivainsights as vi
from scipy import stats
Step 2: Set File Paths and Load Data
Since each file is nested in a subfolder, it is handy to list out the paths of the file before importing them.
For R, here() offers a simple way of handling relative file paths. We first set base_path as the root path to where all the subfolders are. You may also need to update the file names (especially the Person query) if they differ from ones you have downloaded.
R Implementation:
# Set file paths for all demo data tables
base_path <- here('data', 'demo-data') # root for data files
path_PersonQuery <- here(base_path, 'MetricOutput', 'Skills landscape_manualTestE3_1_29Sep2025_2237Hours.Csv')
path_HR <- here(base_path, 'HR', 'HR.Csv')
path_PersonSkillsMap <- here(base_path, 'PersonSkillsMappingMetadata','PersonSkillsMappingMetadata.Csv')
path_PersonSkills <- here(base_path, 'PersonSkills', 'PersonSkills.Csv')
path_SkillsLib <- here(base_path, 'SkillsLibrary', 'SkillsLibrary.Csv')
path_RelatedSkills <- here(base_path, 'RelatedSkills', 'RelatedSkills.Csv')
path_HierarchicalSkills <- here(base_path, 'HierarchicalSkills', 'HierarchicalSkills.Csv')

# Load all data tables
df_PersonQuery <- import_query(path_PersonQuery) # `import_query()` for handling Viva Insights query
df_HR <- read_csv(path_HR)
df_PersonSkillsMap <- read_csv(path_PersonSkillsMap)
df_PersonSkills <- read_csv(path_PersonSkills)
df_SkillsLib <- read_csv(path_SkillsLib)
df_RelatedSkills <- read_csv(path_RelatedSkills)
df_HierarchicalSkills <- read_csv(path_HierarchicalSkills)
For Python, the approach is similar:
Python Implementation:
# Set base path to demo data
base_path = Path('data/demo-data')

# Define file paths for all datasets
paths = {
    'PersonQuery': base_path / 'MetricOutput' / 'Skills landscape_manualTestE3_1_29Sep2025_2237Hours.Csv',
    'HR': base_path / 'HR' / 'HR.Csv',
    'PersonSkillsMap': base_path / 'PersonSkillsMappingMetadata' / 'PersonSkillsMappingMetadata.Csv',
    'PersonSkills': base_path / 'PersonSkills' / 'PersonSkills.Csv',
    'SkillsLibrary': base_path / 'SkillsLibrary' / 'SkillsLibrary.Csv',
    'RelatedSkills': base_path / 'RelatedSkills' / 'RelatedSkills.Csv',
    'HierarchicalSkills': base_path / 'HierarchicalSkills' / 'HierarchicalSkills.Csv'
}

# Load all data tables
df_PersonQuery = vi.import_query(paths['PersonQuery']) # `import_query()` for handling Viva Insights query
df_HR = pd.read_csv(paths['HR'])
df_PersonSkillsMap = pd.read_csv(paths['PersonSkillsMap'])
df_PersonSkills = pd.read_csv(paths['PersonSkills'])
df_SkillsLibrary = pd.read_csv(paths['SkillsLibrary'])
df_RelatedSkills = pd.read_csv(paths['RelatedSkills'])
df_HierarchicalSkills = pd.read_csv(paths['HierarchicalSkills'])
Note that for the Person query, we use import_query() from the vivainsights package where it performs variable name standardization, such as replacing special characters and spaces, which makes the variables easier to reference at a later analysis stage.
You can verify that the files have been loaded successfully using data exploration functions:
R options:
glimpse(df_PersonQuery)- View structure and first few values (tidyverse)str(df_PersonQuery)- View data structure (base R)head(df_PersonQuery)- View first few rows
Python options:
df_PersonQuery.info()- View structure and data typesdf_PersonQuery.head()- View first few rowsdf_PersonQuery.describe()- View summary statistics
Step 3: Create Master Dataset
Once all the data has been loaded in successfully, the key step is joining all tables to create a comprehensive dataset where each row represents a person-skill combination.
R Implementation:
# Perform the complete join to create master skills dataset
df_combined_skills <-
    df_PersonQuery %>%
    left_join(df_HR, by = 'PeopleHistoricalId') %>%
    left_join(df_PersonSkillsMap, by = 'MetricPrimaryKey') %>%
    left_join(df_PersonSkills, by = 'SkillHistoricalId') %>%
    left_join(df_SkillsLib, by = 'SkillId')

# FOR DEMO ONLY: add simulated collaboration metrics
# In a real analysis, these would come from your Viva Insights query
set.seed(123)
df_combined_skills <- df_combined_skills %>%
  mutate(
    After_hours_collaboration_hours = round(runif(n(), 0, 10), 1),
    Total_Copilot_actions_taken = round(runif(n(), 0, 100))
  )
Run the following to print a summary of the joined data file:
# Display summary
cat("Master dataset created with", nrow(df_combined_skills), "rows and", ncol(df_combined_skills), "columns\n")
cat("Unique people:", n_distinct(df_combined_skills$PersonId), "\n")
cat("Unique skills:", n_distinct(df_combined_skills$SkillId, na.rm = TRUE), "\n")
Python Implementation:
# Create master dataset with all joins
df_combined_skills = (
    df_PersonQuery
    .merge(df_HR, on='PeopleHistoricalId', how='left')
    .merge(df_PersonSkillsMap, on='MetricPrimaryKey', how='left')
    .merge(df_PersonSkills, on='SkillHistoricalId', how='left')
    .merge(df_SkillsLibrary, on='SkillId', how='left')
)

# FOR DEMO ONLY: add simulated collaboration metrics
# In a real analysis, these would come from your Viva Insights query
np.random.seed(123)
df_combined_skills['After_hours_collaboration_hours'] = np.round(np.random.uniform(0, 10, len(df_combined_skills)), 1)
df_combined_skills['Total_Copilot_actions_taken'] = np.round(np.random.uniform(0, 100, len(df_combined_skills)))
Then, run the following to print a summary of the joined data file:
# Display summary
print(f"Master dataset created with {df_combined_skills.shape[0]} rows and {df_combined_skills.shape[1]} columns")
print(f"Unique people: {df_combined_skills['PersonId'].nunique():,}")
print(f"Unique skills: {df_combined_skills['SkillId'].nunique():,}")
Something similar to the below will be printed to your console:
Master dataset created with 2772 rows and 15 columns
Unique people: 40
Unique skills: 660
💡 Understanding the Join: This creates a “person-skill” level dataset where each row represents one skill for one person. A person with 5 skills will have 5 rows in this dataset.
Business Scenarios
Now that we have our master dataset, let’s explore five practical business scenarios that demonstrate the power of combining skills data with organizational insights.
Scenario 1: Deep Knowledge Discovery
Business Question: “How many people are using Prompt Engineering skills in our organization, and which departments have them?”
Why This Matters: When you need to find subject matter experts for specific projects, form specialized teams, or understand the distribution of critical skills across your organization.
Methodology: This analysis uses exact string matching on the SkillName column to find people with specific expertise. We then aggregate by organizational units to understand distribution patterns.
Customization: In the following example, we use Organization as the grouping variable, but this can be replaced by any HR attribute that is made available in the specific query that you have run (e.g. SupervisorIndicator, LevelDesignation, Region) - you will just need to update the relevant parts in the code. Similarly, you can also choose to customize skill by replacing the value of target_skill with a skill text of your own choice.
R Implementation:
# Define target skill - update as appropriate
target_skill <- "Prompt engineering"

# Filter and analyze
scenario1_results <- df_combined_skills %>%
  filter(!is.na(SkillName),
         str_detect(SkillName, regex(target_skill, ignore_case = TRUE))) %>%
  summarise(
    skill_matches = paste(unique(SkillName), collapse = ", "),
    people_count = n_distinct(PersonId),
    total_instances = n(),
    .groups = 'drop'
  )

# Breakdown by Organization
org_breakdown <- df_combined_skills %>%
    filter(!is.na(SkillName),
           str_detect(SkillName, regex(target_skill, ignore_case = TRUE))) %>%
    group_by(Organization) %>% # Update `Organization` as appropriate
    summarise(
      people_count = n_distinct(PersonId),
      .groups = 'drop'
    ) %>%
    arrange(desc(people_count))

# Display results
cat("Found", scenario1_results$people_count, "people with", target_skill, "skills\n")
print(org_breakdown)
In this example, the following gets printed:
Found 50 people with Prompt engineering skills
Next, you can visualize the breakdown in a bar chart:
# Visualization
if(nrow(org_breakdown) > 0) {
  p1 <- org_breakdown %>%
    create_bar_asis(
      group_var = "Organization", # Update `Organization` as appropriate
      bar_var = "people_count",
      title = paste("People with", target_skill, "by Organization") # Update `Organization` as appropriate
    )
  print(p1)
}
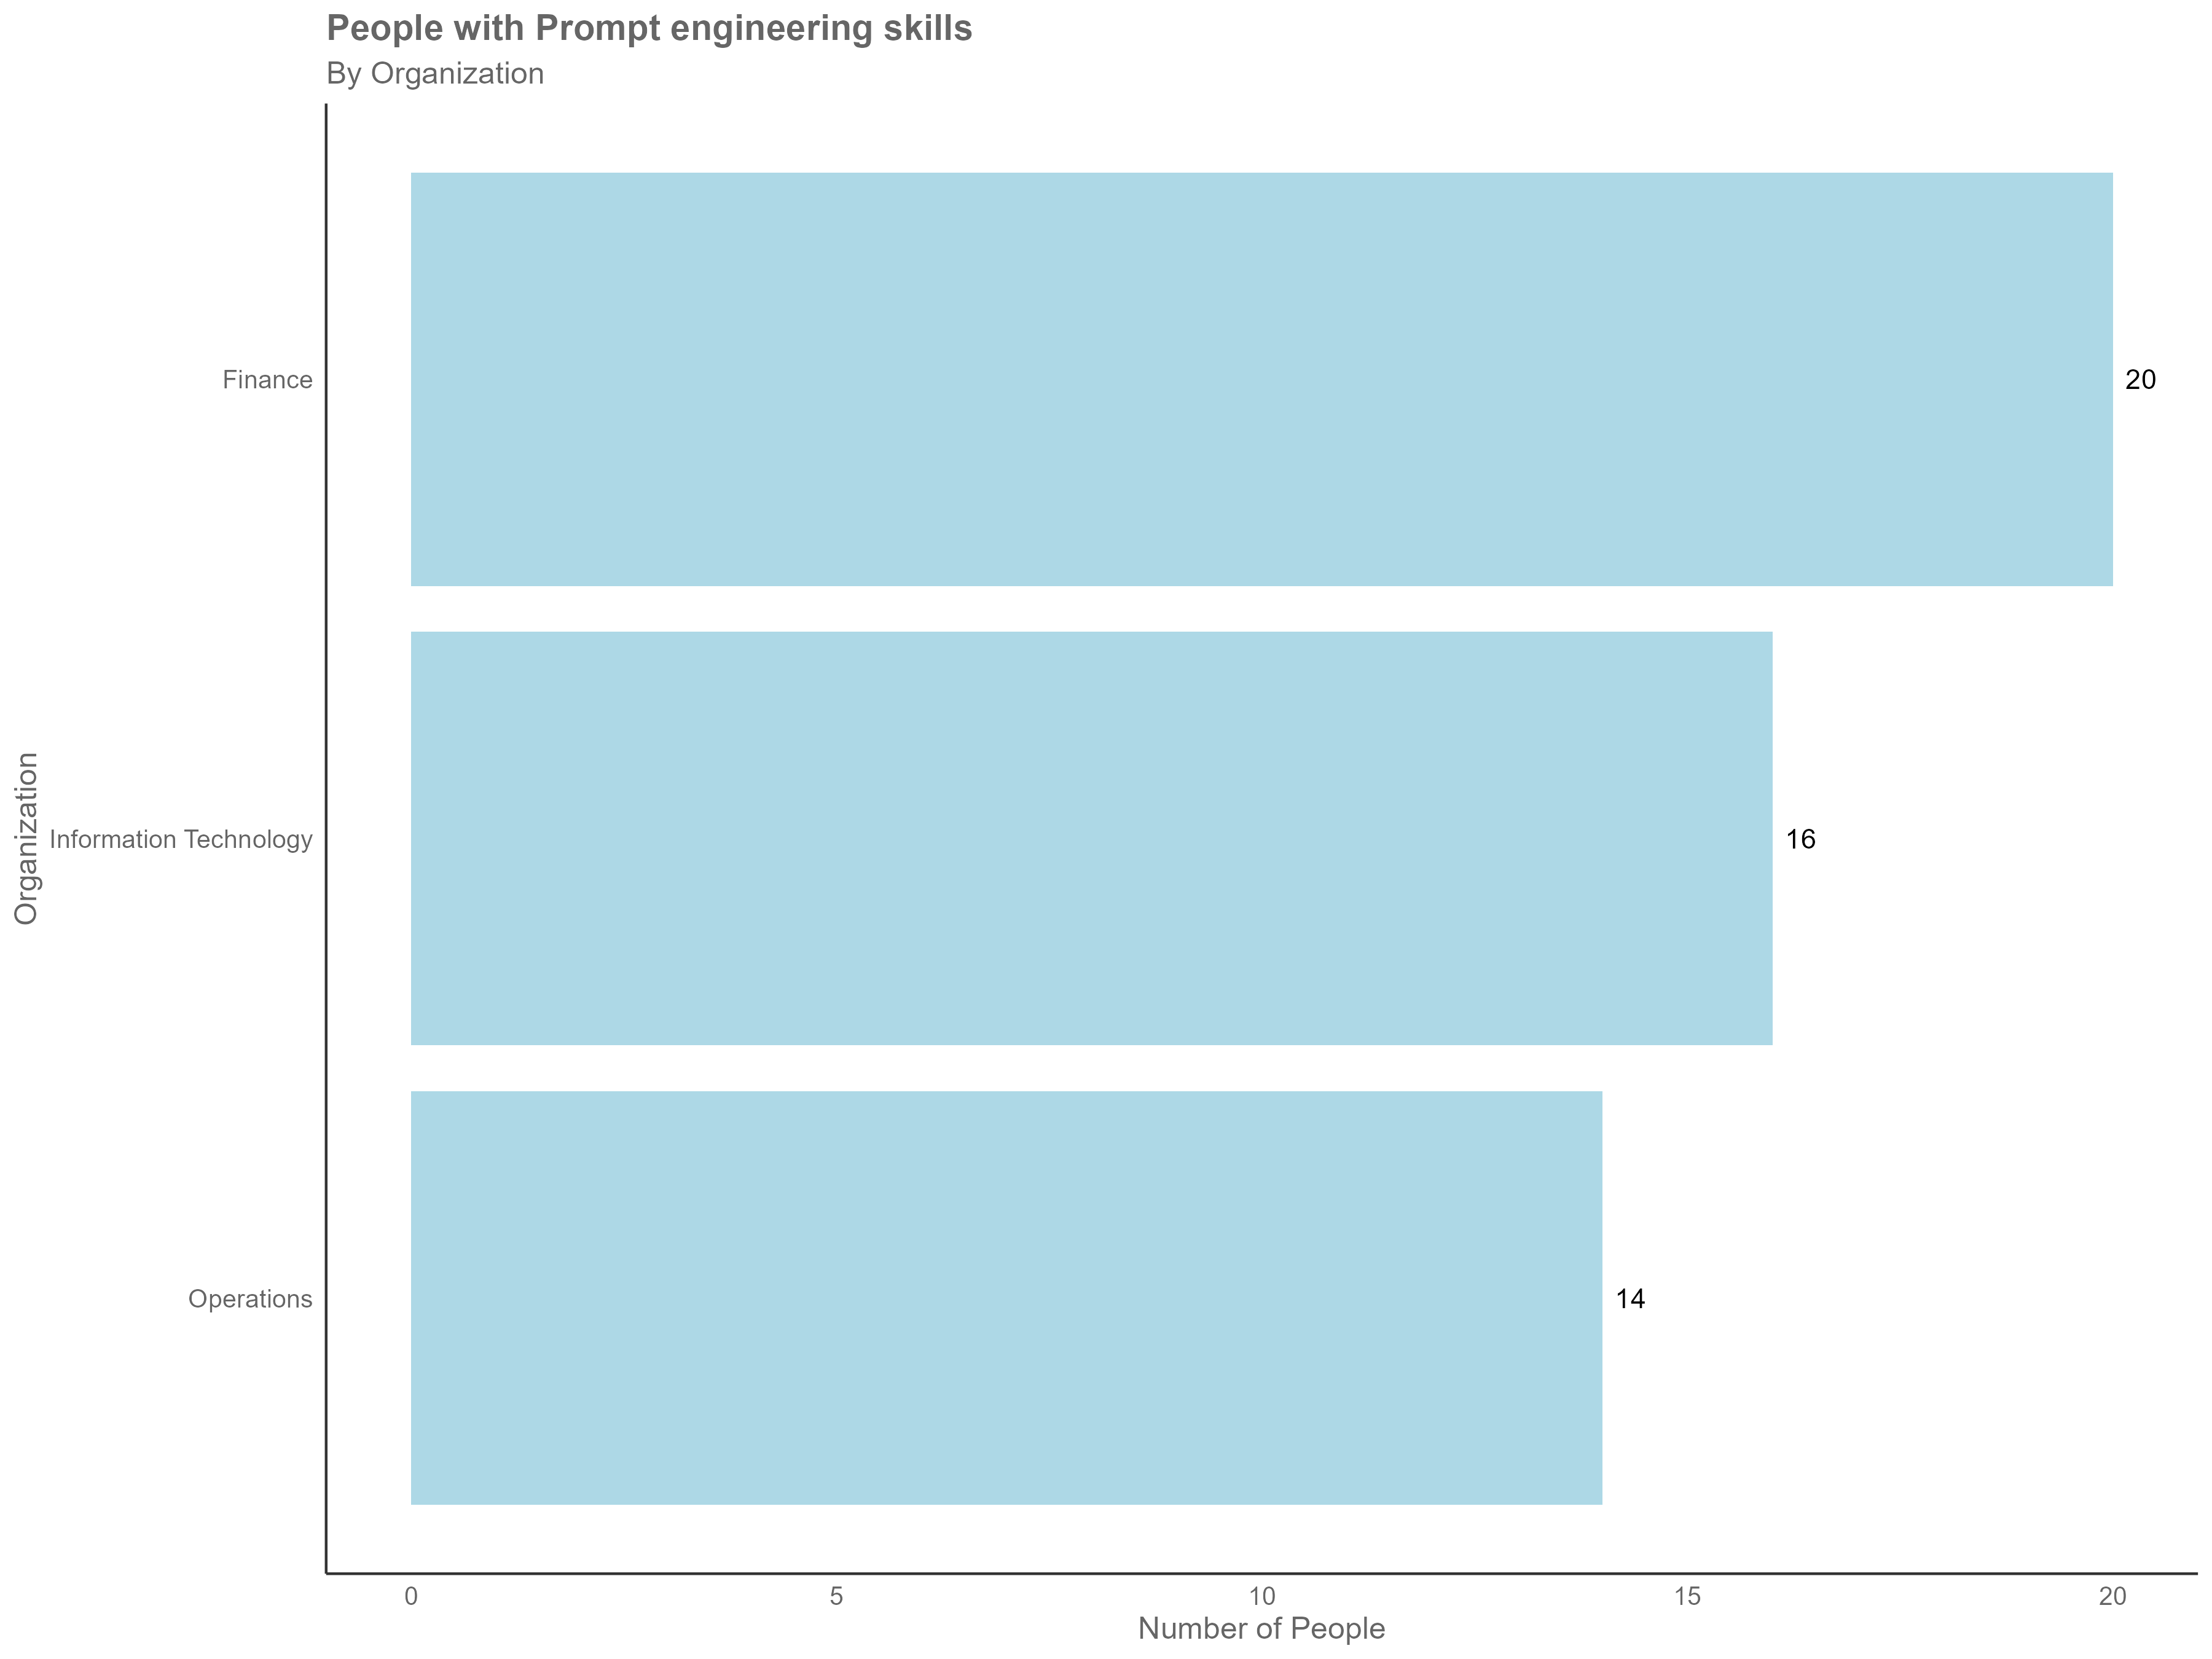
The above visual is based on sample data for demonstration purposes only and does not represent actual insights.
Python Implementation:
# Define target skill
target_skill = "Prompt engineering" # Update as appropriate

# Filter and analyze
scenario1_data = df_combined_skills[
    df_combined_skills['SkillName'].str.contains(target_skill, case=False, na=False)
].copy()

# Calculate results
people_count = scenario1_data['PersonId'].nunique()
total_instances = len(scenario1_data)
skill_matches = scenario1_data['SkillName'].unique()

# Breakdown by Organization
if people_count > 0:
    org_breakdown = (scenario1_data.groupby('Organization')['PersonId'] # Update `Organization` as appropriate
                     .nunique()
                     .sort_values(ascending=False)
                     .reset_index())
    org_breakdown.columns = ['Organization', 'People_Count'] # Update `Organization` as appropriate

    print(f"Found {people_count} people with {target_skill} skills")
    print(org_breakdown)

    # Visualization using vivainsights
    if len(org_breakdown) > 0:
        vi.create_bar_asis(
            data=org_breakdown,
            bar_var='People_Count',
            group_var='Organization', # Update `Organization` as appropriate
            title=f'People with {target_skill} by Organization' # Update `Organization` as appropriate
        )
Key Insights: This analysis helps you quickly identify where specific expertise exists in your organization and can inform decisions about team composition, training needs, or knowledge sharing initiatives.
Scenario 2: Broader Capability Assessment
Business Question: “How many people have skills in Artificial Intelligence, including all related subskills and adjacent capabilities?”
Why This Matters: Strategic capability planning often requires understanding broader skill categories, not just exact matches. This helps with workforce planning, identifying skill clusters, and understanding the full scope of organizational capabilities.
Methodology: This analysis demonstrates advanced techniques using the HierarchicalSkills and RelatedSkills tables to capture comprehensive skill families. We use hierarchical relationships and skill adjacency to create an expanded definition of AI-related capabilities.
R Implementation:
# Step 1: Find AI skills using hierarchy
target_area <- "Artificial Intelligence"

# Create long version of hierarchical skills for easier searching
df_HierSkills_long <- df_HierarchicalSkills %>%
  pivot_longer(
    cols = starts_with("Level"),
    names_to = "Level",
    values_to = "ChildSkillName"
  ) %>%
  filter(!is.na(ChildSkillName))

# Find main AI skills and subskills
ai_skills <- df_HierSkills_long %>%
  filter(str_detect(SkillName, regex(target_area, ignore_case = TRUE)) |
         str_detect(ChildSkillName, regex(target_area, ignore_case = TRUE))) %>%
  pull(SkillName) %>%
  unique()

# Step 2: Find related/adjacent skills
related_ai_skills <- df_RelatedSkills %>%
  filter(SkillName %in% ai_skills | RelatedSkillName %in% ai_skills) %>%
  {c(.$PrimarySkillName, .$SecondarySkillName)} %>%
  unique() %>%
  .[!is.na(.)]

# Combine all AI-related skills
all_ai_skills <- unique(c(ai_skills, related_ai_skills))

# Step 3: Analyze people with AI skills
scenario2_results <- df_combined_skills %>%
  filter(!is.na(SkillName), SkillName %in% all_ai_skills) %>%
  summarise(
    total_people = n_distinct(PersonId),
    total_skill_instances = n(),
    unique_skills_used = n_distinct(SkillName)
  )

# Top AI skills by usage
top_ai_skills <- df_combined_skills %>%
  filter(!is.na(SkillName), SkillName %in% all_ai_skills) %>%
  count(SkillName, sort = TRUE) %>%
  head(10)

cat("Found", length(all_ai_skills), "AI-related skills\n")
cat("Total people with AI skills:", scenario2_results$total_people, "\n")
print(top_ai_skills)

# Visualization
if(nrow(top_ai_skills) > 0) {
  p2 <- top_ai_skills %>%
    create_bar_asis(
      group_var = "SkillName",
      bar_var = "n",
      title = "Top AI-Related Skills by Usage"
    )
  print(p2)
}
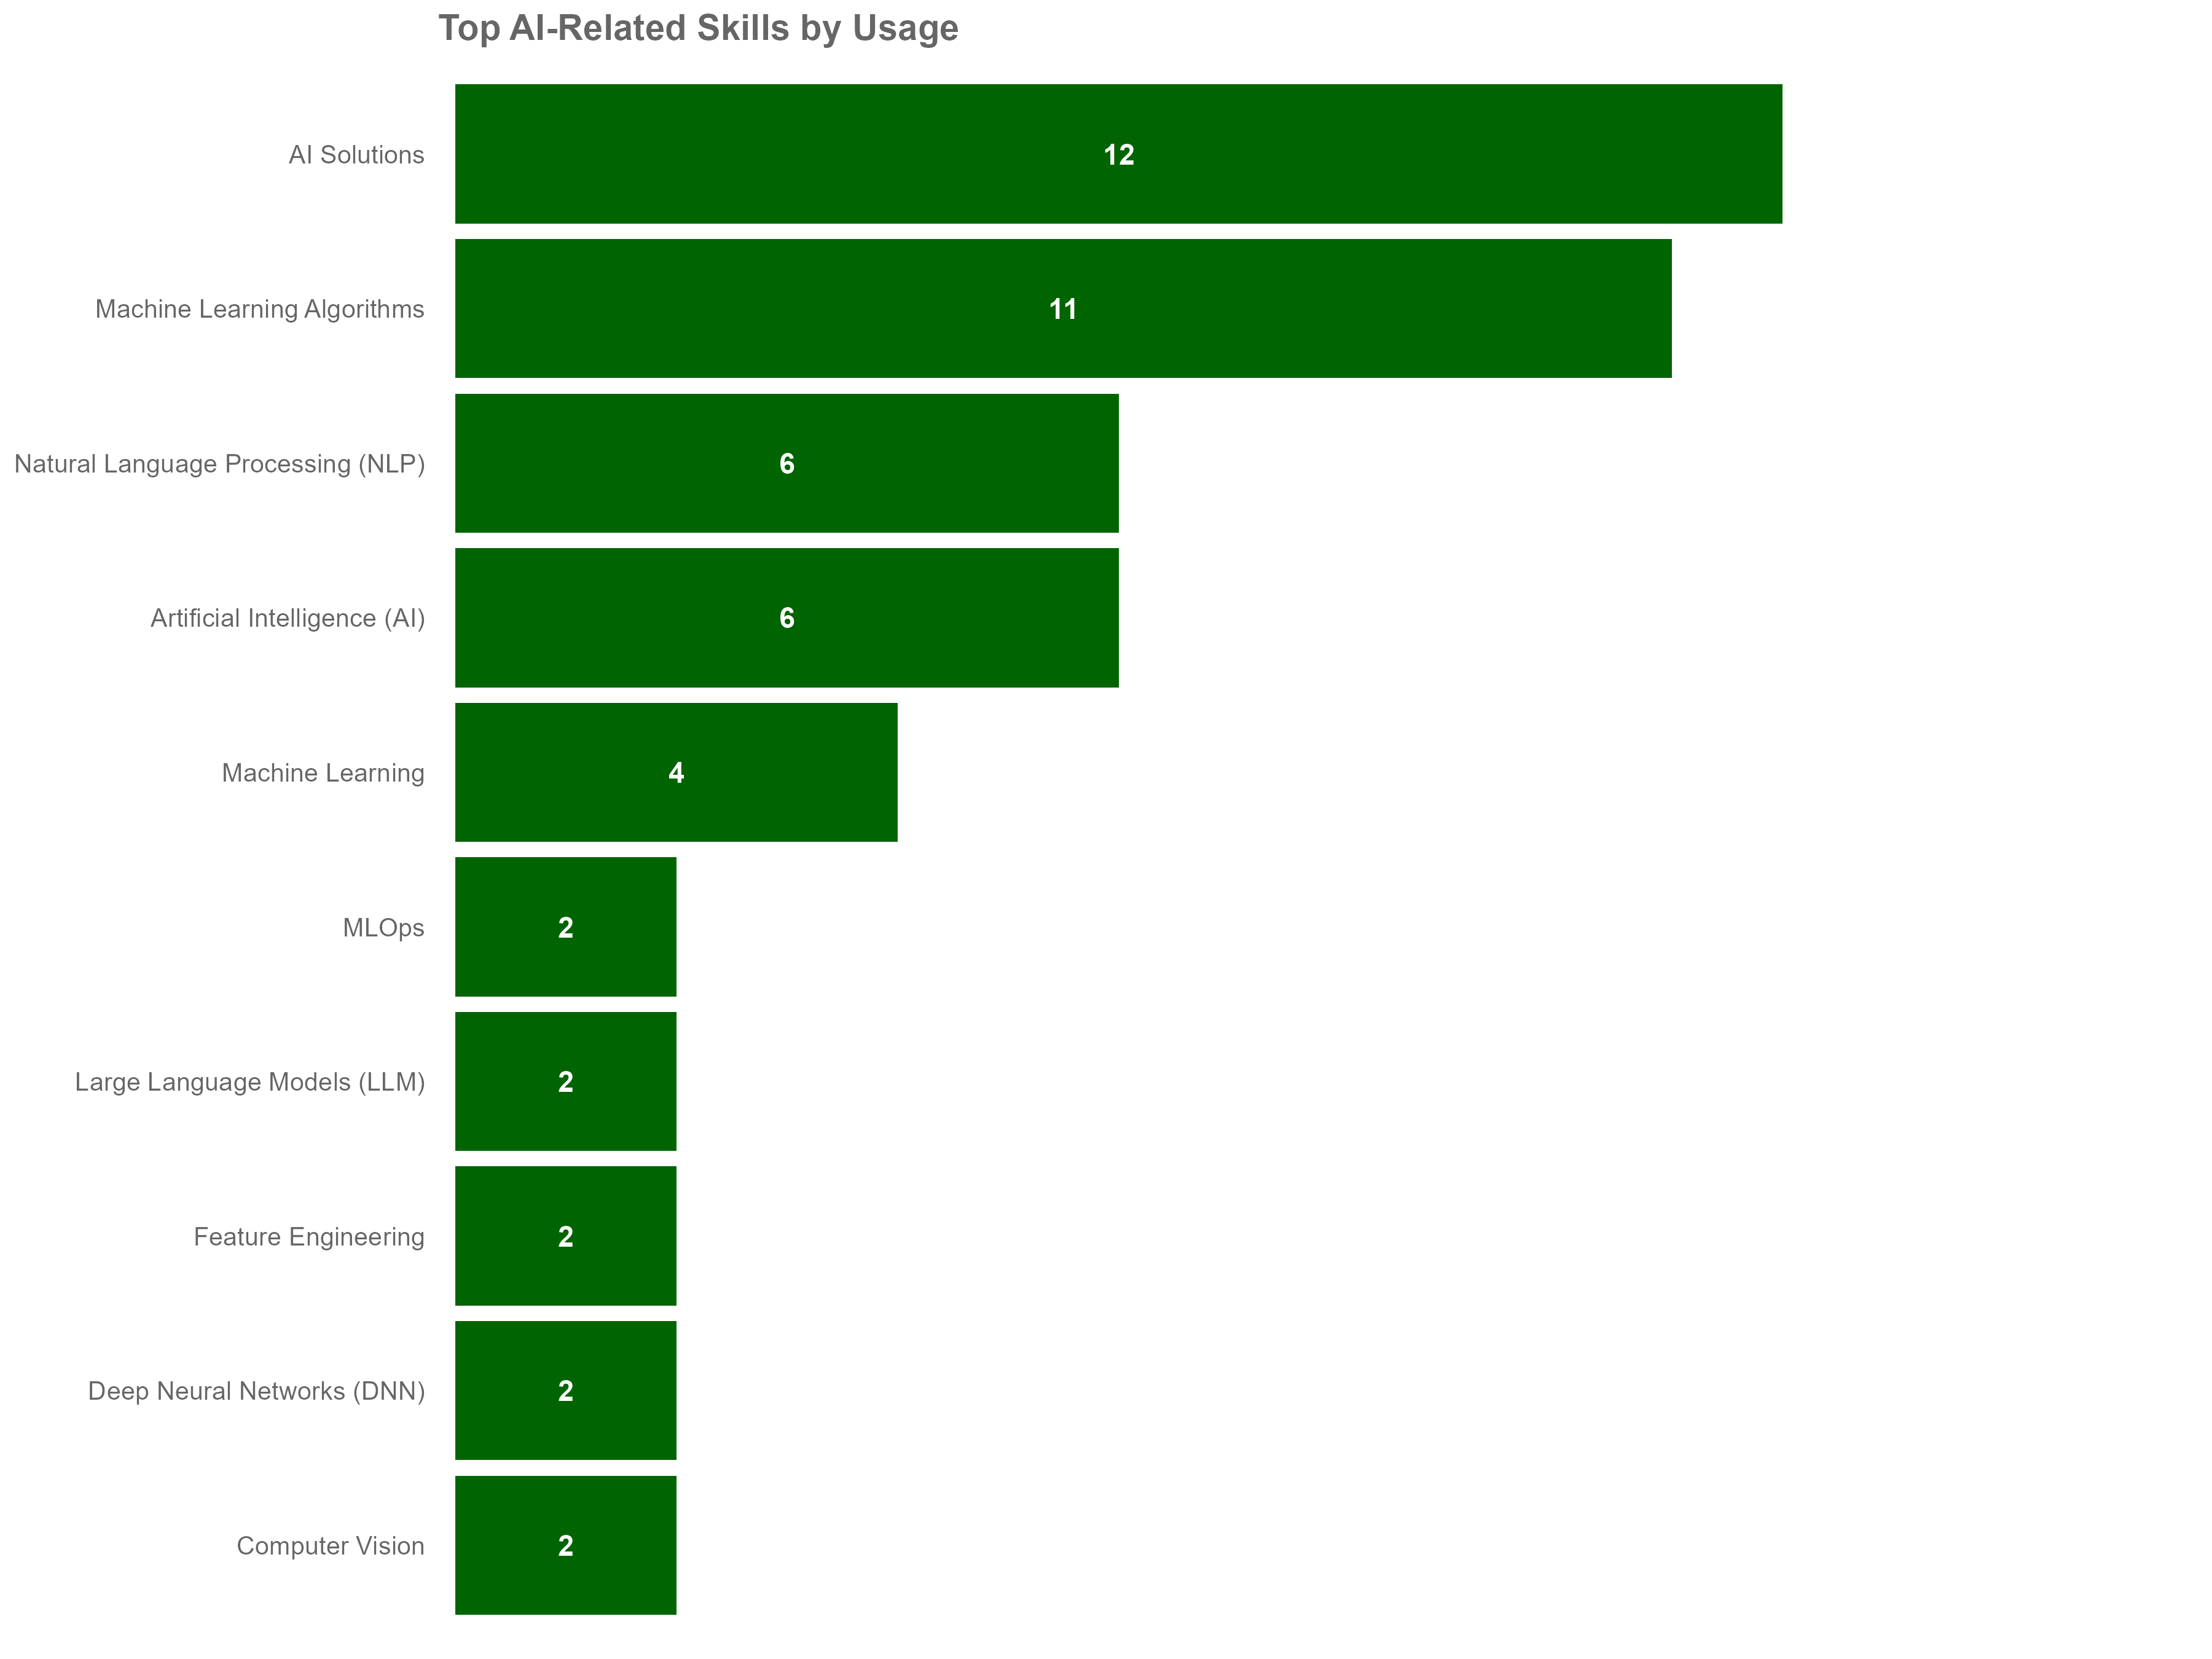
The above visual is based on sample data for demonstration purposes only and does not represent actual insights.
Python Implementation:
# Step 1: Find AI skills using hierarchy
target_area = "Artificial Intelligence"

# Search hierarchical skills for AI-related terms
ai_condition = (df_HierarchicalSkills['SkillName'].str.contains(target_area, case=False, na=False) |
                df_HierarchicalSkills.apply(lambda row: any(
                    str(row[col]).lower().find(target_area.lower()) != -1
                    for col in ['Level1', 'Level2', 'Level3', 'Level4', 'Level5']
                    if col in df_HierarchicalSkills.columns and pd.notna(row[col])
                ), axis=1))

ai_skills = df_HierarchicalSkills[ai_condition]['SkillName'].unique().tolist()

# Step 2: Find related skills (with error handling for column availability)
related_ai_skills = []
if 'SkillName' in df_RelatedSkills.columns and 'RelatedSkillName' in df_RelatedSkills.columns:
    related_condition = (df_RelatedSkills['SkillName'].isin(ai_skills) |
                         df_RelatedSkills['RelatedSkillName'].isin(ai_skills))

    # Extract skills from available columns
    related_skills_list = []
    for col in ['PrimarySkillName', 'SecondarySkillName']:
        if col in df_RelatedSkills.columns:
            related_skills_list.append(df_RelatedSkills[related_condition][col])

    if related_skills_list:
        related_ai_skills = pd.concat(related_skills_list).dropna().unique().tolist()

# Combine all AI-related skills
all_ai_skills = list(set(ai_skills + related_ai_skills))

# Step 3: Analyze people with AI skills
if all_ai_skills:
    ai_data = df_combined_skills[df_combined_skills['SkillName'].isin(all_ai_skills)].copy()

    total_people = ai_data['PersonId'].nunique()
    total_skill_instances = len(ai_data)
    unique_skills_used = ai_data['SkillName'].nunique()

    print(f"Found {len(all_ai_skills)} AI-related skills")
    print(f"Total people with AI skills: {total_people}")
    print(f"Total skill instances: {total_skill_instances}")

    # Top AI skills by usage
    if len(ai_data) > 0:
        top_ai_skills = ai_data['SkillName'].value_counts().head(10).reset_index()
        top_ai_skills.columns = ['SkillName', 'Count']

        print("\nTop 10 AI Skills by Usage:")
        print(top_ai_skills)

        # Visualization using vivainsights
        vi.create_bar_asis(
            data=top_ai_skills,
            bar_var='Count',
            group_var='SkillName',
            title='Top AI-Related Skills by Usage'
        )
Key Insights: This comprehensive approach ensures you don’t miss people with relevant AI skills due to narrow search criteria. It reveals the full ecosystem of AI-related capabilities in your organization.
Scenario 3: Skills Landscape Mapping
Business Question: “What are the top-level skill areas across our organization, and where do we have the most capability?”
Why This Matters: Leadership needs a strategic view of organizational strengths and potential gaps. This analysis rolls up detailed skills into broader capability areas for executive reporting and strategic planning.
Methodology: This analysis leverages the HierarchicalSkills table to group detailed skills into top-level categories (e.g., “Technology”, “Business Administration”). We aggregate people counts at this level to understand organizational capability distribution.
R Implementation:
# Join skills with hierarchy to get top-level categories
skill_landscape <- df_combined_skills %>%
  left_join(
    df_HierSkills_long %>% filter(Level == "Level1"),
    by = c("SkillName" = "SkillName")
  ) %>%
  filter(!is.na(ChildSkillName)) %>%  # Only include skills with hierarchy
  group_by(TopLevelSkill = ChildSkillName) %>%
  summarise(
    people_count = n_distinct(PersonId),
    skill_instances = n(),
    subskills_count = n_distinct(SkillName)
  ) %>%
  arrange(desc(people_count)) %>%
  head(15)

cat("Top 15 Skill Areas in Organization:\n")
print(skill_landscape)

# Summary metrics
cat("\nSummary:\n")
cat("Total unique top-level skills:", nrow(skill_landscape), "\n")
if(nrow(skill_landscape) > 0) {
  cat("Top skill area:", skill_landscape$TopLevelSkill[1],
      "(", skill_landscape$people_count[1], "people)\n")
}

# Visualization
if(nrow(skill_landscape) > 0) {
  p3 <- skill_landscape %>%
    create_bar_asis(
      group_var = "TopLevelSkill",
      bar_var = "people_count",
      title = "Top Skill Areas by Number of People"
    )
  print(p3)
}
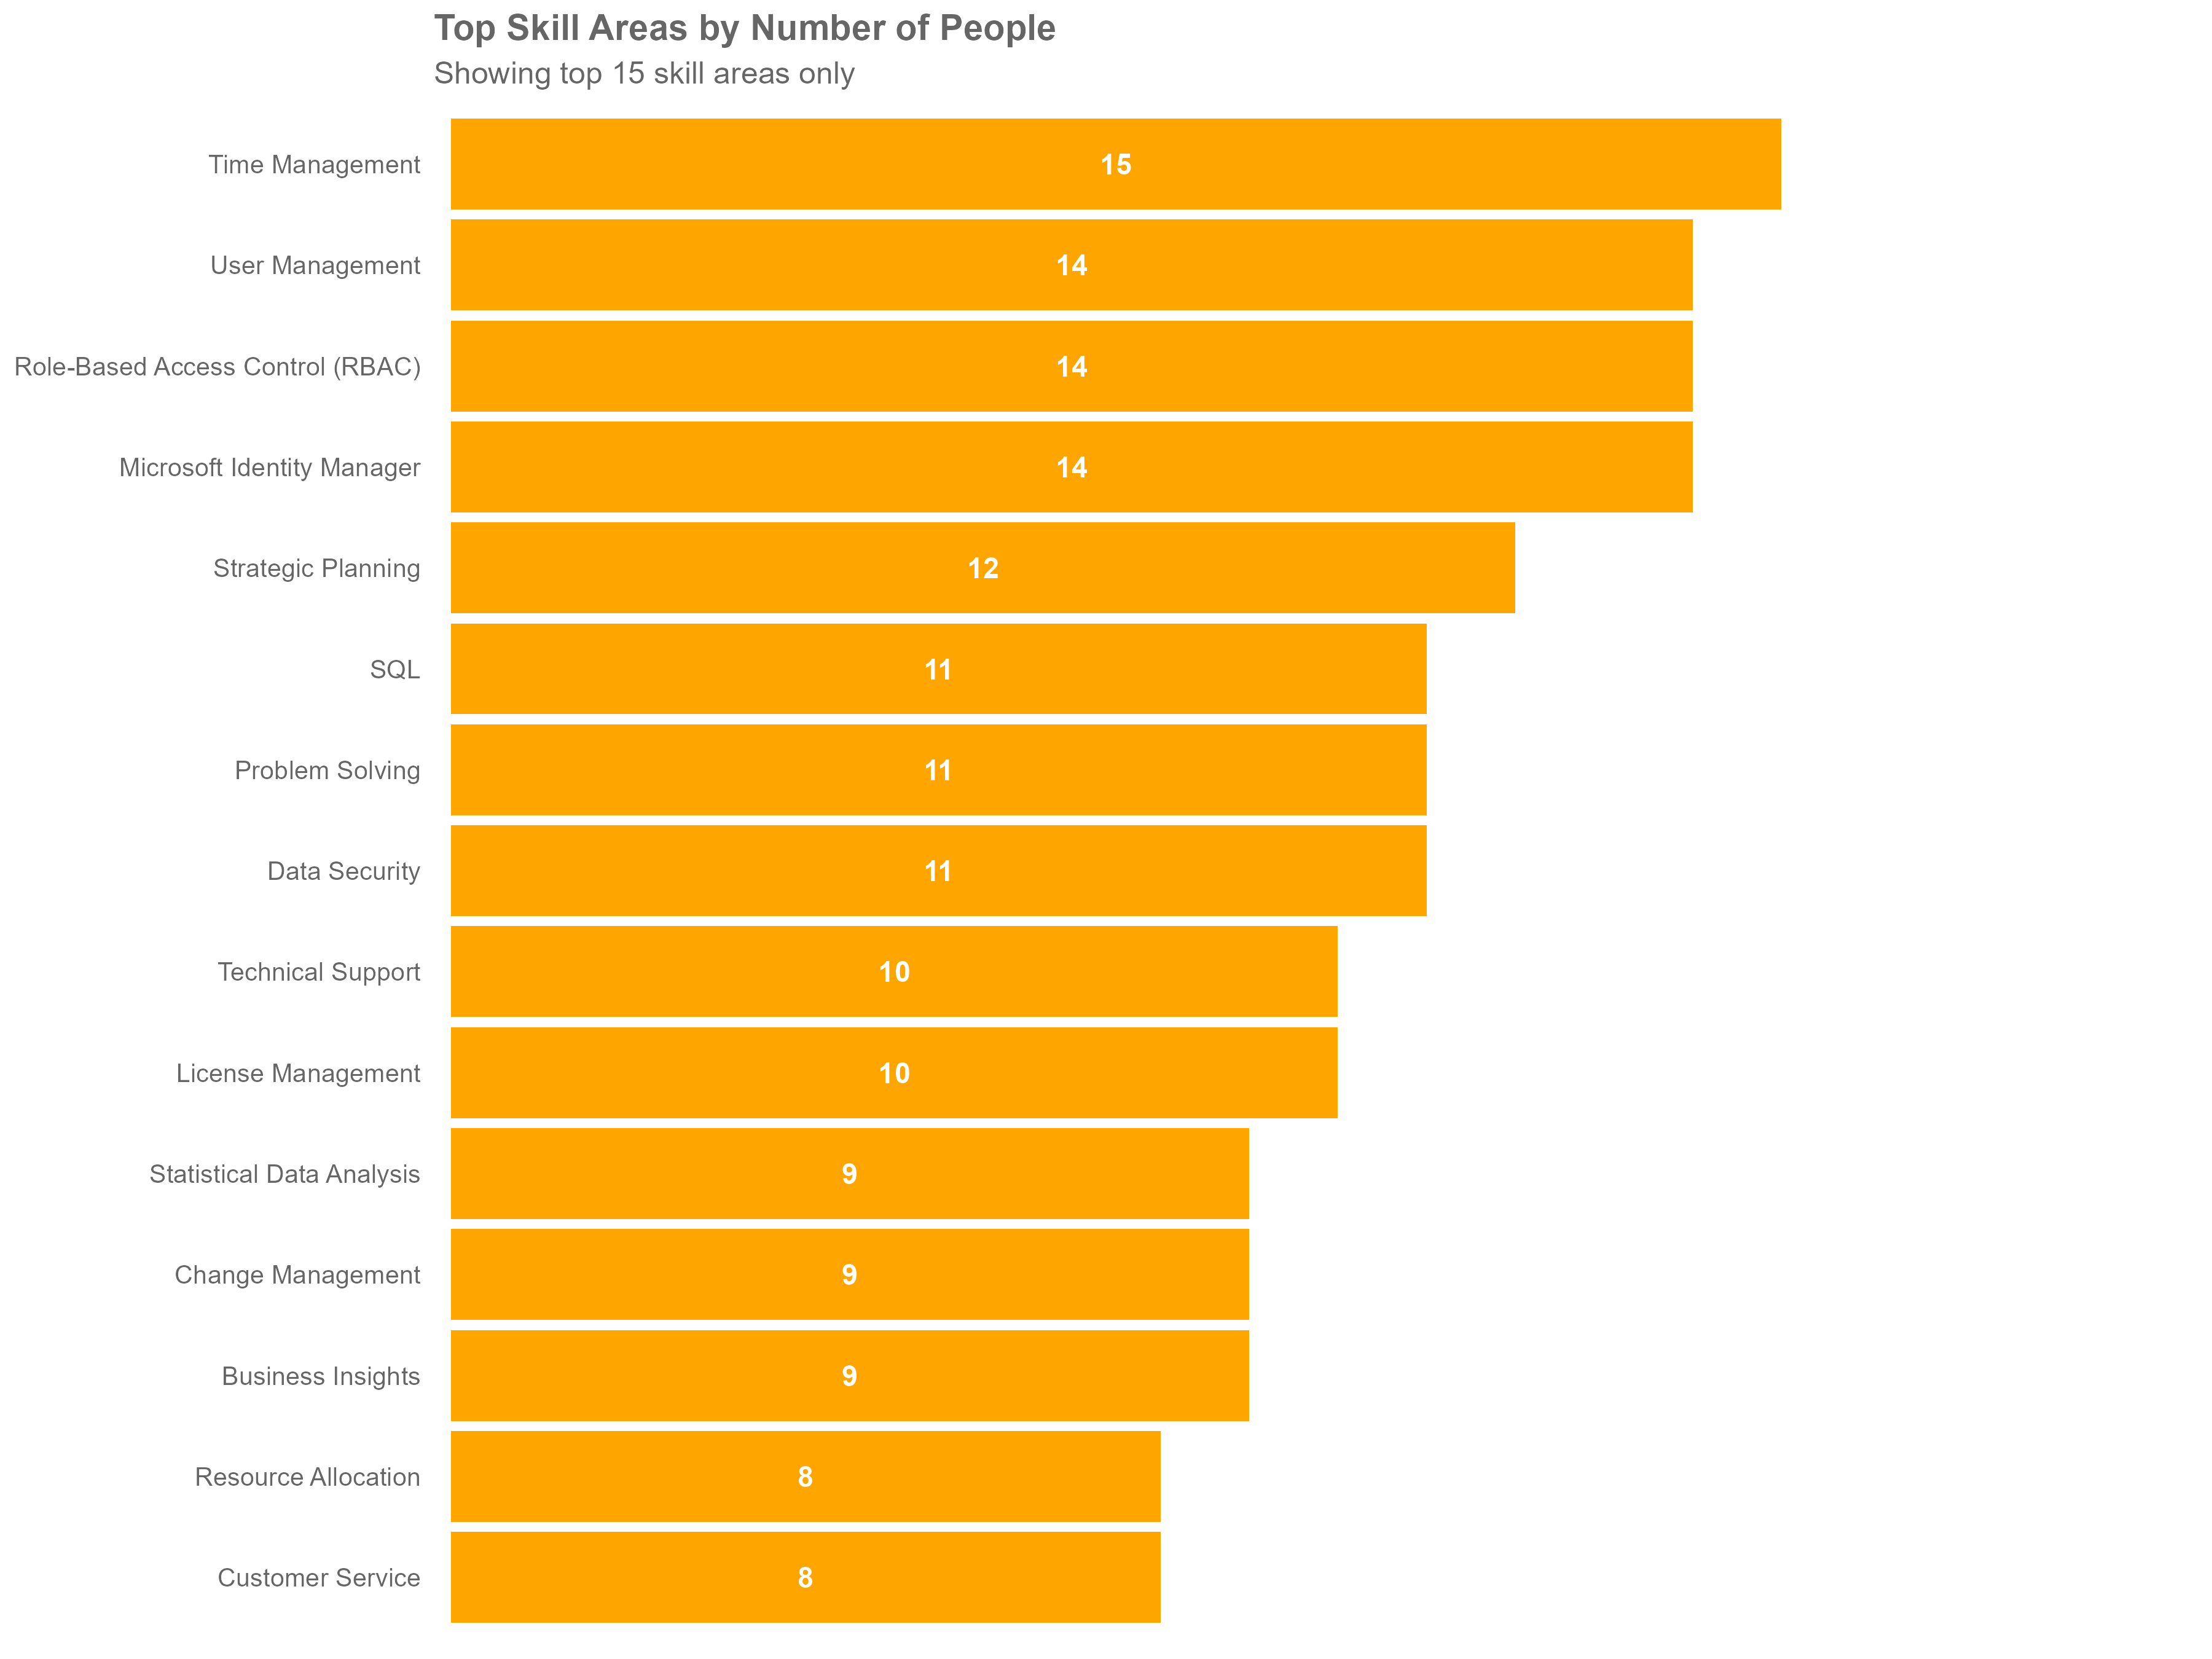
The above visual is based on sample data for demonstration purposes only and does not represent actual insights.
Python Implementation:
# Analyze skills landscape using hierarchy
valid_skills = df_combined_skills[df_combined_skills['SkillName'].notna()].copy()

# Join with hierarchy to get parent skills
skills_with_hierarchy = valid_skills.merge(
    df_HierarchicalSkills[['SkillName', 'Level1']],
    on='SkillName',
    how='left'
)

# Group by top-level skill (Level1 or skill itself if no parent)
skills_with_hierarchy['TopLevelSkill'] = skills_with_hierarchy['Level1'].fillna(skills_with_hierarchy['SkillName'])

skill_landscape = (skills_with_hierarchy.groupby('TopLevelSkill')
                   .agg({
                       'PersonId': 'nunique',
                       'SkillName': ['count', 'nunique']
                   })
                   .round(0))

# Flatten column names
skill_landscape.columns = ['people_count', 'skill_instances', 'subskills_count']
skill_landscape = skill_landscape.reset_index().sort_values('people_count', ascending=False).head(15)

print("Top 15 Skill Areas in Organization:")
print(skill_landscape)

# Summary metrics
print(f"\nSummary:")
print(f"Total unique top-level skills: {skill_landscape.shape[0]}")
if len(skill_landscape) > 0:
    print(f"Top skill area: {skill_landscape.iloc[0]['TopLevelSkill']} ({skill_landscape.iloc[0]['people_count']} people)")

# Visualization using vivainsights
vi.create_bar_asis(
    data=skill_landscape,
    bar_var='people_count',
    group_var='TopLevelSkill',
    title='Top Skill Areas by Number of People'
)
Key Insights: This strategic view helps leadership understand where the organization has deep capabilities and potential areas for investment or acquisition. It’s particularly valuable for capability-based strategic planning.
Scenario 4: Talent Well-being Analysis
Business Question: “Are employees with critical AI skills showing signs of being overworked, and should we be concerned about retention?”
Why This Matters: High-value technical talent is often in high demand and at risk of burnout. By combining skills data with collaboration patterns, you can proactively identify at-risk talent and implement retention strategies.
Methodology: This analysis combines skills identification with collaboration metrics from Viva Insights. We compare after-hours collaboration patterns between AI-skilled and non-AI-skilled employees to identify potential well-being concerns.
Note: Collaboration metrics such as after-hours collaboration hours require a separate custom query. Use PersonId as the primary join key to combine these results with Skills query outputs for analysis.
R Implementation:
# Analyze well-being by AI skills (person-level analysis)
talent_wellbeing <- df_combined_skills %>%
  filter(!is.na(SkillName)) %>%
  group_by(PersonId) %>%
  summarise(
    has_ai_skills = any(SkillName %in% all_ai_skills),
    avg_after_hours = mean(After_hours_collaboration_hours, na.rm = TRUE),
    organization = first(Organization),
    .groups = "drop"
  )

# Summary comparison
scenario4_summary <- talent_wellbeing %>%
  group_by(has_ai_skills) %>%
  summarise(
    people_count = n(),
    avg_after_hours = round(mean(avg_after_hours, na.rm = TRUE), 1),
    median_after_hours = round(median(avg_after_hours, na.rm = TRUE), 1),
    .groups = "drop"
  ) %>%
  mutate(skill_group = ifelse(has_ai_skills, "Has AI Skills", "No AI Skills"))

cat("After-hours Collaboration Comparison:\n")
print(scenario4_summary %>% select(skill_group, people_count, avg_after_hours, median_after_hours))

# Statistical test
ai_hours <- talent_wellbeing %>% filter(has_ai_skills) %>% pull(avg_after_hours)
non_ai_hours <- talent_wellbeing %>% filter(!has_ai_skills) %>% pull(avg_after_hours)

if(length(ai_hours) > 1 & length(non_ai_hours) > 1) {
  t_test_result <- t.test(ai_hours, non_ai_hours)
  cat("\nStatistical Test Results:\n")
  cat("Difference in means:", round(mean(ai_hours) - mean(non_ai_hours), 2), "hours\n")
  cat("P-value:", round(t_test_result$p.value, 4), "\n")
  cat("Significant?", ifelse(t_test_result$p.value < 0.05, "YES", "NO"), "\n")
}

# Visualization
if(nrow(scenario4_summary) > 1) {
  p4 <- scenario4_summary %>%
    create_bar_asis(
      group_var = "skill_group",
      bar_var = "avg_after_hours",
      title = "Average After-hours Collaboration by AI Skills"
    )
  print(p4)
}
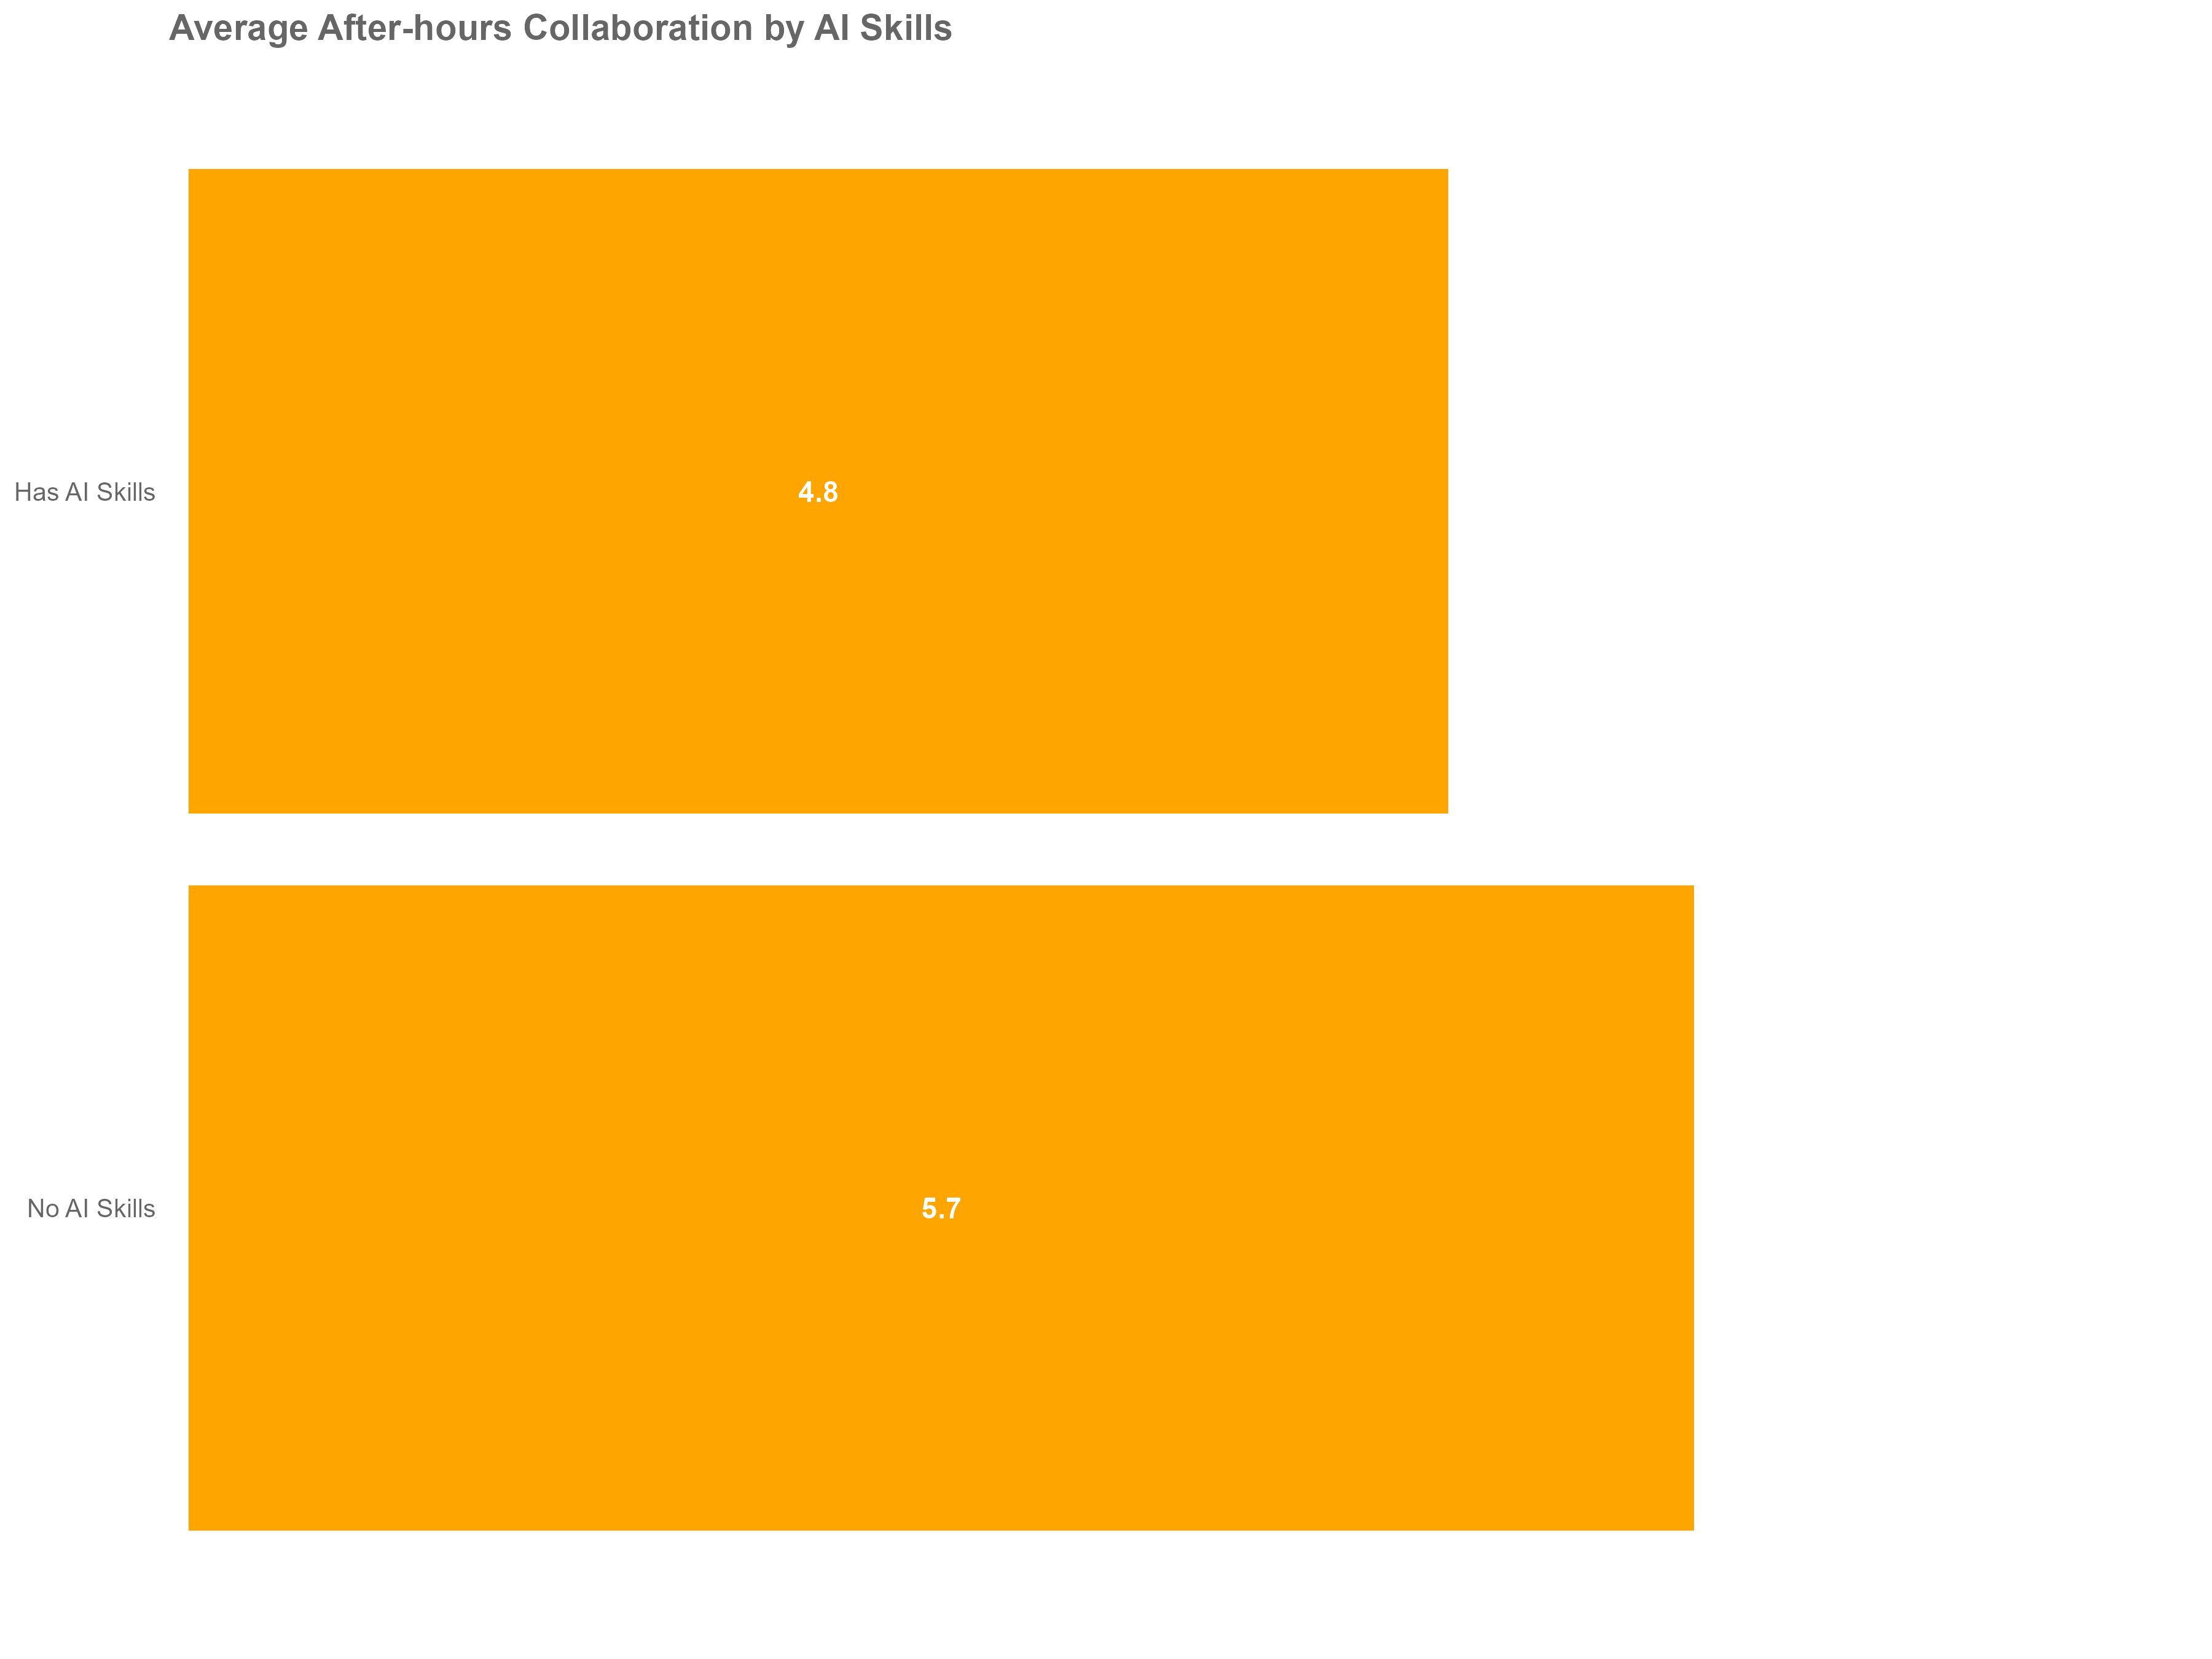
The above visual is based on sample data for demonstration purposes only and does not represent actual insights.
Python Implementation:
# Analyze well-being by AI skills (person-level analysis)
if all_ai_skills:
    talent_wellbeing = (df_combined_skills.groupby('PersonId')
                        .agg({
                            'SkillName': lambda x: any(skill in all_ai_skills for skill in x if pd.notna(skill)),
                            'After_hours_collaboration_hours': 'mean',
                            'Organization': 'first'
                        })
                        .reset_index())

    talent_wellbeing.columns = ['PersonId', 'has_ai_skills', 'avg_after_hours', 'organization']

    # Summary comparison
    scenario4_summary = (talent_wellbeing.groupby('has_ai_skills')
                         .agg({
                             'PersonId': 'count',
                             'avg_after_hours': ['mean', 'median']
                         })
                         .round(1)
                         .reset_index())

    # Flatten column names
    scenario4_summary.columns = ['has_ai_skills', 'people_count', 'avg_after_hours', 'median_after_hours']
    scenario4_summary['skill_group'] = scenario4_summary['has_ai_skills'].map({True: 'Has AI Skills', False: 'No AI Skills'})

    print("After-hours Collaboration Comparison:")
    print(scenario4_summary[['skill_group', 'people_count', 'avg_after_hours', 'median_after_hours']])

    # Statistical test
    ai_skills_actions = talent_wellbeing[talent_wellbeing['has_ai_skills']]['avg_after_hours']
    non_ai_actions = talent_wellbeing[~talent_wellbeing['has_ai_skills']]['avg_after_hours']

    if len(ai_skills_actions) > 1 and len(non_ai_actions) > 1:
        t_stat, p_value = stats.ttest_ind(ai_skills_actions, non_ai_actions)

        print(f"\nStatistical Test Results:")
        print(f"Difference in means: {ai_skills_actions.mean() - non_ai_actions.mean():.2f} hours")
        print(f"P-value: {p_value:.4f}")
        print(f"Significant? {'YES' if p_value < 0.05 else 'NO'}")

    # Visualization using vivainsights
    if len(scenario4_summary) > 1:
        vi.create_bar_asis(
            data=scenario4_summary,
            bar_var='avg_after_hours',
            group_var='skill_group',
            title='Average After-hours Collaboration by AI Skills'
        )
Key Insights: This analysis identifies potential burnout risks among your most valuable technical talent, enabling proactive retention strategies and workload management.
Scenario 5: Technology Adoption Insights
Business Question: “Are employees with AI-related skills more likely to adopt new AI tools like Copilot? Can skills predict technology adoption patterns?”
Why This Matters: Understanding the relationship between existing skills and new tool adoption helps inform training strategies, rollout approaches, and technology investment decisions. It also validates assumptions about user behavior.
Methodology: This analysis combines skills classification with technology usage metrics to test hypotheses about adoption patterns. We use statistical testing to determine if observed differences are significant and actionable.
Note: Copilot usage metrics such as Total Copilot actions taken require a separate custom query. Use PersonId as the primary join key to combine these results with Skills query outputs for analysis.
R Implementation:
# Analyze Copilot adoption by AI skills
copilot_analysis <- df_combined_skills %>%
  filter(!is.na(SkillName)) %>%
  group_by(PersonId) %>%
  summarise(
    has_ai_skills = any(str_detect(SkillName,
                                  regex("prompt engineering|\\bAI\\b|artificial intelligence",
                                        ignore_case = TRUE))),
    total_copilot_actions = mean(Total_Copilot_actions_taken, na.rm = TRUE),
    organization = first(Organization)
  )

# Summary statistics by skill group
copilot_summary <- copilot_analysis %>%
  group_by(has_ai_skills) %>%
  summarise(
    people_count = n(),
    avg_copilot_actions = round(mean(total_copilot_actions, na.rm = TRUE), 1),
    median_copilot_actions = round(median(total_copilot_actions, na.rm = TRUE), 1),
    sd_copilot_actions = round(sd(total_copilot_actions, na.rm = TRUE), 1)
  ) %>%
  mutate(skill_group = ifelse(has_ai_skills, "Has AI-related Skills", "No AI-related Skills"))

cat("Copilot Adoption Analysis:\n")
print(copilot_summary %>% select(skill_group, people_count, avg_copilot_actions, median_copilot_actions))

# Statistical test
ai_actions <- copilot_analysis %>% filter(has_ai_skills) %>% pull(total_copilot_actions)
non_ai_actions <- copilot_analysis %>% filter(!has_ai_skills) %>% pull(total_copilot_actions)

if(length(ai_actions) > 1 & length(non_ai_actions) > 1) {
  t_test_result <- t.test(ai_actions, non_ai_actions)

  cat("\nStatistical Analysis:\n")
  cat("AI skills group mean:", round(mean(ai_actions), 1), "actions\n")
  cat("No AI skills group mean:", round(mean(non_ai_actions), 1), "actions\n")
  cat("Difference:", round(mean(ai_actions) - mean(non_ai_actions), 1), "actions\n")
  cat("P-value:", round(t_test_result$p.value, 4), "\n")
  cat("Statistically significant?", ifelse(t_test_result$p.value < 0.05, "YES", "NO"), "\n")
}

# Visualization
if(nrow(copilot_summary) > 1) {
  p5 <- copilot_summary %>%
    create_bar_asis(
      group_var = "skill_group",
      bar_var = "avg_copilot_actions",
      title = "Average Copilot Actions by Skill Category"
    )
  print(p5)
}
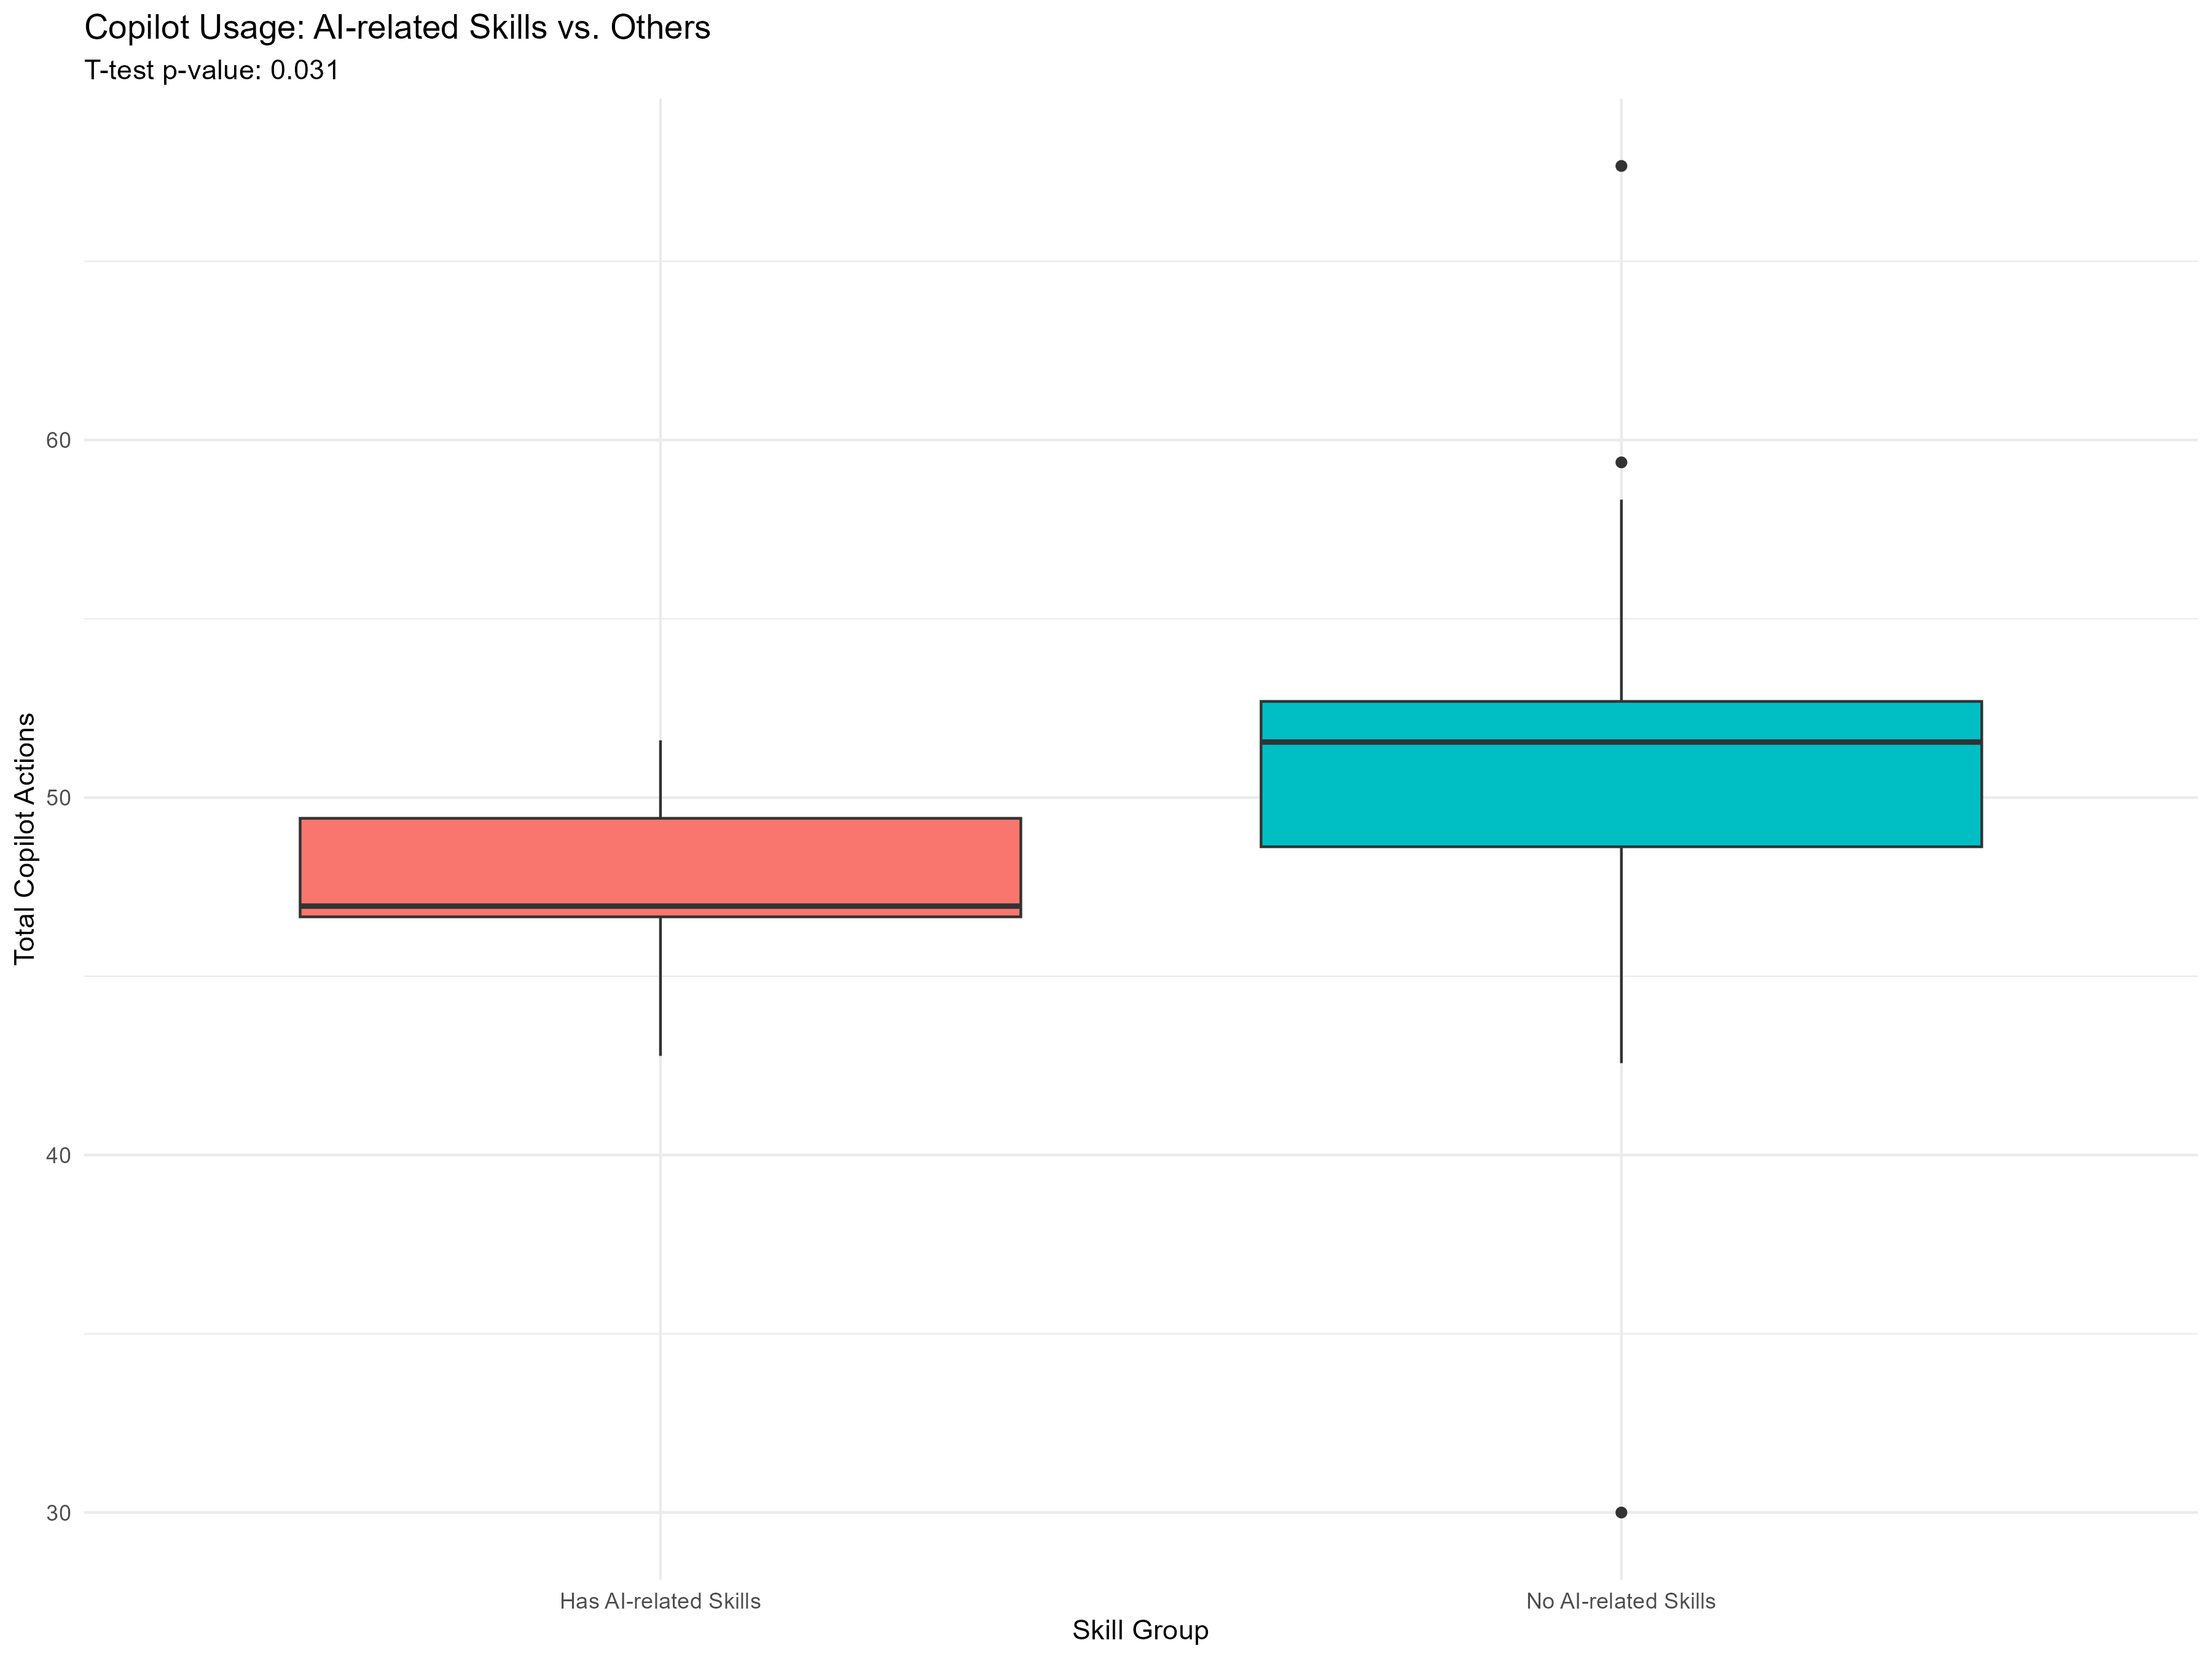
The above visual is based on sample data for demonstration purposes only and does not represent actual insights.
Python Implementation:
# Analyze Copilot adoption by AI-related skills
copilot_adoption = (df_combined_skills.groupby('PersonId')
                    .agg({
                        'SkillName': lambda x: any(
                            pd.notna(skill) and any(term in str(skill).lower()
                            for term in ['prompt engineering', 'ai', 'artificial intelligence'])
                            for skill in x
                        ),
                        'Total_Copilot_actions_taken': 'mean',
                        'Organization': 'first'
                    })
                    .reset_index())

# Flatten column names
copilot_adoption.columns = ['PersonId', 'has_ai_skills', 'total_copilot_actions', 'organization']

# Summary statistics by skill group
copilot_summary = (copilot_adoption.groupby('has_ai_skills')
                   .agg({
                       'PersonId': 'count',
                       'total_copilot_actions': ['mean', 'median', 'std']
                   })
                   .round(1)
                   .reset_index())

# Flatten column names
copilot_summary.columns = ['has_ai_skills', 'people_count', 'avg_copilot_actions', 'median_copilot_actions', 'sd_copilot_actions']
copilot_summary['skill_group'] = copilot_summary['has_ai_skills'].map({True: 'Has AI-related Skills', False: 'No AI-related Skills'})

print("Copilot Adoption Analysis:")
print(copilot_summary[['skill_group', 'people_count', 'avg_copilot_actions', 'median_copilot_actions']])

# Statistical test
ai_skills_actions = copilot_adoption[copilot_adoption['has_ai_skills']]['total_copilot_actions']
non_ai_actions = copilot_adoption[~copilot_adoption['has_ai_skills']]['total_copilot_actions']

if len(ai_skills_actions) > 1 and len(non_ai_actions) > 1:
    t_stat, p_value = stats.ttest_ind(ai_skills_actions, non_ai_actions)

    print(f"\nStatistical Analysis:")
    print(f"AI skills group mean: {ai_skills_actions.mean():.1f} actions")
    print(f"No AI skills group mean: {non_ai_actions.mean():.1f} actions")
    print(f"Difference: {ai_skills_actions.mean() - non_ai_actions.mean():.1f} actions")
    print(f"P-value: {p_value:.4f}")
    print(f"Statistically significant? {'YES' if p_value < 0.05 else 'NO'}")

# Visualization using vivainsights
if len(copilot_summary) > 1:
    vi.create_bar_asis(
        data=copilot_summary,
        bar_var='avg_copilot_actions',
        group_var='skill_group',
        title='Average Copilot Actions by Skill Category'
    )
Key Insights: This analysis validates or challenges assumptions about technology adoption patterns and can inform targeted training programs, rollout strategies, and technology investment decisions.
Conclusion and Next Steps
What You’ve Accomplished
Through this tutorial, you’ve learned how to:
✅ Set up a comprehensive skills analysis environment in both R and Python
✅ Join multiple People Skill data sources to create analyzable datasets
✅ Answer strategic business questions using data-driven approaches
✅ Use advanced techniques like hierarchical skill navigation and statistical testing
✅ Create compelling visualizations for stakeholder communication
Adapting These Analyses for Your Organization
To customize these analyses for your organizational context, you can:
- replace skill categories and hierarchies with your organization’s specific taxonomy,
- add organizational filters for department-specific analysis, and
- incorporate additional Viva Insights metrics for richer insights.
Beyond basic customization, you can extend the analysis by:
- implementing time series analysis using the
MetricDatecolumn for trend analysis, - building predictive models to forecast skill development or attrition,
- conducting network analysis to understand skill relationships and knowledge flow, and
- creating automated reporting systems using these analysis patterns.
Resources for Continued Learning
Microsoft Viva Insights:
Technical Resources:
- R: vivainsights R package
- Python: vivainsights Python package
- General:
Getting Help
If you encounter issues or want to extend these analyses:
- Check the package documentation for your chosen platform
- Join the Viva Insights community for best practices and troubleshooting
- Consider reaching out to your organization’s Viva Insights champions
This tutorial provides a foundation for skills-based organizational analysis. The specific insights and actions will depend on your organization’s context, but the analytical approaches demonstrated here are broadly applicable across industries and use cases.