Advanced analytics · Network
Network Analysis
Organizational network analysis (ONA) with Viva Insights. Visualize and analyze collaboration networks at the group-to-group and person-to-person level in R and Python.
Network Analysis Scripts
Organizational Network Analysis (ONA) maps the relationships and interactions between people, teams, and departments based on actual collaboration patterns, rather than formal reporting structures — revealing the informal networks that drive real work and innovation, in ways a traditional org chart cannot. See Key Use Cases for Network Analysis further down the page for the full range of ways this is applied.
Viva Insights makes network metrics available through four query types. Sample scripts on this page currently cover two of them — pick a card to jump straight to one, or read on for the full picture.
Group-to-Group Network Analysis
Customizing Group-to-Group Networks
- Purpose: Create customized group-to-group collaboration network visualizations
- Format: R Markdown
- Prerequisites: vivainsights R package, igraph, ggplot2
- Key Features: Custom styling, filtering, layout algorithms, export options
- 📥 Download
- Purpose: Create customized group-to-group collaboration network visualizations
- Prerequisites: vivainsights Python package, networkx, matplotlib
- Key Features: Custom styling, filtering, layout algorithms, export options
- 📥 Download
Extended Group-to-Group Analysis (R)
A deeper walkthrough of network_g2g(): interaction matrices, igraph objects, sankey visualizations, and overlaying organizational colours and sizes onto the network plot.
- Purpose: Group-based organizational network analysis
- Language: R
- Prerequisites: vivainsights R package, igraph, dplyr
- Key Features: Inter-group dynamics, group-level metrics, comparative analysis
- 📥 Download
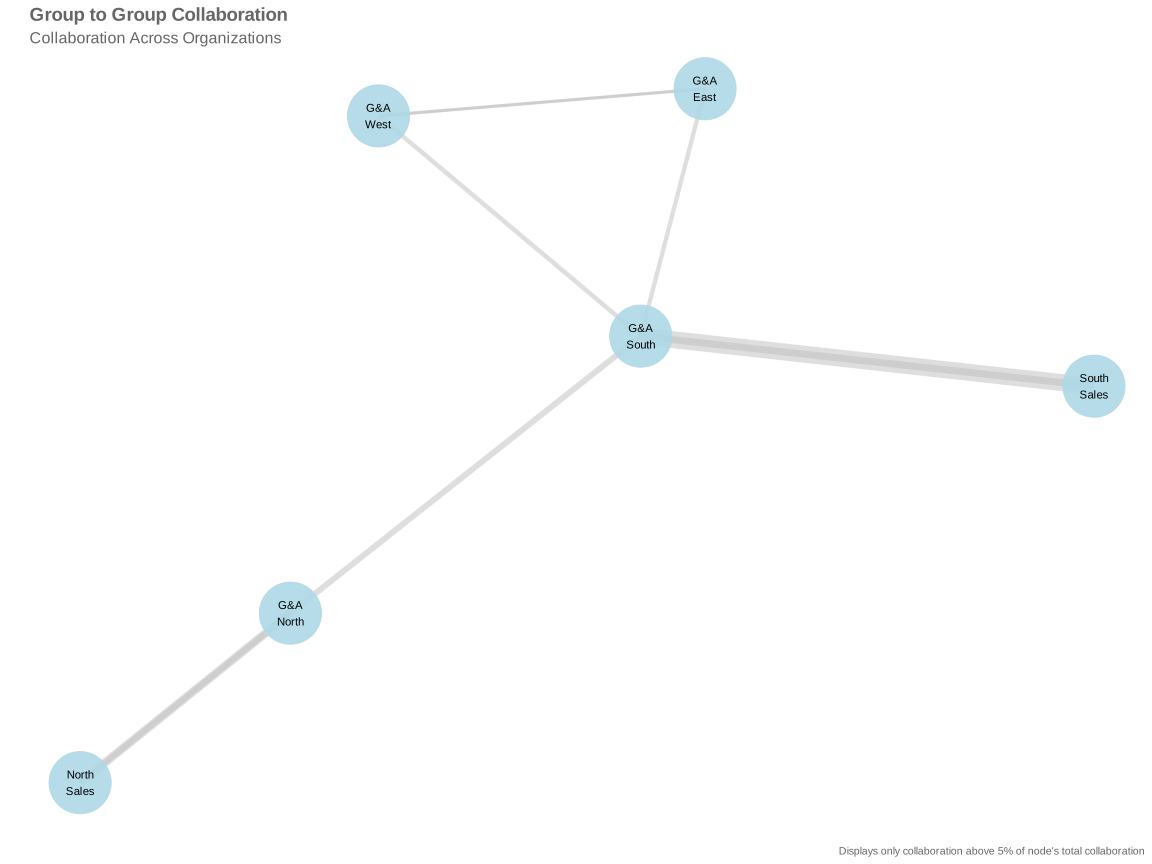
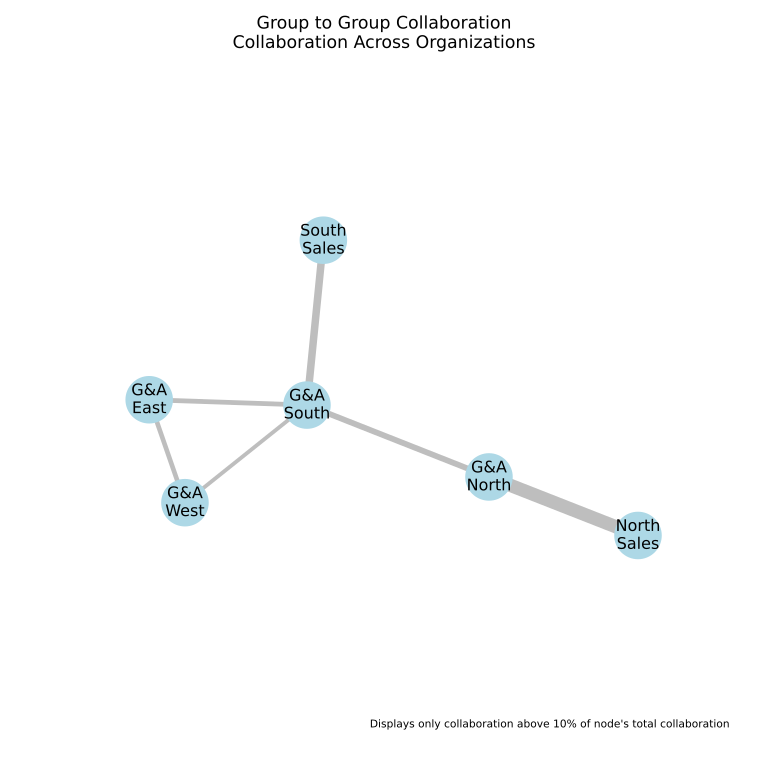
Group-to-Group Example Visualizations
- 🖼️ network_g2g.svg: Sample group-to-group network (R)
- 🖼️ network_g2g.svg (Python): Python-generated network
Person-to-Person Network Analysis
Customizing Person-to-Person Networks
- Purpose: Create customized person-to-person collaboration network visualizations
- Format: R Markdown
- Prerequisites: vivainsights R package, igraph, ggplot2
- Key Features: Individual-level analysis, community detection, centrality measures
- 📥 Download
- Purpose: Create customized person-to-person collaboration network visualizations
- Prerequisites: vivainsights Python package, networkx, matplotlib
- Key Features: Individual-level analysis, community detection, centrality measures
- 📥 Download
Extended Person-to-Person Analysis (R)
A deeper walkthrough of network_p2p(): Louvain and Leiden community detection, closeness/degree/betweenness centrality, sankey visualizations, and a fast plotting method for large graphs.
- Purpose: Comprehensive organizational network analysis workflows
- Language: R
- Prerequisites: vivainsights R package, igraph, dplyr
- Key Features: Network metrics, clustering, centrality analysis
- 📥 Download
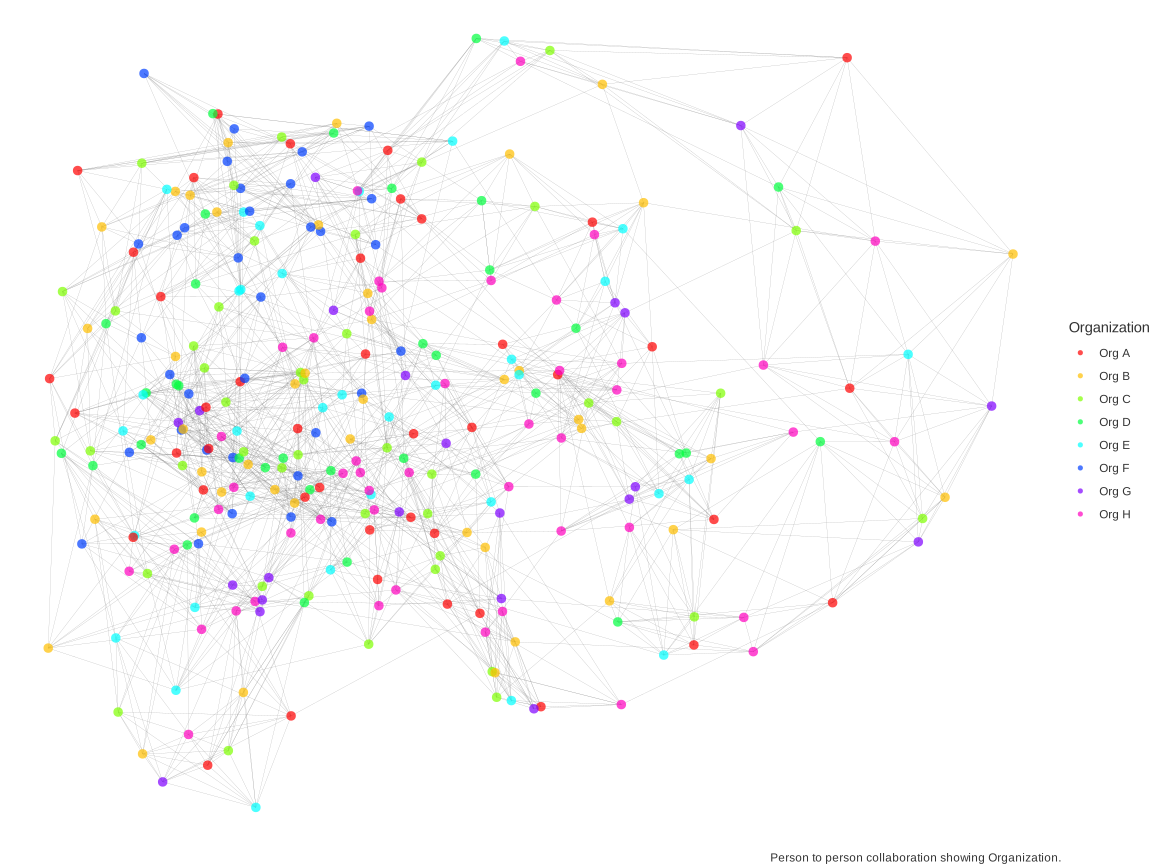
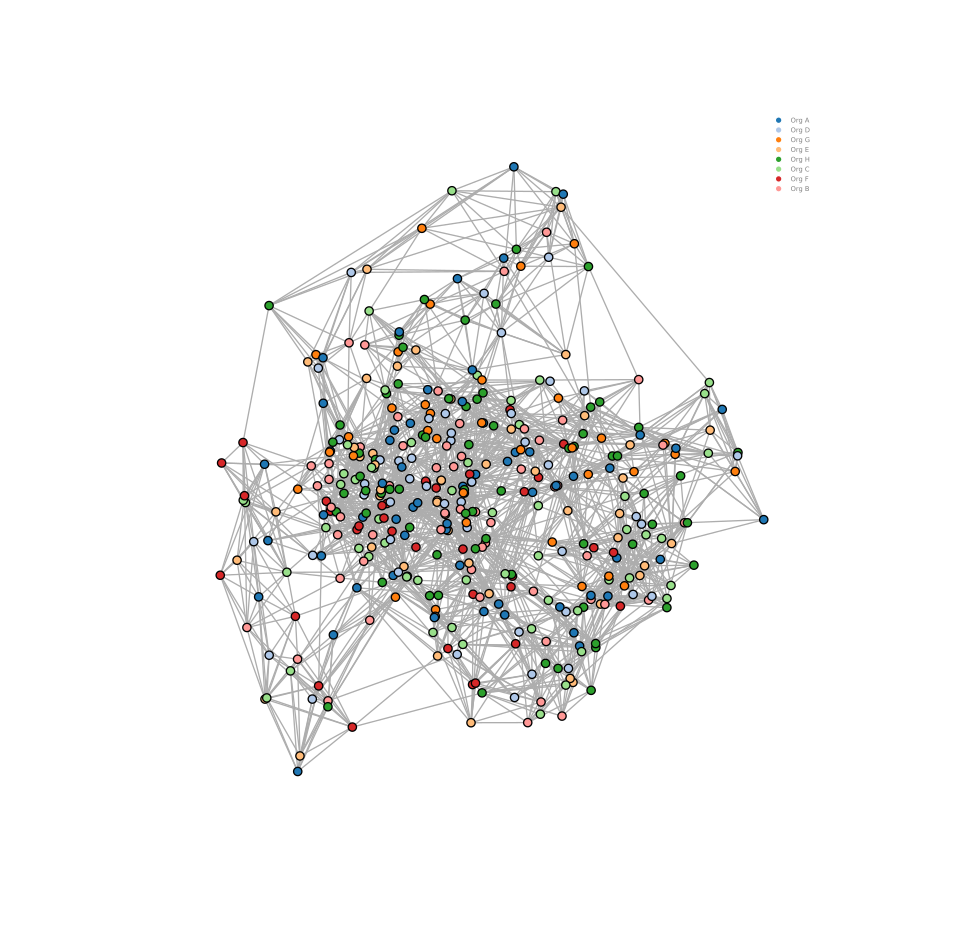
Person-to-Person Example Visualizations
- 🖼️ network_p2p.svg: Sample person-to-person network (R)
- 🖼️ network_p2p.svg (Python): Python-generated network
Network Analysis Workflows
1. Group-to-Group Analysis Workflow
- Data Preparation: Load group-based collaboration data
- Network Construction: Build group interaction networks
- Visualization: Create network diagrams with custom styling
- Analysis: Calculate group-level network metrics
- Interpretation: Identify collaboration patterns and bottlenecks
2. Person-to-Person Analysis Workflow
- Data Preparation: Load person-level collaboration data
- Network Construction: Build individual interaction networks
- Community Detection: Identify informal organizational clusters
- Centrality Analysis: Find key connectors and influencers
- Visualization: Create person-level network maps
3. Organizational Network Analysis Workflow
- Multi-Level Analysis: Combine group and person-level insights
- Temporal Analysis: Track network changes over time
- Comparative Analysis: Compare networks across departments/teams
- Recommendations: Provide actionable insights for collaboration improvement
Key Use Cases for Network Analysis
Network analysis with Viva Insights data is particularly valuable for:
- Change Management: Identify key influencers and communication pathways to ensure successful organizational transformations
- Organizational Design: Understand how work actually flows across teams and departments to optimize organizational structure
- Talent Development: Discover high-potential employees who serve as connectors and bridge-builders across the organization
- Innovation & Knowledge Sharing: Map how expertise and information flow to identify bottlenecks and opportunities for better collaboration
- Merger & Acquisition Integration: Visualize collaboration patterns between merged entities and track integration progress
- Remote Work Optimization: Understand how distributed teams collaborate and identify potential isolation or over-collaboration issues
- Leadership Development: Identify informal leaders and understand influence patterns beyond formal hierarchy
- Diversity & Inclusion: Analyze collaboration patterns across different demographic groups to identify potential barriers or silos
- Team Formation: Use network insights to create more effective cross-functional teams based on existing collaboration patterns
- Risk Management: Identify over-dependencies on key individuals or potential knowledge silos that could impact business continuity
Key Network Metrics
Group-Level Metrics
- Density: How interconnected groups are
- Centrality: Which groups are most central to collaboration
- Clustering: How groups form collaborative clusters
- Modularity: Strength of group boundaries
Person-Level Metrics
- Betweenness Centrality: Key bridge-builders
- Closeness Centrality: Well-connected individuals
- Degree Centrality: Number of direct connections
- Eigenvector Centrality: Influence through connections
Customization Options
Visual Customization
- Node Styling: Size, color, shape based on attributes
- Edge Styling: Width, color, style based on interaction strength
- Layout Algorithms: Force-directed, hierarchical, circular
- Labeling: Custom node and edge labels
- Export Formats: SVG, PNG, PDF for presentations
Analysis Customization
- Filtering: Focus on specific groups, time periods, or interaction types
- Thresholding: Filter weak connections for clarity
- Aggregation: Roll up data to different organizational levels
- Comparison: Side-by-side network comparisons
Prerequisites
R Environment
install.packages(c("vivainsights", "igraph", "ggplot2", "dplyr", "visNetwork"))
Python Environment
pip install vivainsights networkx matplotlib seaborn plotly pandas numpy
Best Practices
- Data Quality: Ensure clean, complete collaboration data
- Privacy: Anonymize person-level data when appropriate
- Interpretation: Focus on actionable insights rather than metrics alone
- Validation: Cross-check network insights with qualitative feedback
- Temporal Analysis: Track network changes over time for trends
Related pages
- Essentials: core utilities and visualizations to prepare your data
- Advanced Analytics: predictive modeling and statistical testing
- Copilot Analytics: measure Microsoft Copilot adoption and impact
- Joining People Skills Data: enrich network analysis with People Skills data
- Getting Started: environment setup and first steps
Need Help?
-
Network Analysis: NetworkX Documentation igraph R Documentation -
Visualization: Matplotlib ggplot2 - Viva Insights: Package Documentation
- Sample Data: Example datasets