Copilot analytics
Business Leaders AI Usage
Explore a synthetic, cross-product AI usage report, reproduce its standalone HTML and understand what real-data adaptation would require.
All dashboards · Open the synthetic demo
What this dashboard shows
This report brings Microsoft 365 Copilot, Cowork, agents, metered M365 services and GitHub Copilot into one descriptive view. It answers who records AI activity, which products they use, how recorded usage changes and how groups differ.
The report is a plain standalone HTML page, generated by a dedicated R renderer. It does not use flexdashboard. The Copilot query dashboards Skill and its runner do not support this report.
Overview and adoption
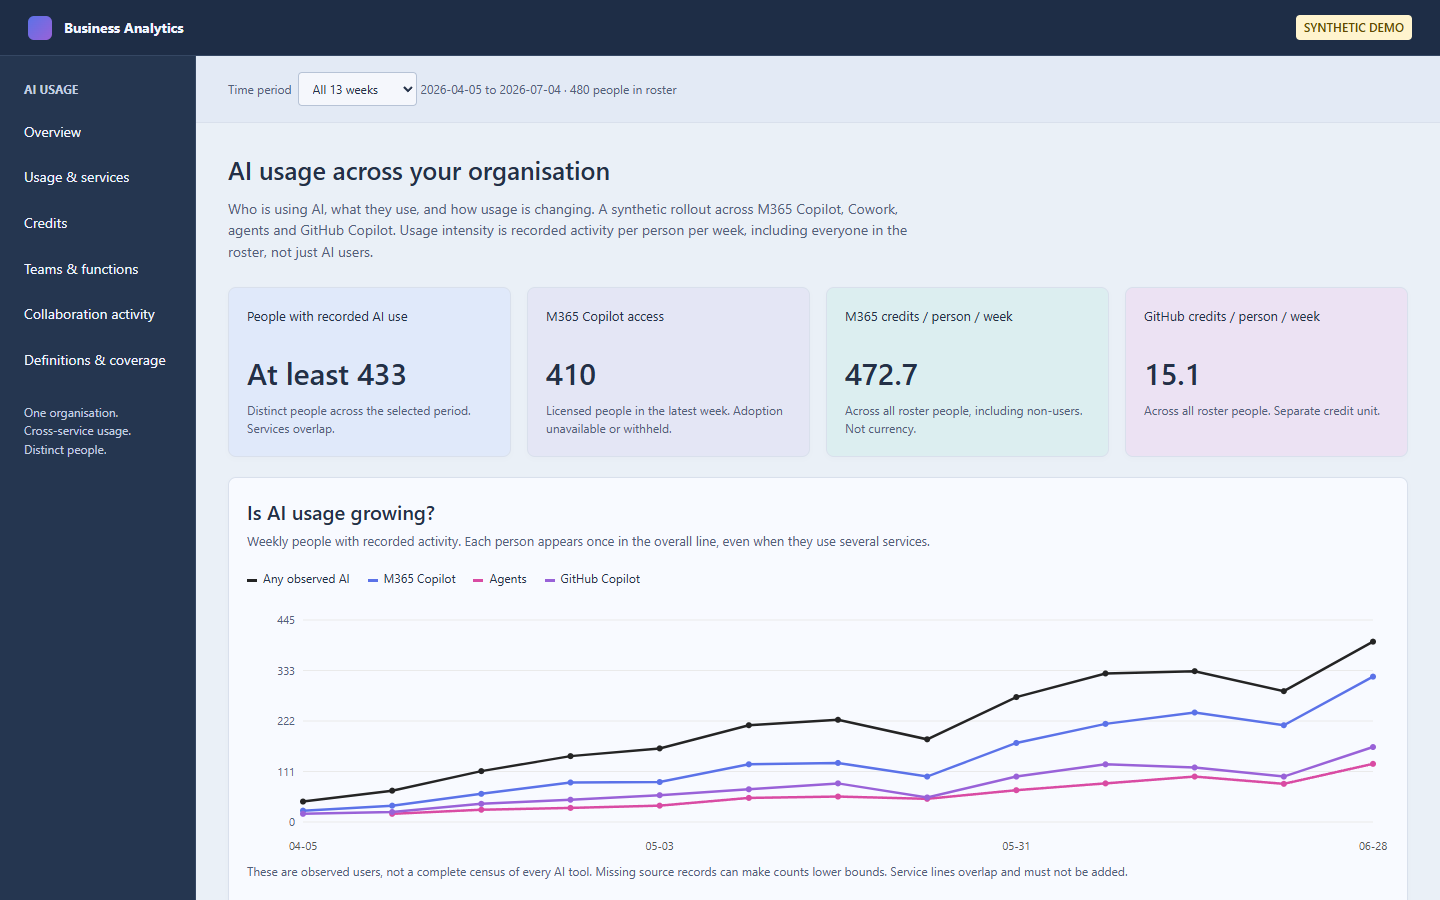
AI reach is a distinct-person union of positive activity, not a sum of product user counts. Usage rates use all roster person-weeks, including non-users. Incomplete observations are labelled as recorded lower bounds.
Collaboration activity
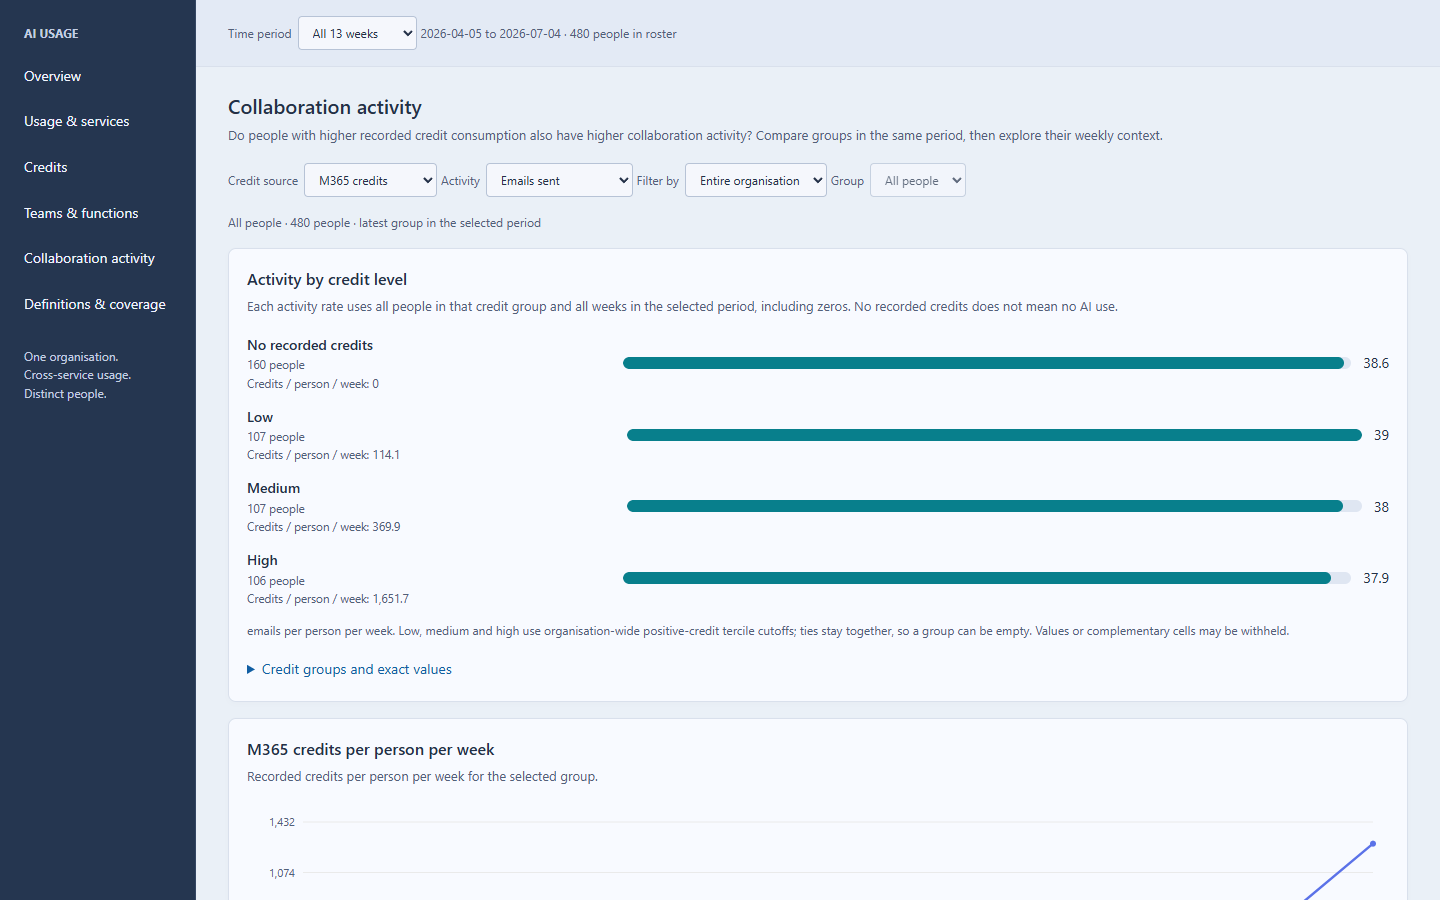
The collaboration view includes emails sent, Teams chats sent, meetings attended and collaboration hours. Positive-credit terciles define low, medium and high bands. Ties stay together, so a band can be empty. No recorded credits do not establish non-use of AI.
You will need
For the demo: no tenant access or query exports. The full repository contains the synthetic fixtures, source and helper scripts.
For a separately developed real-data adaptation: access to the relevant customised queries in Viva Insights, authorised exports and an agreed disclosure policy. These cards describe the demo’s eight input files, not an approved real-export adapter.

Person query
Weekly collaboration, Copilot activity, Cowork and organisational context.
Exports: PersonQuery.csv in the demo. Real downloads use Person_<username>_<date>_<time>Hours.csv, with localised names possible.
Query setup and schema
Consumption query
Separate M365 and GitHub credit measures, with historical licensing metadata.
Exports: PersonM365CreditsMetrics.csv, PersonGitHubCreditsMetrics.csv and PeopleMetaData.csv.
Query setup and schema
GitHub query
Observed GitHub activity and its feature breakdown.
Exports: PersonGitHubActivityMetrics.csv and GitHubActivityBreakdownByFeatureMetrics.csv.
Query setup and schema
Agent query
Agent activity and descriptive agent metadata.
Exports: PersonAgentActivityMetrics.csv and AgentMetadata.csv.
Query setup and schemaThe other three GitHub breakdown exports and M365SpendingPolicyMetaData.csv are not inputs to this demo. For current schemas and weekly join rules, use Joining Viva Insights queries.
Software prerequisites
- Install R, Git and Pandoc. RStudio can provide Pandoc.
- Ensure
Rscriptandgitare available in PowerShell. - Allow installation of the R packages below from your approved package source.
Clone the whole repository, rather than downloading the Rmd alone. Run these once from the folder that should contain your checkout:
git clone https://github.com/microsoft/viva-insights-sample-code.git
Set-Location .\viva-insights-sample-code
All remaining commands run from that repository root.
Rscript -e "install.packages(c('dplyr', 'tidyr', 'jsonlite', 'knitr', 'rmarkdown'), repos='https://cloud.r-project.org')"
Rscript -e "stopifnot(rmarkdown::pandoc_available())"
If Pandoc is not discovered, set $env:RSTUDIO_PANDOC to its installed folder in this PowerShell session, then repeat the check. If Rscript is not on PATH, replace it with & 'C:\Program Files\R\R-4.6.1\bin\Rscript.exe', using your installed version.
Run the demo
- Keep the repository layout intact. The renderer needs
business-leaders-ai-adoption.Rmd,business-leaders-ai-helpers.R,business-leaders-ai-simulation.R,copilot-super-panel-helpers.Randexamples\utility-r\_data. -
Create an output folder outside the checkout and render:
New-Item -ItemType Directory -Force ..\copilot-dashboard-work\business-leaders Rscript .\examples\utility-r\render-business-leaders-ai.R ..\copilot-dashboard-work\business-leaders\dashboard.html -
Check that the command prints
Rendered:,Minimum group size:, people, weeks and the HTML size. Open the output:Start-Process ..\copilot-dashboard-work\business-leaders\dashboard.html
The result is a standalone HTML file with embedded presentation assets, no CDN libraries and no runtime data requests. No separate provenance JSON is produced by this renderer. Retain the source revision and console output for your reproduction record:
git rev-parse HEAD
The default minimum group size is 10. A whole-number --minimum=N argument can match an organisation’s agreed minimum, but values below 5 are rejected. Do not lower it merely to reveal withheld groups.
Without an output argument, the renderer writes beside the Rmd and can replace the checked-in demo HTML. Use the explicit outside-repository destination above.
How the synthetic example is built
The renderer applies a seeded rollout scenario to eight raw synthetic exports in memory, then aggregates them. It illustrates staggered activation, participation changes and a temporary dip with recovery. It does not rewrite the committed CSVs.
The Person Query has 26 weeks of collaboration history. Product feeds cover the final 13 weeks. Each person’s latest attributes in the selected window determine their group. Do not assume the two histories have identical coverage.
Use your own data
There is no supported real-data command for this full report. Do not overwrite the fixtures or pass customer files through the demo renderer.
Develop an adaptation in a separate approved workspace. Use the source and helper documentation and join guide to establish:
- Exact schemas, period grouping, person identities and historical metadata joins.
- Independent GitHub provisioning and ingestion-completeness evidence. Row presence establishes observation, not provisioning.
- Spending-policy additivity and separate M365 and GitHub credit units.
- Population coverage, missing-value meanings and disclosure rules across related outputs.
- Removal of the synthetic rollout scenario and validation of every derived measure.
Matching headers alone does not establish semantic compatibility. The narrower real Consumption runner produces only M365 credit aggregates, not this report.
Privacy and interpretation
- Small groups, positive contributors and complementary cells are checked before aggregates enter the HTML. Default disclosure protection is not a privacy guarantee.
- Overlapping windows, credit bands and group comparisons can still enable inference. Review the complete release, not individual charts alone.
- M365 credits and GitHub AI credits remain separate. Neither is currency, and they are never pooled.
- Missing activity is not imputed. Processing gaps can prevent full adoption estimates.
- Collaboration differences are descriptive. They do not establish causal AI effects, productivity, wellbeing, monetary savings or return on investment.
- Keep real exports, private configurations and unapproved outputs outside the repository and public hosting.