Copilot analytics
Interactive Dashboards
Explore two Copilot demo reports, then use the R templates to build an analysis with your own Viva Insights exports.
Copilot Analytics / Interactive Dashboards
Just exploring? Open either demo in your browser; no installation is required.
Building your own? Review the required queries, get the source, and follow the setup guide below.
Both reports use synthetic data. They illustrate analysis approaches, not evidence of Copilot’s impact. Assumptions and simulation details are included in each report’s methods or appendix.
Copilot Consumption and Ways of Working
Synthetic data · R template · Seven-page HTML report
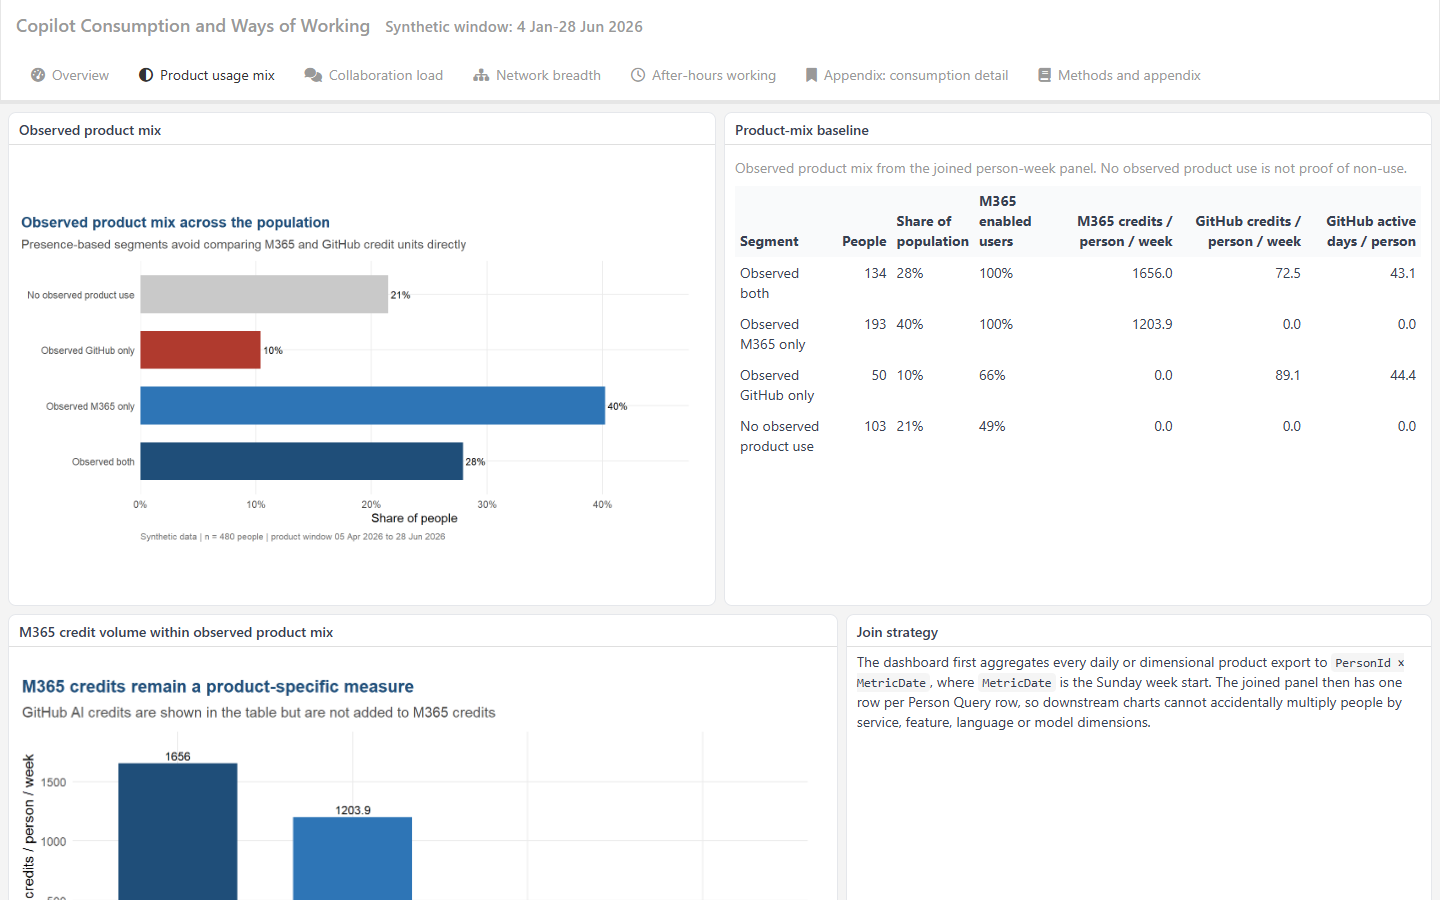
When to use it: reach for this report when you need to answer questions such as — Are a small number of users or groups driving most of our credit spend? Do certain user groups consume disproportionately more credits, not just more sessions? How does cost per session vary by service, organisation or function? Are our heaviest consumers consistently heavy, or do they spike occasionally? It is built around the volume-vs-mix distinction: total consumption differs from how expensive each session of that consumption is.
Scope: “consumption” here refers to Copilot credit consumption as captured by the Viva Insights Consumption Query. That query covers Microsoft 365 Copilot services and also emits GitHub AI credits, so both appear in this report. The report additionally reads the GitHub query’s activity file to tell observed non-use apart from absent observation. For the GitHub Copilot feature, model and language breakdowns — which this report does not present — see the Developer Experience and Copilot report below.
Real v1 capability: the supplied runner builds a narrower M365 credits-only report from Consumption activity and its matching people metadata, with explicit mapping approval. Sessions, Person Query associations and GitHub panels are not implemented by that real adapter. Reproducing the full synthetic demonstration on governed inputs requires separately implemented and verified support; matching headers alone does not make it a like-for-like substitution.
Separate consumption volume from consumption cost: credit concentration and percentile bands, heavy-user consumption patterns, cost per session, service mix, and function drill-downs. For the Copilot Usage Segments ladder — Power, Habitual, Novice, Low and Non-users — use identify_usage_segments(), which needs a longer rolling window than this report’s product feed provides.
View demo · Get source · Setup guide
Build or customise with AI: reproduce the demo or build a scoped credits report with an agent and reusable R code.

Demo inputs: A Person Query fixture, the Consumption query fixtures (PeopleMetaData, PersonM365CreditsMetrics, PersonGitHubCreditsMetrics) and one GitHub query fixture (PersonGitHubActivityMetrics) — five files across three queries. The GitHub activity file is what separates “observed with no use” from “not observed” in the product usage mix; the four GitHub breakdown exports are not required by this report. These carry simulated values in the real public Consumption schema, so credits, sessions, service grain and the PeopleHistoricalId join key all match a genuine export. Earlier versions of this demo carried token and task-type fields that exist in no export; those have been removed.
Interpretation: Associations only. Credit intensity is a cost measure, not a measure of value or quality. Concentration curves and banded percentiles help describe skewed consumption without relying on an average.
See the product usage mix preview
Developer Experience and Copilot
Synthetic data · R template · GitHub Copilot usage as the organising lens
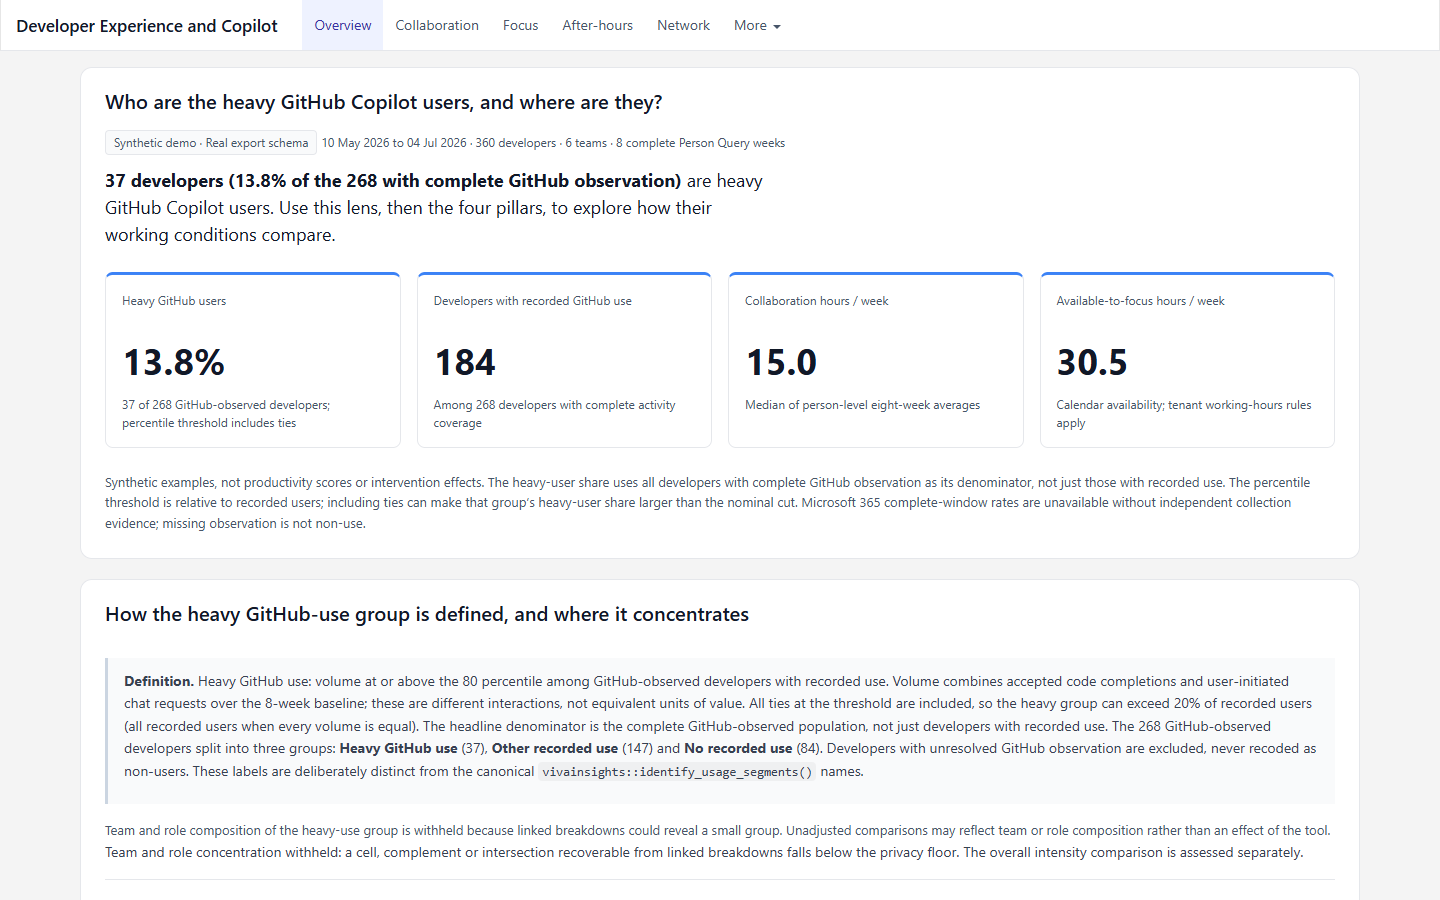
When to use it: reach for this report when you need to answer questions such as — Which developers are the heaviest GitHub Copilot users, and where are they concentrated? Do heavy GitHub users show different meeting load or uninterrupted-focus time than other observed developers? Do they collaborate with broader or narrower internal networks? How does GitHub Copilot use vary by team, model, or language? Are developers using GitHub Copilot and Microsoft 365 Copilot jointly, or are the two adopted independently? Is missing activity actually zero usage, or a coverage/eligibility gap? It defines a heavy GitHub-use group on the GitHub-observed population, then compares developer working conditions across the three GitHub-intensity groups, and keeps eligibility and coverage visible rather than treating missing activity as zero.
Scope: this report adds GitHub Copilot activity and feature, model and language breakdowns to a developer working-conditions baseline, alongside Microsoft 365 Copilot credit records. The Consumption demo above also contains both products’ credit measures, in separately named units; it does not include the GitHub activity breakdowns. Neither demo establishes credit-unit equivalence. These synthetic-demo capabilities do not expand the narrower M365 credits-only real-v1 adapter.
Prerequisites for real data: you need a Person Query export (working-pattern metrics and organisational attributes), the five GitHub query files and the Consumption query files, per the data contract. The demo fixtures already match the real export schemas, so no column renaming should be needed — but column parity is not semantic parity. Confirm population scope, identifiers, date grains, licence history and expected coverage before adapting, and note that eligibility and coverage must be derived because no query emits them.
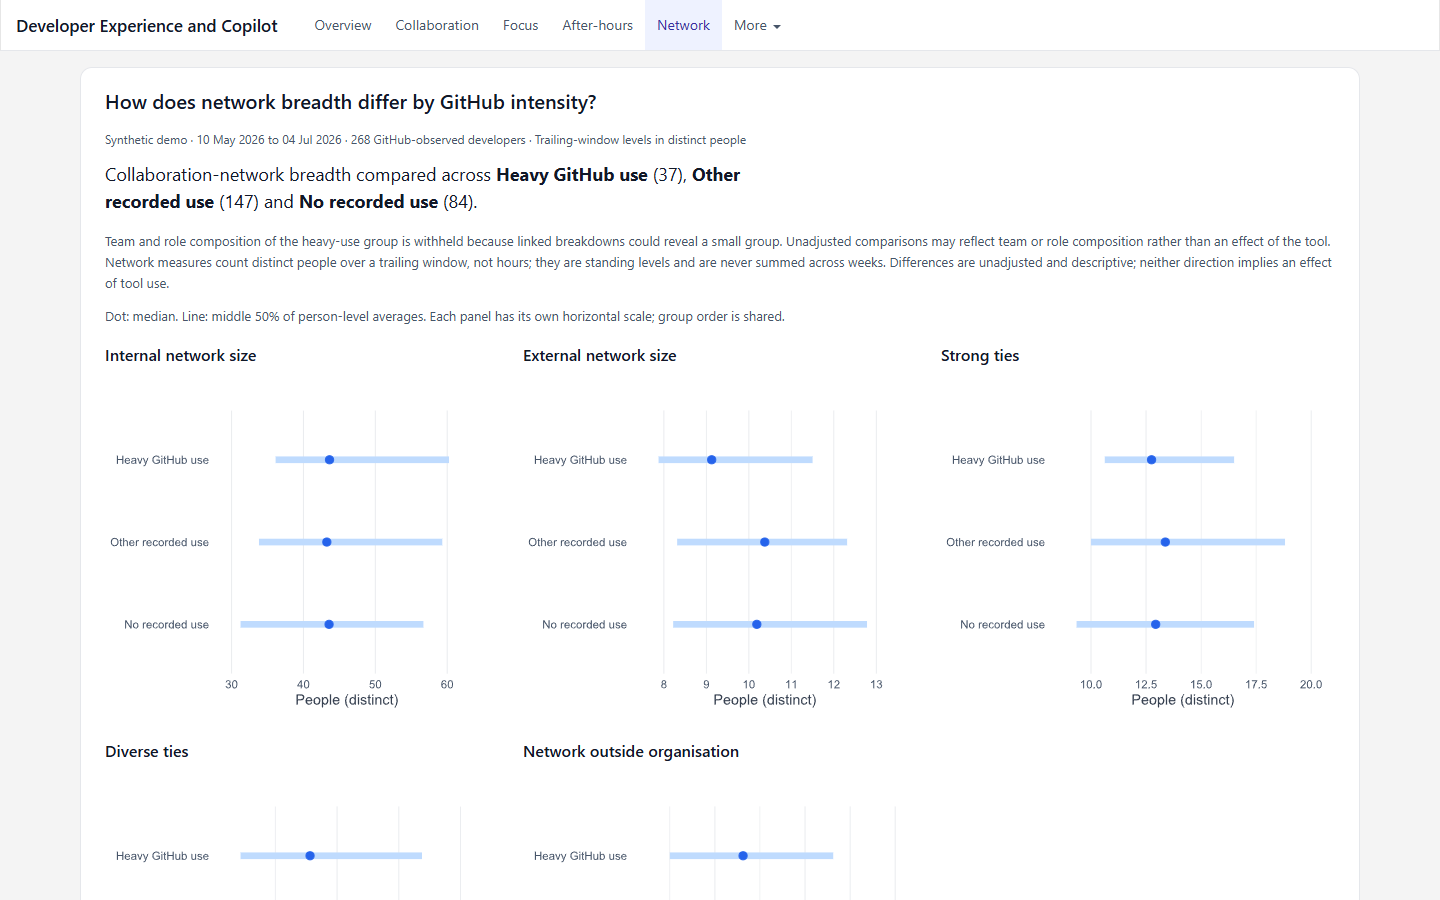
Start with Overview, which defines the heavy GitHub-use group and shows where it concentrates by team and role where disclosure permits, then explore Collaboration, Focus, After-hours and Network — each leads with the three-group GitHub-intensity comparison. The More menu contains GitHub breakdowns, GitHub coverage, working-pattern comparisons and methods. Detailed tables expand in place, and charts reflow for smaller screens.
View demo · Get source · Setup guide
Build or customise with AI: reproduce the synthetic reference or assess real inputs. No verified real GitHub adapter is supplied yet.
The developer demo uses synthetic values in confirmed export headers, not a certified real-data adapter. Weekly M365 eligibility uses enabled days; ingestion completeness remains unknown without independent evidence. GitHub row presence is observation, not provisioning. Breakdown/model allocations are illustrative synthetic invariants, not verified real-export semantics. M365 Copilot credits and GitHub AI credits remain separately named units; no cross-product total or share is supported.
Interpretation: Associations only. Acceptance rate is not code quality, after-hours activity is not burnout, and calendar space does not establish coding time.
See the recorded GitHub use and observation preview
Build with your own data
The demos need only a browser. To render or adapt the templates, use R, Pandoc, R Markdown, and flexdashboard. There is no Python version of these templates.
- Get the files. Start with the report source linked above. For Developer Experience, also get github-developer-experience-helpers.R and render-github-developer-experience.R, keeping the repository folder structure.
- Render the synthetic example first. Dependencies include
vivainsights,dplyr,tidyr,ggplot2,ggrepel,scales,stringr,flexdashboard,knitr, andrmarkdown. The AI-guided journeys copy the required fixtures and source into an isolated output folder before rendering. - Adapt only supported inputs. Use the Consumption journey for the scoped credits adapter. Use the Developer Experience journey for a real-input readiness assessment. Verify contracts before replacing any simulation; do not assume a CSV with similar headers is equivalent.
- Review before sharing. Update simulation labels and methodology to describe your actual inputs. Apply your organization’s privacy requirements and retain the distinction between association and causation. Do not put customer exports in this sample repository or in shareable HTML.
Read the full template setup guide
Continue exploring
Copilot Analytics for scripts and segmentation · Getting Started for environment setup · Causal Inference for impact-analysis methods