Copilot analytics
Developer Experience and Copilot
Reproduce the synthetic developer experience dashboard, inspect its usage groups and understand the limits of real GitHub export support.
All dashboards · Open the synthetic demo
What this dashboard shows
This synthetic reference describes developers’ collaboration, focus, after-hours activity and network breadth through a GitHub Copilot usage lens. Feature, model and language views add usage context.
Despite the historical developer-productivity source filename, the report does not measure overall developer productivity or establish a Copilot effect.
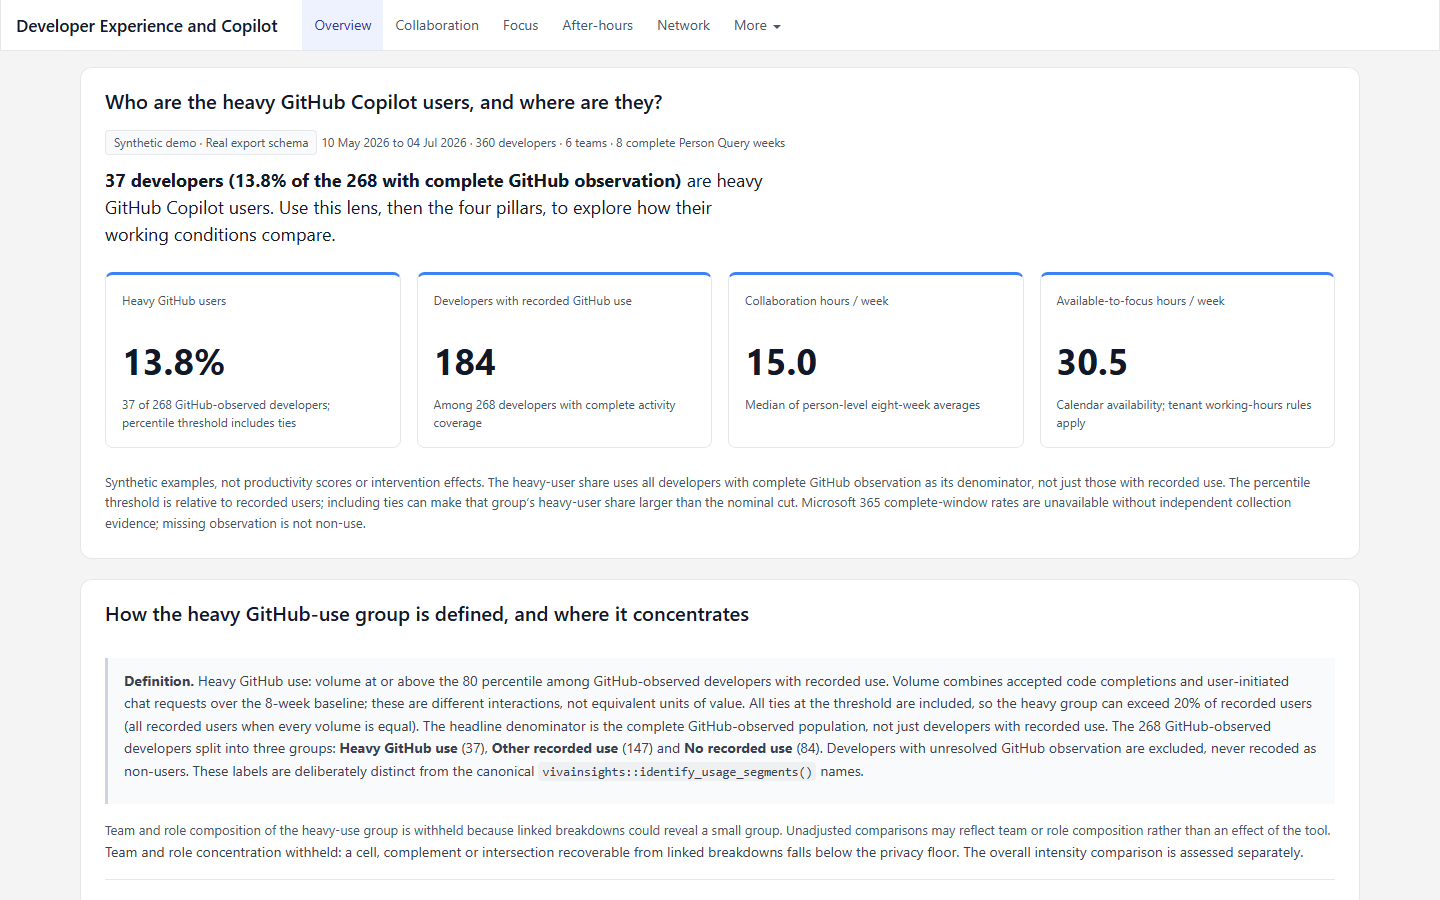
Heavy use means accepted completions plus user-initiated chat requests at or above the 80th percentile among observed developers with recorded use. These are interaction counts, not equivalent units of value. Ties can make more than 20% qualify.
The headline heavy-use share uses all GitHub-observed developers, including observed people with no recorded use. Heavy use, other recorded use and no recorded use partition that observed population. Unobserved people remain separate.
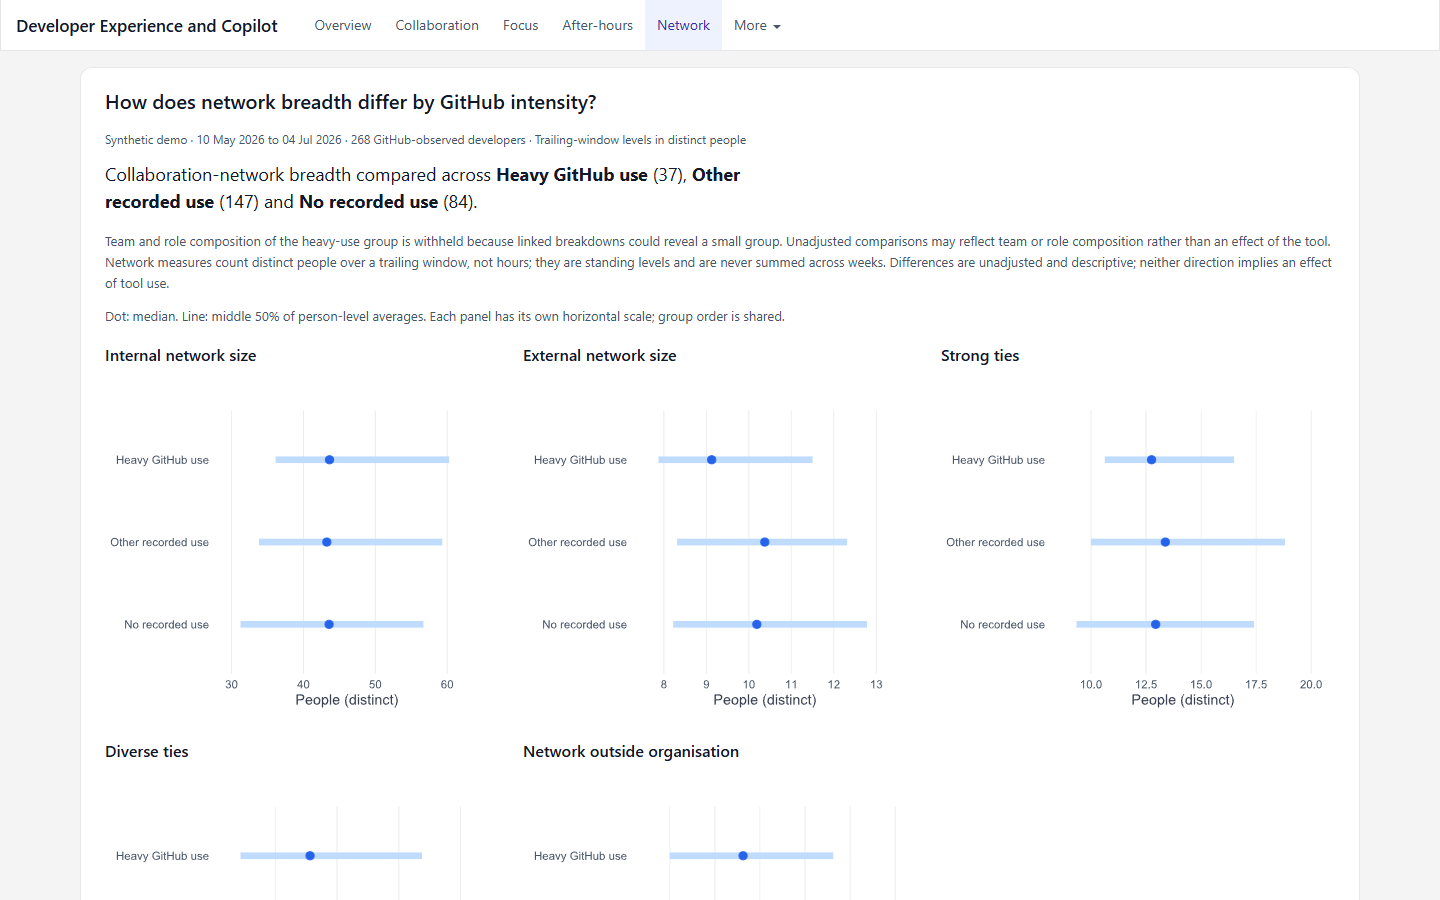
The More menu holds breakdowns, coverage, working-pattern comparisons and methods. Team and role views may be withheld even when the overall three-group comparison is publishable.
You will need
For the demo: the full repository, R and rendering dependencies. No GitHub organisation access or customer exports are needed.
The complete synthetic report reads nine files:

Person query
Weekly collaboration, focus, after-hours and network metrics with organisational attributes.
Exports: PersonQuery.csv in the demo. Real Person Query filenames vary by user, date and locale.
Query setup and schema
Consumption query
Separate M365 and GitHub credits, plus historical M365 licensing context.
Exports: PersonM365CreditsMetrics.csv, PersonGitHubCreditsMetrics.csv and PeopleMetaData.csv.
Query setup and schema
GitHub query
Activity observations and feature, language and model detail.
Exports: PersonGitHubActivityMetrics.csv, GitHubActivityBreakdownByFeatureMetrics.csv, GitHubActivityBreakdownByLanguageFeatureMetrics.csv, GitHubActivityBreakdownByLanguageModelMetrics.csv and GitHubActivityBreakdownByModelFeatureMetrics.csv.
Query setup and schemaThe report does not use Agent exports or M365SpendingPolicyMetaData.csv. For query setup and current schemas, see Joining Viva Insights queries.
For real GitHub data, the runner supports inspection only. The nine-file demo bundle is not a verified real-data contract.
Software prerequisites
Install R, Git and Pandoc, or use Pandoc bundled with RStudio. Ensure Rscript and git are available in PowerShell.
Clone the whole repository to retain the source Rmd, github-developer-experience-helpers.R, copilot-super-panel-helpers.R, fixtures and runner:
git clone https://github.com/microsoft/viva-insights-sample-code.git
Set-Location .\viva-insights-sample-code
Run all remaining commands from the repository root:
Rscript -e "install.packages(c('jsonlite', 'rmarkdown', 'flexdashboard', 'dplyr', 'tidyr', 'ggplot2', 'scales', 'knitr', 'stringr', 'htmltools', 'vivainsights'), repos='https://cloud.r-project.org')"
Rscript -e "stopifnot(rmarkdown::pandoc_available(), capabilities('cairo'))"
The developer report’s SVG device requires Cairo graphics support. If that check fails, use an R installation with Cairo support. If Pandoc is missing, set $env:RSTUDIO_PANDOC to its installed folder.
If Rscript is not on PATH, replace it with & 'C:\Program Files\R\R-4.6.1\bin\Rscript.exe', matching your installed version. Inspection needs only base R, jsonlite and Git.
Run the demo
-
Inspect the supplied synthetic reference:
Rscript .\frontier-analytics\starter-kits\copilot-query-dashboard\dashboard.R inspect .\frontier-analytics\starter-kits\copilot-query-dashboard\configs\demo-github.json -
Render it in the runner’s isolated workspace:
Rscript .\frontier-analytics\starter-kits\copilot-query-dashboard\dashboard.R reproduce .\frontier-analytics\starter-kits\copilot-query-dashboard\configs\demo-github.json -
Open the standalone HTML:
Start-Process ..\copilot-dashboard-work\github-demo\reproduce\dashboard.html
Expected outputs
Location beneath ..\copilot-dashboard-work\github-demo |
Contents |
|---|---|
inspect\readiness.json |
Reference readiness and provenance, without rendering. |
reproduce\dashboard.html |
Complete synthetic Developer Experience dashboard. |
reproduce\provenance.json |
Synthetic mode, repository revision, configuration, checksums, packages, Pandoc and execution details. |
reproduce\work |
Isolated source, helpers, fixtures and rendering intermediates. |
The runner requires tracked, unmodified references. It copies inputs into the work directory and checks source hashes afterwards. It does not rewrite committed reports or fixtures.
Each action directory must be new. For a rerun, choose a fresh output_dir. All configured paths resolve relative to the JSON file, not the shell directory. Outputs must be outside the repository and cannot contain inputs.
Demo mode preserves the reference’s fixed privacy minimum of 10. It does not apply custom real-data mappings, approvals or filters.
Use your own data
You can inspect a local GitHub export, but no supported real GitHub dashboard build exists.
- Obtain authorised exports through Create analysis > Customized query > GitHub query. Keep the files outside the checkout.
-
Copy the inspection configuration into a private workspace:
New-Item -ItemType Directory -Force ..\copilot-dashboard-private Copy-Item .\frontier-analytics\starter-kits\copilot-query-dashboard\configs\real-github-inspect.example.json ..\copilot-dashboard-private\github-inspect.json notepad ..\copilot-dashboard-private\github-inspect.json - Set absolute
repo_root,output_dirandinputs.activitypaths. JSON requires escaped Windows backslashes, such asC:\\private\\PersonGitHubActivityMetrics.csv. The optionalpeopleinput does not establish a Person Query adapter. -
Run inspection:
Rscript .\frontier-analytics\starter-kits\copilot-query-dashboard\dashboard.R inspect ..\copilot-dashboard-private\github-inspect.json - Read
inspect\readiness.jsonbeneath your configured output directory. Expect a bounded schema and count summary plus a real-GitHub adapter blocker, not dashboard HTML.
A successful inspection exit means the assessment completed. It does not certify fields, joins, eligibility, completeness or business meaning. build remains blocked until an approved adapter establishes those contracts. There is no synthetic fallback.
Develop any full real-data adaptation separately, using the source documentation and runner contract. Never substitute customer files for committed fixtures.
Optional agent-assisted route
Install both the shared analysis Skill and the dashboard add-on from this checkout:
gh skill install . viva-insights-analysis --from-local --agent github-copilot --scope user
gh skill install . viva-insights-copilot-dashboards --from-local --agent github-copilot --scope user
Keep the checkout after installation. In Copilot CLI, run /skills reload then /skills info viva-insights-copilot-dashboards. Ask for the Developer Experience demo and supply your checkout’s full path.
The Skill supports reproduction and real GitHub inspection, not a verified real GitHub adapter. It does not support Business Leaders or remove rendering dependencies.
Privacy and interpretation
- Reference groups require at least 10 distinct people. Linked cells, complements and joint team-by-role-by-intensity comparisons can trigger wider withholding.
- Synthetic reports embed aggregate charts, not individual scatter points. These rules do not guarantee safe publication of a real adaptation.
- GitHub row presence proves observation, not provisioning. Missing activity is unknown, while an explicit zero is observed inactivity.
- Sparse credit records and activity coverage require separate checks. M365 licensing metadata does not establish GitHub eligibility.
- The fixture’s breakdown reconciliation is a synthetic invariant, not verified real-export semantics.
- Network measures are trailing-window stocks. Do not sum them across weeks or interpret them as weekly flows.
- Group differences are unadjusted and may reflect team or role composition. They do not establish productivity, wellbeing, tool value or causal effects.
- Keep real exports, configurations, inspection artifacts and outputs private pending review.