Identify Usage Segments based on a metric
Source:R/identify_usage_segments.R
identify_usage_segments.Rd![[Experimental]](figures/lifecycle-experimental.svg)
This function identifies users into usage segments based on their usage
volume and consistency. The segments 'Power Users', 'Habitual Users', 'Novice
Users', 'Low Users', and 'Non-users' are created. There are two versions, one
based on a rolling 12-week average (version = "12w") and the other on a
rolling 4-week average (version = "4w"). While a main use case is for
Copilot metrics e.g. 'Total_Copilot_actions', this function can be applied to
other metrics, such as 'Chats_sent'.
Usage
identify_usage_segments(
  data,
  metric = NULL,
  metric_str = NULL,
  version = "12w",
  threshold = NULL,
  width = NULL,
  max_window = NULL,
  power_thres = 15,
  return = "data"
)
Arguments
- data
A data frame with a Person query containing the metric to be classified. The data frame must include a
PersonIdcolumn and aMetricDatecolumn.- metric
A string representing the name of the metric column to be classified. This parameter is used when a single column represents the metric.
- metric_str
A character vector representing the names of multiple columns to be aggregated for calculating a target metric, using row sum for aggregation. This is used when
metricis not provided.- version
A string indicating the version of the classification to be used. Valid options are
"12w"for a 12-week rolling average,"4w"for a 4-week rolling average, orNULLwhen using custom parameters. Defaults to"12w".- threshold
Numeric value specifying the minimum number of times the metric sum up to in order to be a valid count. A 'greater than or equal to' logic is used. Only used when
versionisNULL.- width
Integer specifying the number of qualifying counts to consider for a habit. Only used when
versionisNULL.- max_window
Integer specifying the maximum unit of dates to consider a qualifying window for a habit. Only used when
versionisNULL.- power_thres
Numeric value specifying the minimum weekly average actions required to be classified as a 'Power User'. Defaults to 15.
- return
A string indicating what to return from the function. Valid options are:
"data": Returns the data frame with usage segments."plot": Returns a plot of the usage segments."table": Returns a summary table with usage segments as columns.
Value
Depending on the return parameter, either a data frame with usage
segments or a plot visualizing the segments over time. If "data" is passed
to return, the following additional columns are appended:
When
versionis"12w"or"4w":IsHabit12w: Indicates whether the user has a habit based on the 12-week rolling average.IsHabit4w: Indicates whether the user has a habit based on the 4-week rolling average.UsageSegments_12w: The usage segment classification based on the 12-week rolling average.UsageSegments_4w: The usage segment classification based on the 4-week rolling average.
When
versionisNULL:IsHabit: Indicates whether the user has a habit based on the provided parameters.UsageSegments: The usage segment classification based on the provided parameters.
IsHabit12w: Indicates whether the user has a habit based on the 12-week rolling average.IsHabit4w: Indicates whether the user has a habit based on the 4-week rolling average.UsageSegments_12w: The usage segment classification based on the 12-week rolling average.UsageSegments_4w: The usage segment classification based on the 4-week rolling average.
If "table" is passed to return, a summary table is returned with one row
per MetricDate and usage segments as columns containing percentages. The
table includes:
MetricDate: The date of the metricSegment columns (in order):
Non-user,Low User,Novice User,Habitual User,Power User(only segments present in the data are included)n: The total number of distinct persons for that date
@import slider slide_dbl @import tidyr
Details
There are three ways to use this function for usage segments classification:
12-week version (
version = "12w"): Based on a rolling 12-week period4-week version (
version = "4w"): Based on a rolling 4-week periodCustom parameters (
version = NULL): Based on user-defined parameters
This function assumes that the input dataset is grouped at the weekly level
by the MetricDate column.
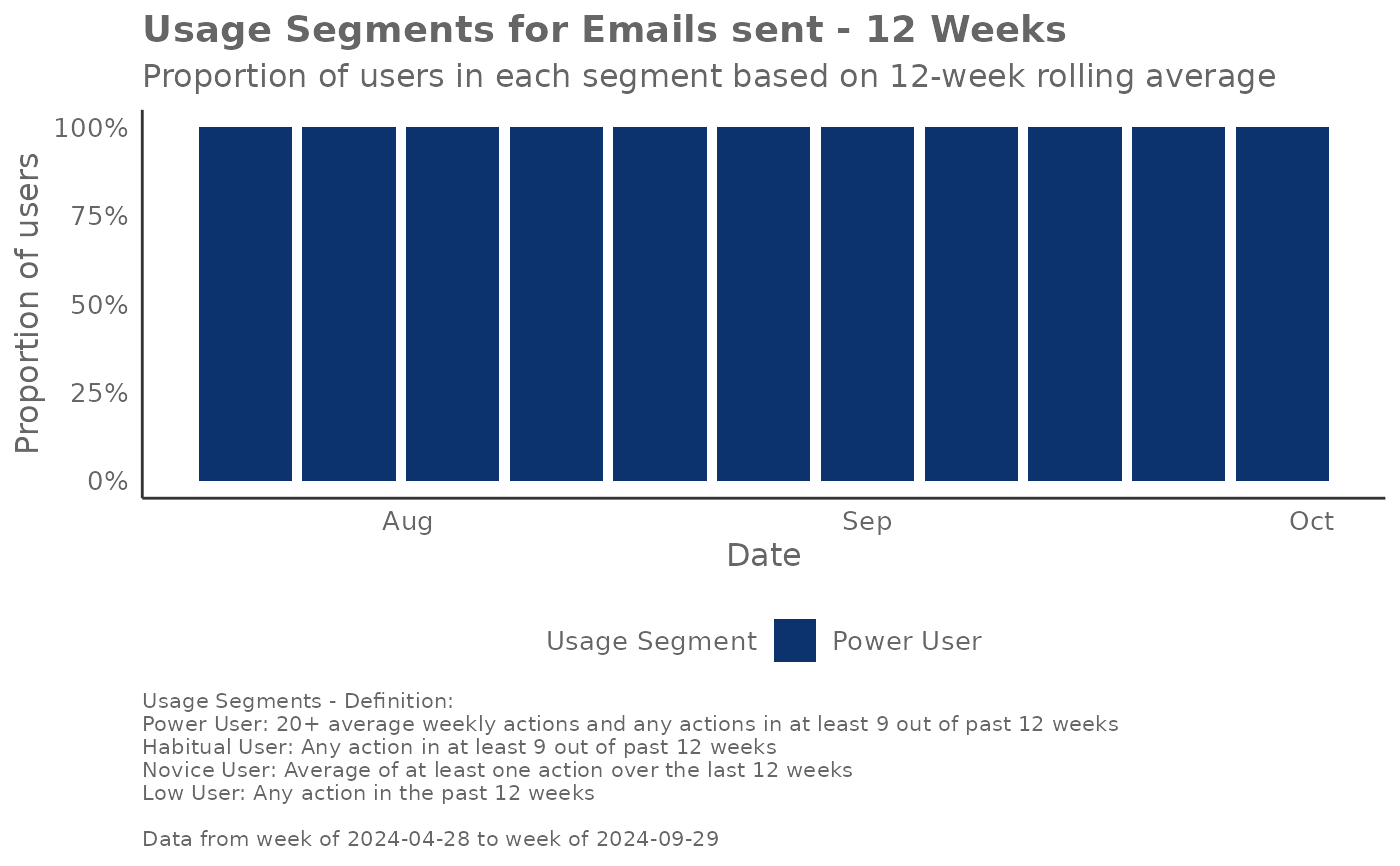
The definitions of the segments as per the 12-week definition are as follows:
Power User: Averaging 15+ weekly actions (customizable via
power_thres) and any actions in at least 9 out of past 12 weeksHabitual User: Any action in at least 9 out of past 12 weeks
Novice User: Averaging at least one action over the last 12 weeks
Low User: Any action in the past 12 weeks
Non-user: No actions in the past 12 weeks
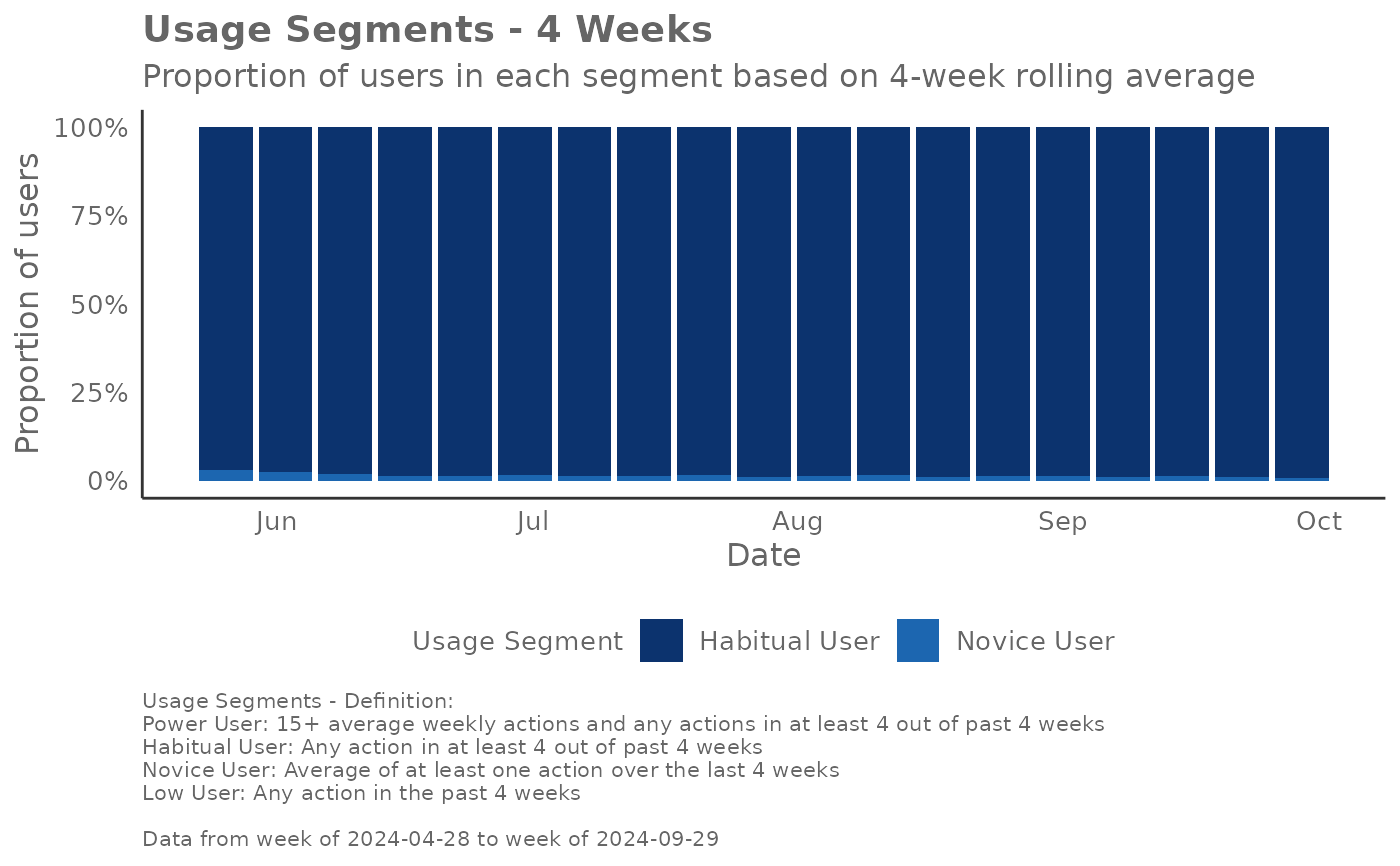
The definitions of the segments as per the 4-week definition are as follows:
Power User: Averaging 15+ weekly actions (customizable via
power_thres) and any actions in at least 4 out of past 4 weeksHabitual User: Any action in at least 4 out of past 4 weeks
Novice User: Averaging at least one action over the last 4 weeks
Low User: Any action in the past 4 weeks
Non-user: No actions in the past 4 weeks
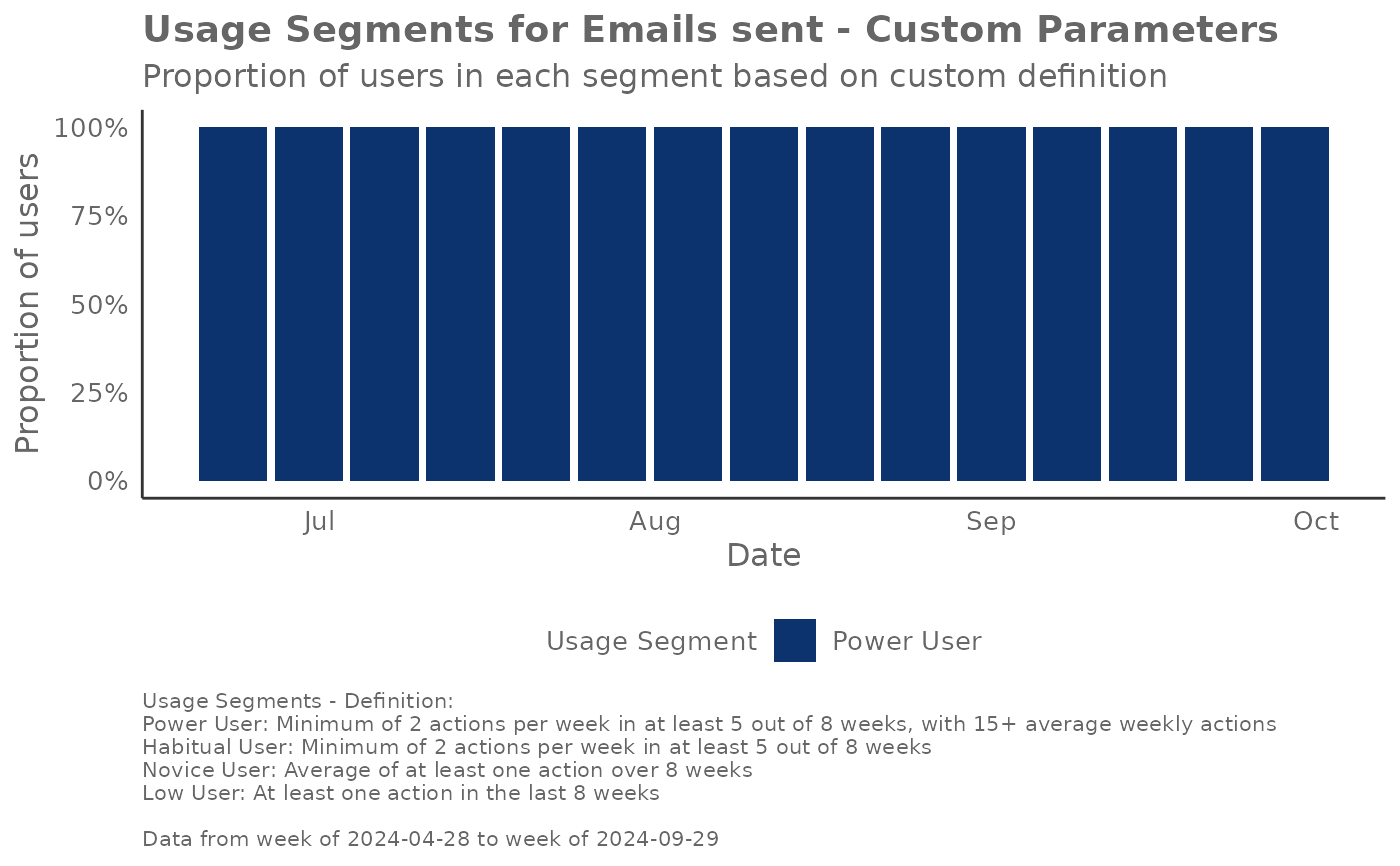
When using custom parameters (version = NULL), you must provide values for
threshold, width, max_window, and optionally power_thres. The segment definitions become:
Power User: Minimum of
thresholdactions per week in at leastwidthout of pastmax_windowweeks, with 15+ average weekly actions (customizable viapower_thres)Habitual User: Minimum of
thresholdactions per week in at leastwidthout of pastmax_windowweeksNovice User: Average of at least one action over the last
max_windowweeksLow User: Any action in the past
max_windowweeksNon-user: No actions in the past
max_windowweeks
Examples
# Example usage with a single metric column
identify_usage_segments(
data = pq_data,
metric = "Emails_sent",
version = "12w",
return = "plot"
)
 # Example usage with multiple metric columns
identify_usage_segments(
data = pq_data,
metric_str = c(
"Copilot_actions_taken_in_Teams",
"Copilot_actions_taken_in_Outlook",
"Copilot_actions_taken_in_Excel",
"Copilot_actions_taken_in_Word",
"Copilot_actions_taken_in_Powerpoint"
),
version = "4w",
return = "plot"
)
# Example usage with multiple metric columns
identify_usage_segments(
data = pq_data,
metric_str = c(
"Copilot_actions_taken_in_Teams",
"Copilot_actions_taken_in_Outlook",
"Copilot_actions_taken_in_Excel",
"Copilot_actions_taken_in_Word",
"Copilot_actions_taken_in_Powerpoint"
),
version = "4w",
return = "plot"
)
 # Example usage with custom parameters
identify_usage_segments(
data = pq_data,
metric = "Emails_sent",
version = NULL,
threshold = 2,
width = 5,
max_window = 8,
return = "plot"
)
# Example usage with custom parameters
identify_usage_segments(
data = pq_data,
metric = "Emails_sent",
version = NULL,
threshold = 2,
width = 5,
max_window = 8,
return = "plot"
)
 # Example usage with custom power user threshold
identify_usage_segments(
data = pq_data,
metric = "Emails_sent",
version = "12w",
power_thres = 20,
return = "plot"
)
# Example usage with custom power user threshold
identify_usage_segments(
data = pq_data,
metric = "Emails_sent",
version = "12w",
power_thres = 20,
return = "plot"
)
 # Return summary table
identify_usage_segments(
data = pq_data,
metric = "Emails_sent",
version = "12w",
return = "table"
)
#> Usage segments summary table (12-week version)
#> # A tibble: 23 × 4
#> MetricDate `Novice User` `Power User` n
#> <date> <dbl> <dbl> <int>
#> 1 2024-04-28 1 0 300
#> 2 2024-05-05 1 0 300
#> 3 2024-05-12 1 0 300
#> 4 2024-05-19 1 0 300
#> 5 2024-05-26 1 0 300
#> 6 2024-06-02 1 0 300
#> 7 2024-06-09 1 0 300
#> 8 2024-06-16 1 0 300
#> 9 2024-06-23 0 1 300
#> 10 2024-06-30 0 1 300
#> # ℹ 13 more rows
# Return summary table
identify_usage_segments(
data = pq_data,
metric = "Emails_sent",
version = "12w",
return = "table"
)
#> Usage segments summary table (12-week version)
#> # A tibble: 23 × 4
#> MetricDate `Novice User` `Power User` n
#> <date> <dbl> <dbl> <int>
#> 1 2024-04-28 1 0 300
#> 2 2024-05-05 1 0 300
#> 3 2024-05-12 1 0 300
#> 4 2024-05-19 1 0 300
#> 5 2024-05-26 1 0 300
#> 6 2024-06-02 1 0 300
#> 7 2024-06-09 1 0 300
#> 8 2024-06-16 1 0 300
#> 9 2024-06-23 0 1 300
#> 10 2024-06-30 0 1 300
#> # ℹ 13 more rows