Eleven production-ready Power BI reports, add-ons, and PowerShell exporters that turn your tenant's audit logs and Viva Insights data into a complete picture of Copilot adoption, impact, and readiness.
Browse the catalog
Every report, add-on, and exporter grouped into clear categories. Click a topic to filter the matrix, or open a report directly.
Copilot and agent activity across the tenant.
Productivity lift, financial value, and sentiment.
License placement, activation, and champions.
The human metrics โ focus time and personal leverage.
GitHub Copilot leverage for engineers.
Microsoft Copilot Cowork outcomes and value.
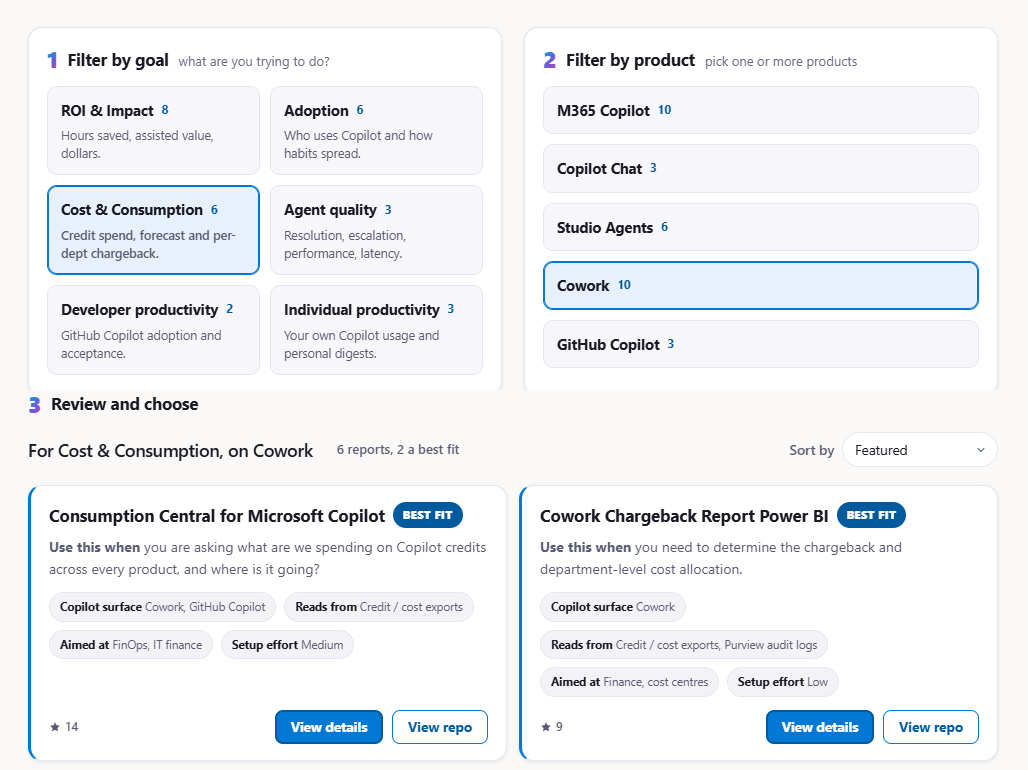
Credits, chargeback, and cost modeling for Cowork.
Data plumbing and add-on libraries that power the reports.
Each report breaks these into dozens of dimensions โ department, persona, geography, tenure, license type, time-of-day, cohort. See the full report matrix โ
Where to next
Three ways in. Every page is standalone, interactive, and links back here.
Searchable matrix of every dashboard, add-on, and exporter. Click a row to expand the preview, jump to the repo, grab the zip, or open a pre-filled admin email.
Browse all reports โInteractive ecosystem map. Click any source โ Viva, Purview, Entra, Graph, GitHub, Local Sessions โ to trace exactly which reports it feeds and what they produce.
Open the diagram โReal outcomes from real deployments. EPAM, Wipro, NHS, Allegis Group, Lloyds Banking Group โ filter by industry, see the metrics, read the published source.
Read the stories โMicrosoft Growth & Incubation
People Scientists, Business Value Advisors, and Solutions Architects behind every report in the Hub. We read every issue, reply to every email, and feed your friction back into the next release. If a report helped you ship something, we'd love to amplify it.