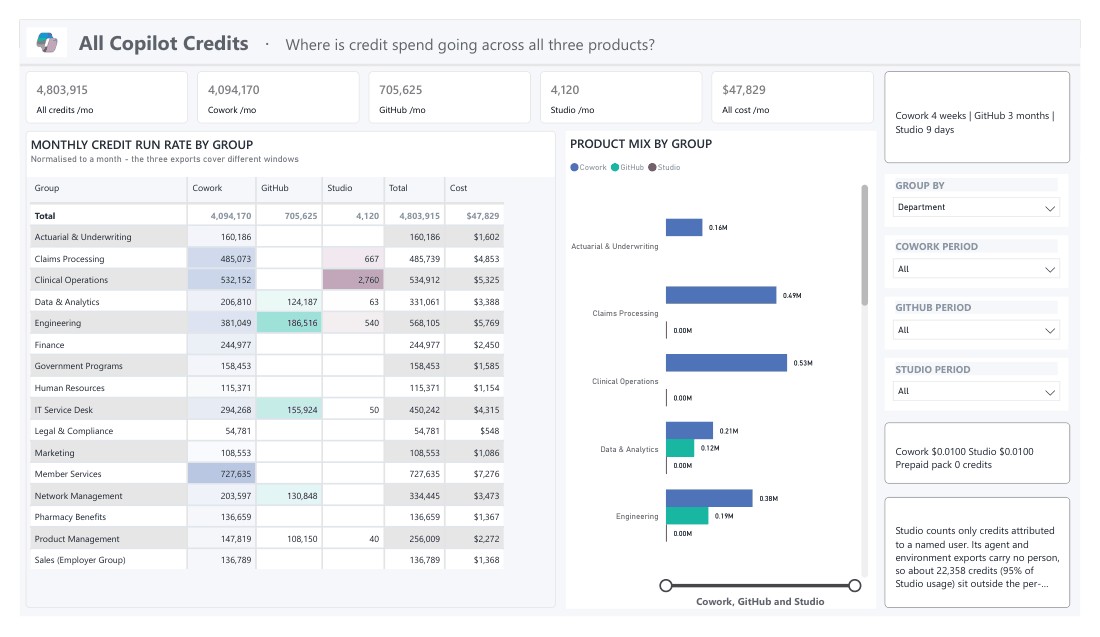
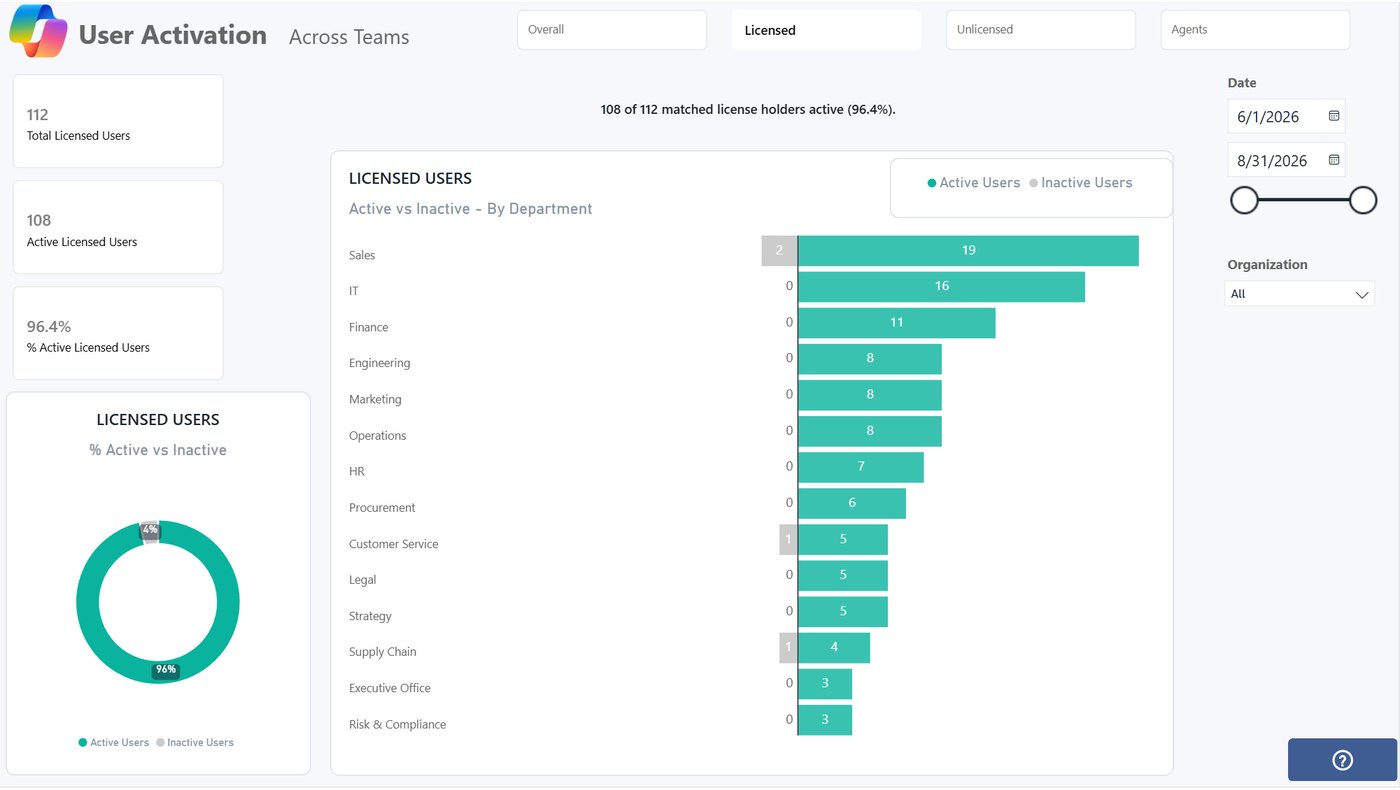
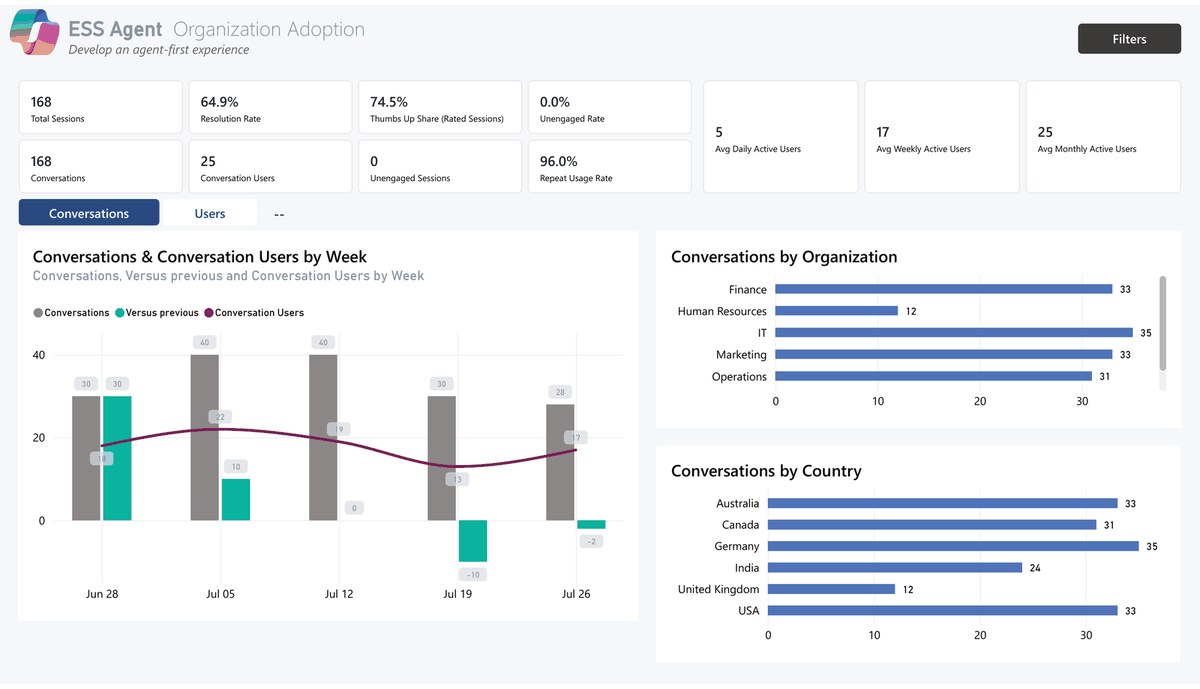
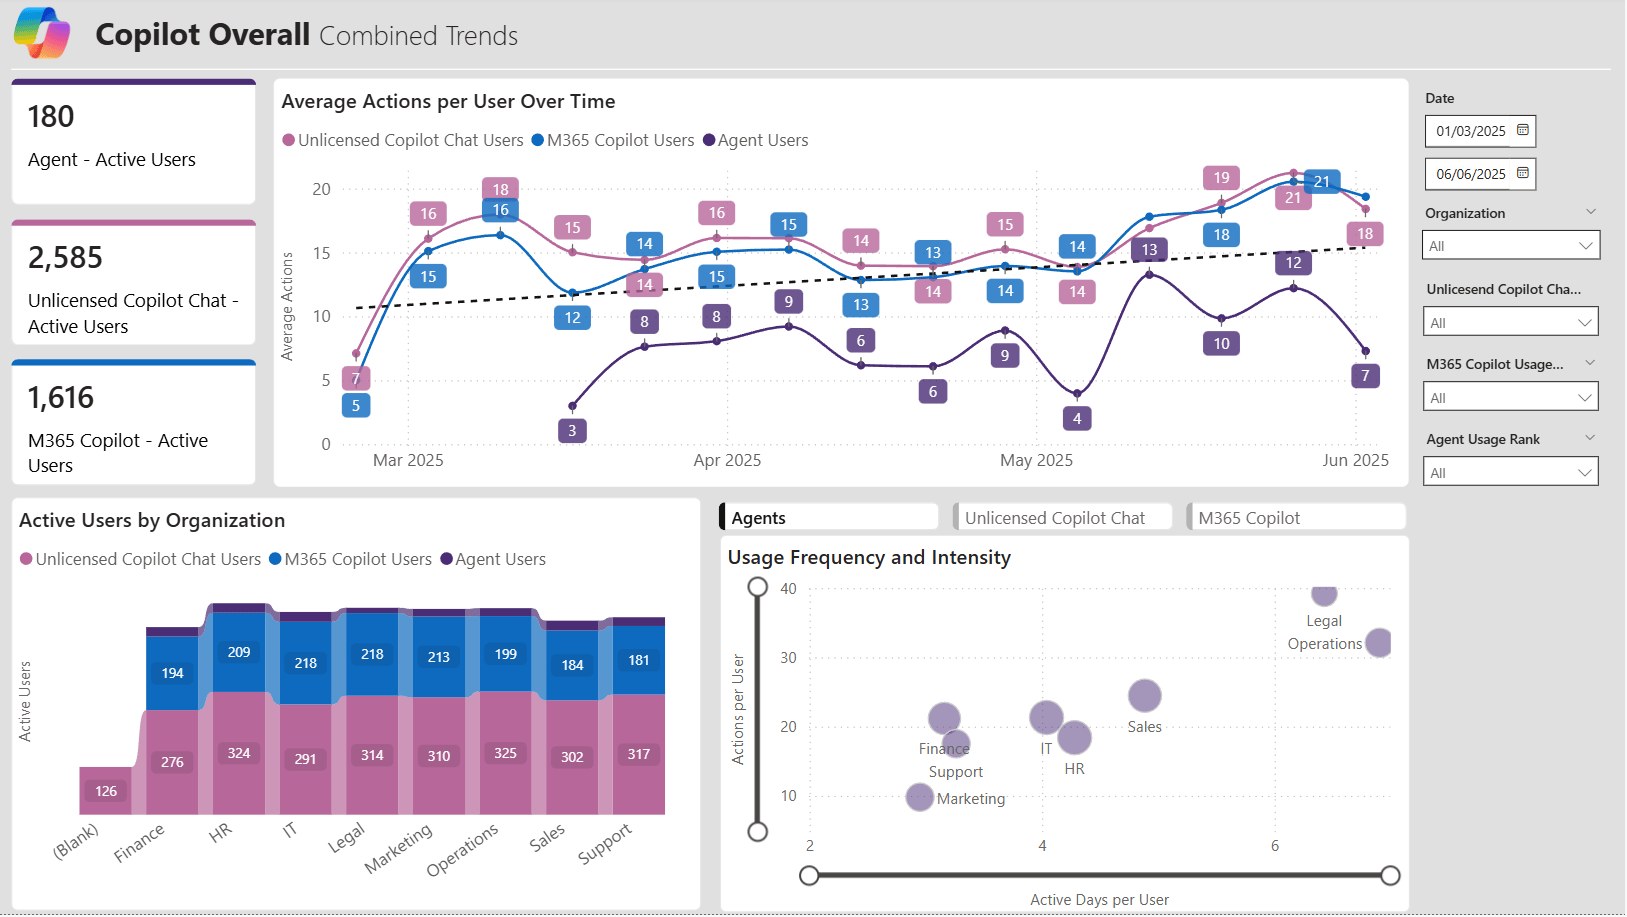
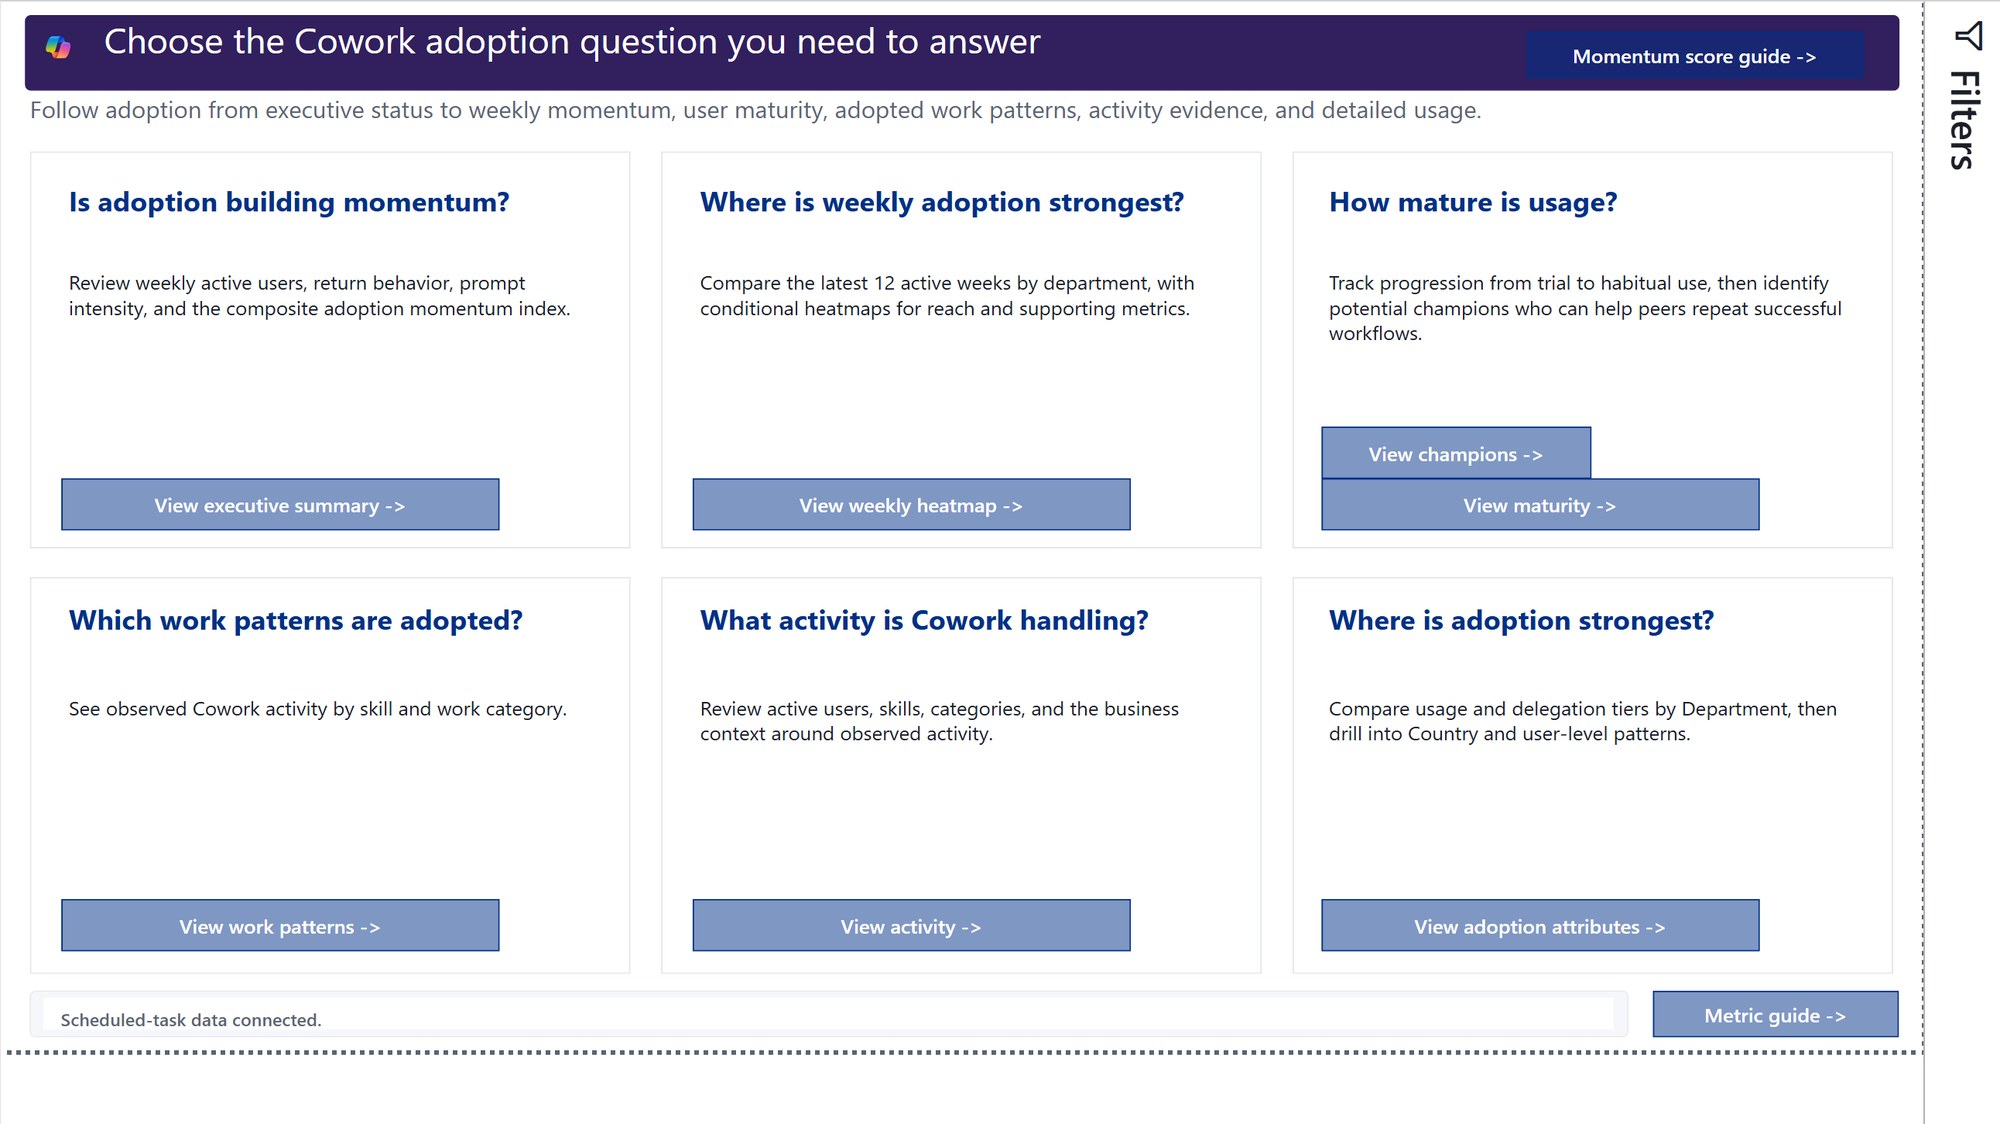
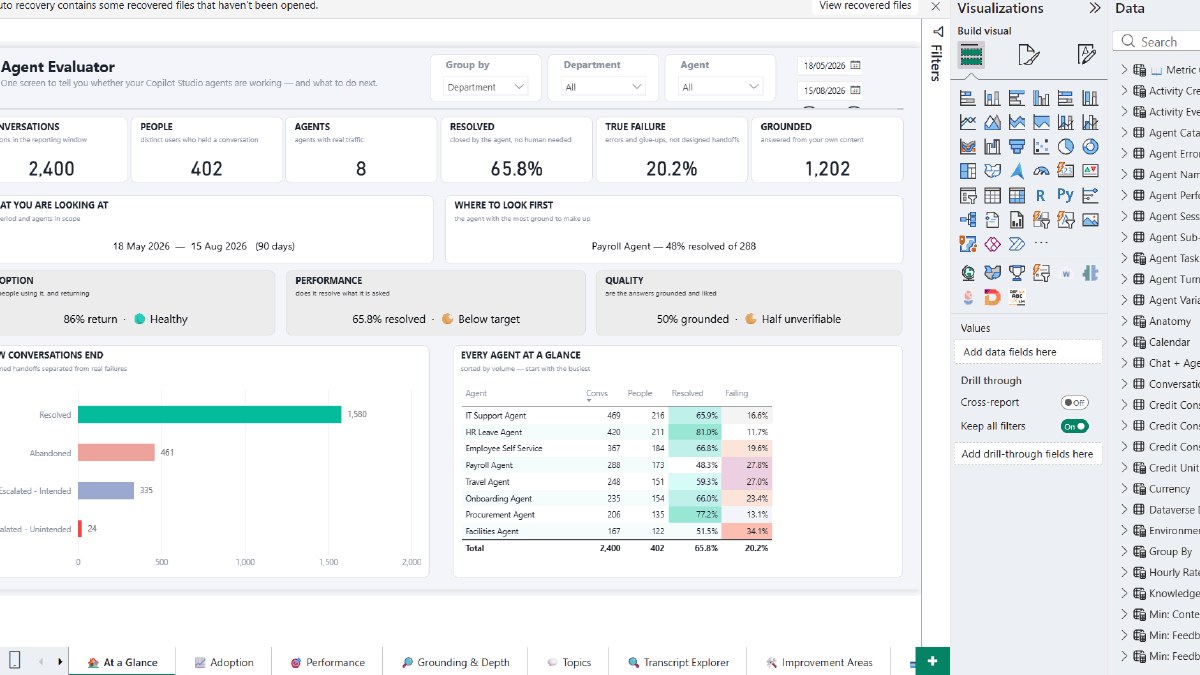
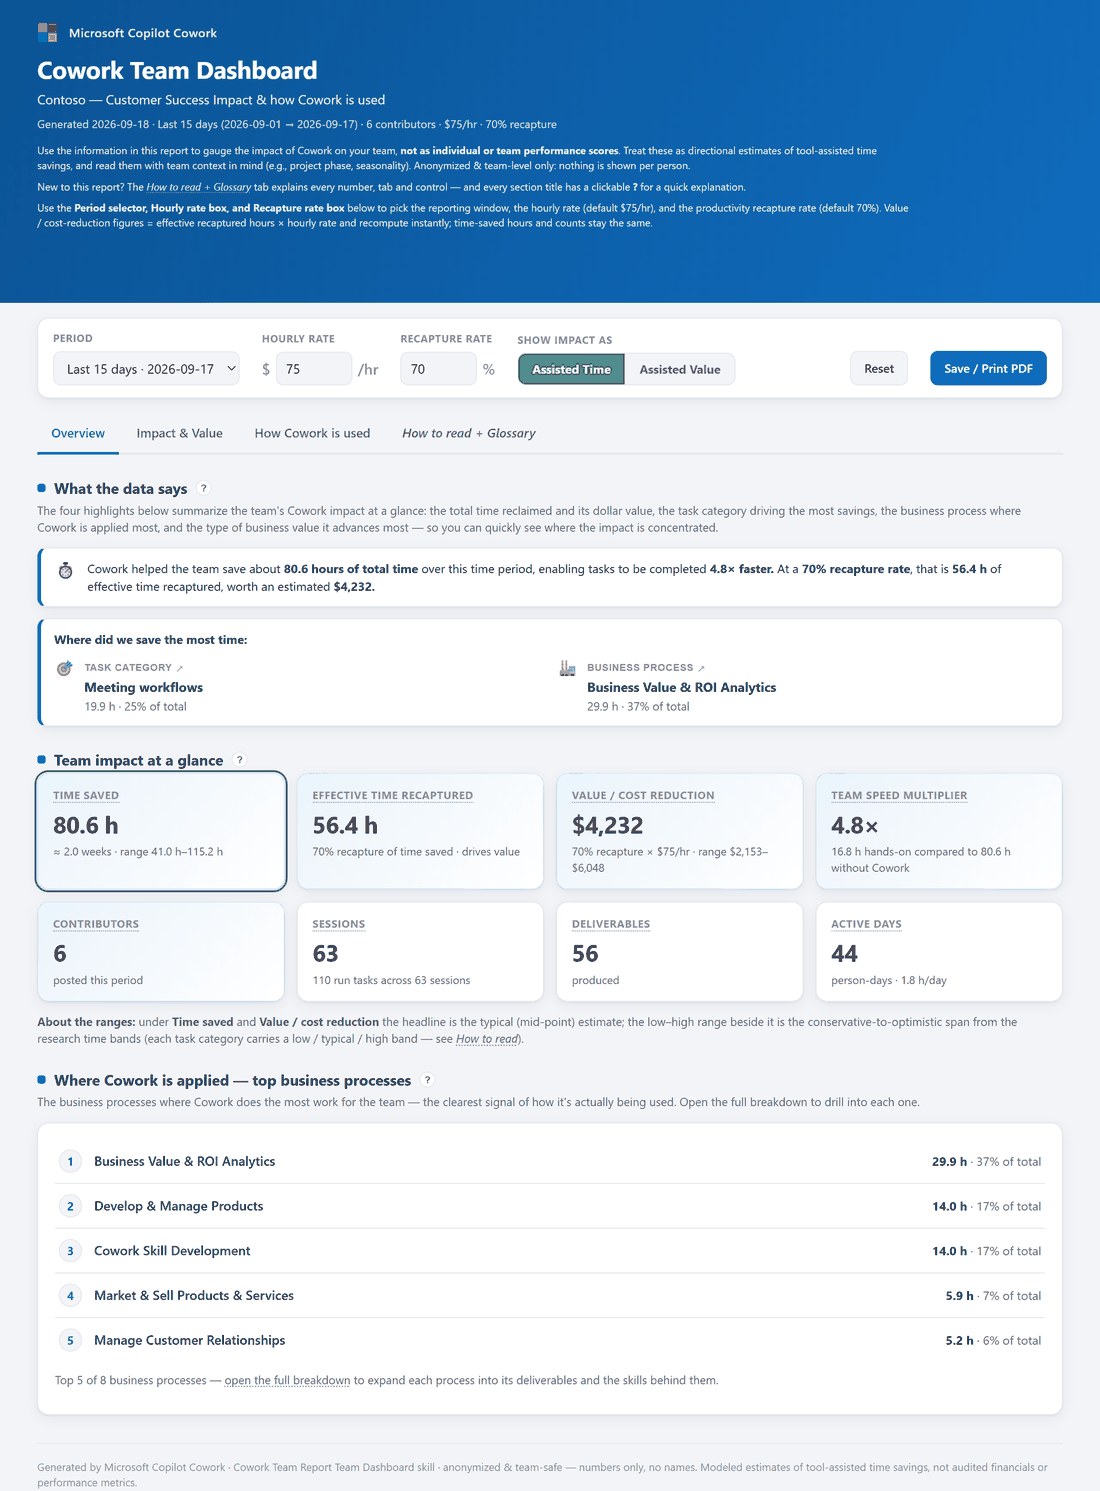
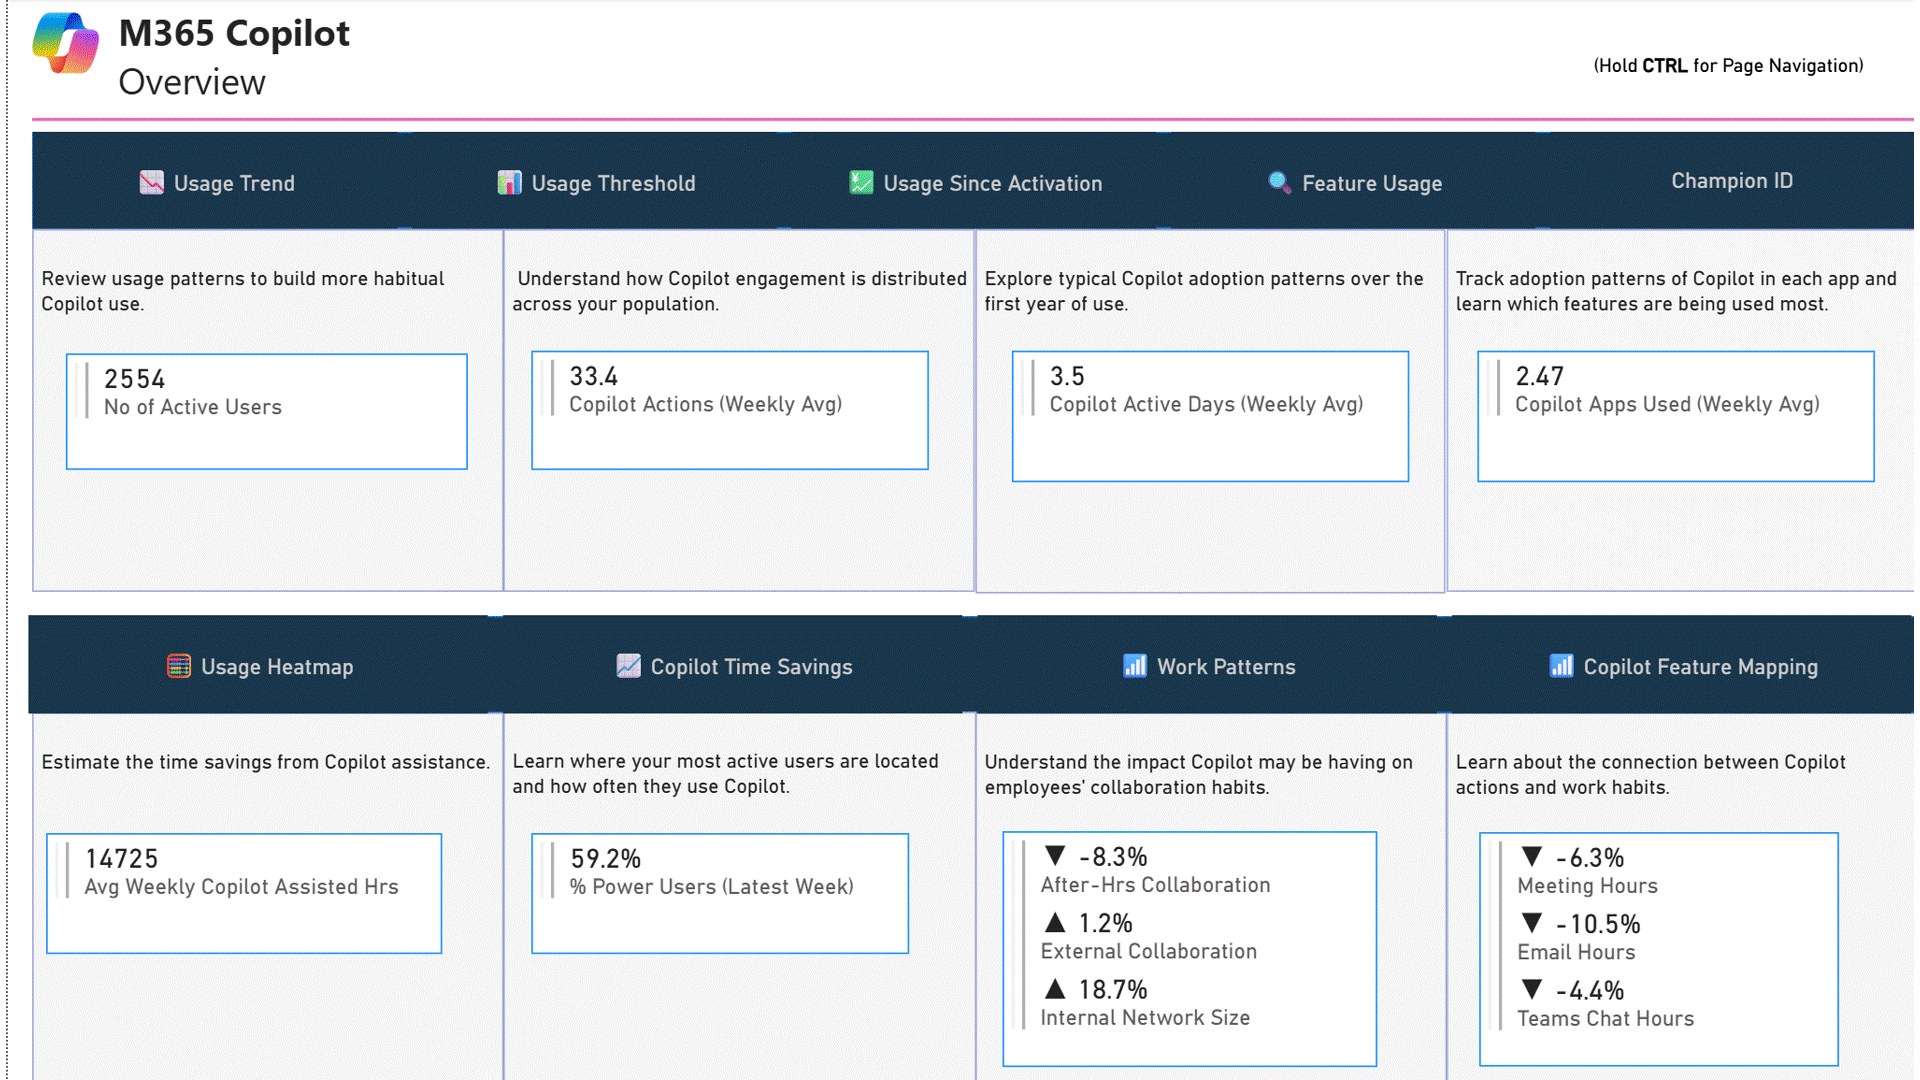
Answer step 1, or pick a surface in step 2, or both. We rank the reports that
answer it and put the ones built for the job first. Every recommendation opens
the same detail view as the cards.
for Microsoft Copilot — one Power BI template for Copilot credit consumption and cost
What you're consuming · what it costs · where to trim · what next year looks like
BUILT BY MICROSOFTPOWER BI TEMPLATE
1 / 14
Auto-playing · use ‹ › to step through each page, or click a dot to jump
Pick how your data gets in. Bring whichever products you have; missing ones just leave their pages empty. Each path ends the same way: open the .pbit, fill in one or two parameters, click Load.
Turn on Viva identification(only if you want per-person or department views)
Viva Insights ships Copilot data de-identified, so it can't be joined to your other sources until this is on. Cowork totals are correct either way.
A Global Administrator or AI Administrator, about two minutes:
This processes personal data. Check whether per-person reporting needs works-council consent or employee notification where you operate — your organisation is the data controller, not Microsoft. The connector does not enforce Viva's minimum group size, so apply any privacy threshold in the report yourself.
⏱ ~10 minutes · Power BI Pro · no Fabric capacity
Download your exports, drop them in one folder, point the template at it.
1 Make a folder
Anywhere on disk — C:\Consumption Central\Data is fine.
2 Put your exports in it
File names don't have to match exactly — the template recognises the usual variations. Grab only the products you have:
Try it with sample data first: point DataFolder at 5. Local CSV/sample-data and the whole report fills in.
Only want department views? Expand Turn on Viva identification above. On this path a de-identified export's PersonPolicyMap.csv also bridges the hash if you include it.
⏱ An afternoon · needs Fabric capacity (F SKU or eligible trial) · PPU is not Fabric capacity
Set it up once, then it refreshes itself. Data lands in a Lakehouse; the report reads it on a schedule and accumulates history beyond Viva's 6-month export window.
Attach your Lakehouse before running any notebook
The notebooks have noWorkspace or Lakehouse setting. They write with saveAsTable(...) and read from Files/landing/…, both of which target the notebook's attached default Lakehouse. So for each notebook you use: Explorer pane → Add your Lakehouse → set it as the default (the star). That's what points the notebook at your data. The only things you edit in the top cell are source-specific (an enterprise slug, a Key Vault URL, a date window), and several notebooks need nothing beyond dropping a file in the landing folder.
1 Create a Lakehouse
Fabric portal → your workspace → New → Lakehouse. Everything below writes into this one.
2 Set up Viva — preferred route, no notebook
Viva Insights ships a certified Dataflow Gen2 connector that writes query results straight into your Lakehouse on a schedule.
Viva Insights → Analysis → build a custom query with the Copilot credit metrics → Analysis results → your query → the link icon. Copy the Partition identifier and Query identifier.
Fabric → New → Dataflow Gen2 → Get data → search Viva Insights under Online Services.
Paste both identifiers, leave Query Name blank. Advanced options: Schema Type = Pivoted, Data Granularity = Row-level data. Auth with an Organizational account.
Set the Lakehouse as destination, name the table viva_credits_weekly, keep the person identifiers + metric + attribute columns. Schedule Tue ~8am PST, after Viva's weekend refresh.
Two gotchasLeaving Query Name blank only works against a custom query you built in Analysis — the Consumption Dashboard's own export is multi-table and needs a table name. And turn on Auto-refresh for the query itself in Viva, or the Dataflow keeps refreshing a result that never changes.
From 2. Fabric/notebooks/ — import only the ones you need, set the imported Lakehouse as the notebook's default (see the note above), fill in whatever the top cell lists, run. What each one needs and writes:
Notebook auth is explicit — a notebook managed identity is not enoughIngest_Azure_AI and Ingest_Studio_Consumption read a secret from Key Vault and exchange it for an ARM / Power Platform token. Fabric's getToken audiences do not include ARM or the Power Platform API, so set up the Entra app + Key Vault secret first — Azure ingestion setup →. Leave Azure out and the Foundry page is simply empty (supported).
Ingest_Studio_Consumption is not a substitute yet
It is in testing, and a scheduled Fabric refresh cannot authenticate to that API at all — the permission it needs exists only as a delegated one. Use Ingest_Studio (the CSV route) for Studio. Details →
Publish to your workspace, then schedule ingestion before the semantic-model refresh — refresh only on ingestion success, never on failure or while a writer is running (a Power BI refresh alone does not call Azure or run notebooks). Tuesday morning suits Viva; Azure can run daily.
Try it with sample data first:seed_sample_data.py loads the synthetic dataset straight into your Lakehouse.
Two things to get rightLeave the GitHub Copilot credit metric out of the query — it makes the query fail in Viva before Power BI is involved (take GitHub from the GitHub export instead). And build your own custom query under Analysis; the Consumption Dashboard's "Connect data" dialog hands out identifiers that point at a multi-table result this template can't request — that returns (500) Internal Server Error.
Adding the other products (optional): set DataFolder to a folder of whatever exports you have — found by name, nothing to rename. Leave it blank for consumption-only. Policy names need M365SpendingPolicyMetaData.csv from the Viva query download.
Heads up on department views: this live-connection path has no PersonPolicyMap.csv bridge, so if Viva identities stay hashed, department breakdowns can't be built at all. Expand Turn on Viva identification above first.
⏱ An afternoon · Power Platform + Dataverse · no Fabric capacity
Power Automate pulls consumption on a schedule, writes it to Dataverse tables, Power BI reads those tables. Have Fabric? Use tab 2 instead.
In testing — not yet verified end to end
The Copilot Studio flows read /licensing/entitlements/MCSMessages/resources, which currently returns 403 even for a Global Administrator with every relevant scope consented. The Azure and GitHub flows do not depend on it. Studio flows must also be owned by an administrator — the Power Platform API has no application role for licensing, so a service principal can't read it. What was tried →
python Deploy-DataverseSchema.py --environment https://your-org.crm.dynamics.com
# then, with a token in DATAVERSE_TOKEN:
python Deploy-DataverseSchema.py --environment https://your-org.crm.dynamics.com --execute
2 Import the flows
make.powerautomate.com → My flows → Import → Import Package (Legacy) → upload ConsumptionCentral-Dataverse.zip → set the Dataverse + Key Vault connections. Eight flows (a daily + a backfill per feed) import switched off.
3 Fill in connection details
Open each daily flow and set TenantId, ClientId (app reg from PERMISSIONS.md) and DataverseUrl in its first action. The secret is read from Key Vault under consumption-central-client-secret.
4 Run the first load
Run each Backfill flow once by hand (last 180 days, ~10–30 min each; let each finish first). Then switch on the four daily flows.
cc_ (leave unless you changed the publisher prefix)
Click Load, then Publish and set a scheduled refresh.
What the flows do and don't fill
Only the four API-backed feeds are automated: studio_tenant_daily, studio_agent, azure_ai_spend, github_ai_usage. The other seven tables have no API — load them by hand via Data → Import in make.powerapps.com, or use tab 1 / tab 2 to populate every page.
PAX: Portable Audit eXporter
The PowerShell engine that exports Microsoft 365 Copilot, agent, and workload audit data, ready for Power BI, a lake, or a warehouse
Pulls from Purview, Entra, and the Microsoft 365 admin center over the Graph API · no row limits · lands data locally, in SharePoint, or straight into Microsoft Fabric
BUILT BY MICROSOFTPOWERSHELL SCRIPTGRAPH API
PAX is the tool that produces the data, so connecting your data here means running PAX. If you do not live in the command line, start with Mini-Kitchen (tab 1): it builds the exact PAX command for you in the browser, and you run it. Prefer to script it yourself, or send output to SharePoint or Fabric? Those are the next two tabs. Every path pulls the same records from Microsoft Purview, Microsoft Entra, and the Microsoft 365 admin center, and writes analysis-ready output you point Power BI at.
Turn on unified audit logging(required before your first run)
PAX reads the Microsoft 365 unified audit log. With logging off, every query returns zero rows and nothing tells you why. It does not backfill, so a tenant that just switched it on starts thin.
A Global Administrator or a role with audit access, about two minutes:
If you see the banner Start recording user and admin activity, click it. Allow up to a few hours for logging to begin.
Microsoft began enforcing a new AuditLogsQuery.Read.All permission in April 2026. With only the legacy permission, audit calls appear to succeed and silently return zero records, so make sure admin consent is granted. PAX v1.10.9 and later request the correct scopes.
PAX output is raw, attributable audit data
Records are exported exactly as Purview returns them, not hashed, masked, or anonymised. Treat every output file as Highly Confidential, restrict access, and encrypt it at rest and in transit.
Point and click a PAX command in the browser, copy it, then run it yourself. Mini-Kitchen never connects to your tenant and stores no credentials. It only writes the command.
1 Open Mini-Kitchen and pick a preset
Open Mini-Kitchen and start from a preset. Nothing you type there leaves the browser.
Preset
What it collects
AI-in-One Dashboard
Copilot interactions plus Entra user info, rolled up. Does not pull the broader M365 bundle.
AI Business Value Dashboard
The same Copilot rollup, shaped for the AI Business Value dashboard.
M365 Usage Dashboard
Adds the Exchange, OneDrive, SharePoint, and Teams audit bundle alongside Copilot.
Entra user info only
Skips the audit query and pulls Entra user details only.
Microsoft Agent 365 catalog
Exports the Microsoft Agent 365 catalog only.
None of these fit? Choose Custom audit export and set the scope yourself.
2 Build the recipe
Work down the builder: scope, date range, rollup, filters, output target, and sign-in. To keep a recipe, click Export for a .paxlite file. Saved recipes live in browser storage only, so clearing site data deletes them.
3 Copy the command and run it
Copy the command Mini-Kitchen built. Download the PAX script from the PAX releases page, open PowerShell 7, and paste it in. This is the step that reaches your tenant. Mini-Kitchen never did.
First time? Pick AI-in-One Dashboard, a short date range, and a local output folder, then run it once to see the shape of the data.
~20 minutes · PowerShell 7 · Microsoft.Graph SDK
Download the script and drive it with switches. Full control, fully scriptable, no browser step.
1 Download the script
Most people want the flagship Purview Audit Log Processor. There are three scripts, for different needs:
You need the actual prompt and response content, not just usage telemetry.
2 Run a scoped export
In PowerShell 7, run the date range you need. -Rollup produces the dashboard-ready summary files, -IncludeUserInfo adds Entra names and departments, and -IncludeM365Usage adds the broader workload bundle:
Point your Power BI template at the rollup CSVs the run produced. The script documentation lists every switch and output file.
Dashboards read rollup output, not raw records
The Power BI templates load the rolled-up summary files, so include -Rollup. Add -RollupPlusRaw if you also want the raw per-record CSV.
an afternoon · SharePoint or Fabric · runs headless
PAX writes wherever -OutputPath points. Give it a local path, a SharePoint library URL, or a Microsoft Fabric OneLake URL, and it detects the destination from the URL shape. There are no destination-specific switches.
One run, one destination tier
Every output path in a single run must resolve to the same tier. Do not mix local, SharePoint, and Fabric in one invocation.
2 Run it unattended (optional)
For a scheduled Azure run with no interactive sign-in, use a managed identity or an app registration. A managed identity suits Azure Container Apps Jobs, VMs, and Functions:
Extra access for remote destinations
SharePoint output needs Sites.ReadWrite.All plus Member access on the target site. Fabric output needs Contributor on the workspace, Storage Blob Data Contributor, and the Service principals can use Fabric APIs tenant setting turned on for app-registration or managed-identity runs.
for Microsoft Copilot — one Power BI template for every Copilot and agent adoption signal
Hours saved · assisted value · adoption and readiness · the business case
BUILT BY MICROSOFTPOWER BI TEMPLATEVERSION 2.0UPDATED OCT 5, 2026
1 / 19
Auto-playing · use ‹ › to step through each page, or click a dot to jump
Every path builds the same dashboard from the same core sources: Copilot interactions from Microsoft Purview audit logs, your licensed users from the Microsoft 365 admin center, and department data from Microsoft Entra. The template reads two pre-processed rollup files, not a raw Purview or Entra export. New here, start with Local CSV and its bundled sample data.
Do this first — turn on unified audit logging
ValueLens reads the Purview unified audit log. If it is off, the audit query comes back empty. It is on by default for most tenants but often off in demo, dev or brand-new tenants, so check before you start. In the Purview portal, if you see Start recording user and admin activity, click it. Turning it on does not backfill, collection starts from that moment and can take up to 24 hours to appear, so a new tenant's first export looks sparse. That is expected.
Start here — produce the two rollup files (Mini-Kitchen)(the no-install way, used by the Local CSV and SharePoint tabs)
The template needs two pre-processed rollup files and cannot read a raw Purview CSV or a hand-exported Entra list. Mini-Kitchen is the guided, no-install way to produce them: it runs entirely in your browser, drives the open-source PAX engine, and ships an AI Business Value Dashboard preset that fills in exactly the right collection settings for this dashboard, so you do not have to understand the audit internals.
Open Mini-Kitchen and choose the AI Business Value Dashboard preset. It runs entirely in that browser tab, no tenant data is pulled here, no account info is collected, no secrets are stored.
Work down the builder (name the recipe, data scope, what to collect, date range, rollup, filters, output location, sign-in). Export the result as a .paxlite recipe if you want to reuse it.
Copy the command it built. Download the PAX engine from the PAX repository, open PowerShell 7, and paste the command. This is the step that reaches your tenant, Mini-Kitchen never did.
You get an *_Interactions_*.csv and a *_Users_*.csv. To keep the dashboard fresh, re-run the command on a cadence (for example a Windows Task Scheduler job).
Already export raw data another way? The report's standalone processor Purview_CopilotInteraction_Processor_v4.0.0.py turns a raw Purview export plus an Entra users CSV into the same two rollup files, no Mini-Kitchen: --purview raw.csv --entra users.csv --licensing lic.csv --profile aibv.
Producing this data reads tenant audit and directory information. Typical roles: Audit Reader (Purview), Global Reader or User Administrator (Entra and licensing). If exported names come back as 32-character hex, clear Display concealed names in Microsoft 365 admin center → Settings → Org settings → Reports, then re-run.
Register an app for automatic pulls(the SharePoint packaged scripts, Fabric, and Dataverse paths)
The packaged SharePoint pipeline and the Fabric and Dataverse paths pull from Microsoft Graph unattended, so they need one Entra app registration. The Mini-Kitchen route above does not, it signs in interactively when you run the command.
Add three Microsoft Graph application permissions and grant admin consent: AuditLogsQuery.Read.All (audit interactions), Reports.Read.All (licensed users), User.Read.All (org data). The packaged SharePoint scripts also use Sites.Selected to write to your library, and Organization.Read.All for the licence lookup fallback.
Create a client secret and store it in Azure Key Vault, not in a script or notebook
Optional Agents 365 needs CopilotPackages.Read.All + Application.Read.All + User.Read.All and an Agent 365 licence. Full least-privilege breakdown: docs/PERMISSIONS.md.
⏱ ~2 min with sample data, ~20 min with your own · Power BI Desktop only
See the whole dashboard now on a bundled sample dataset, or point it at your own rollup files. Manual refresh by design.
1 See it now with sample data
Open ValueLens - Local CSV.pbit in Power BI Desktop (its parameters take local file paths, do not open the SharePoint template here). Point each parameter at the matching file in 5. Local CSV/sample-data, then Load. Every page fills in, no tenant needed.
Copilot Interactions File
copilot_interactions_sample.csv
Org Data File
copilot_users_sample.csv
Agent 365 (optional)
agents_365_sample.csv
2 Produce your two rollup files
Use Mini-Kitchen with the AI Business Value Dashboard preset, see Start here above. Pick a local output folder, then run the command it builds in PowerShell 7. You get an *_Interactions_*.csv and a *_Users_*.csv.
3 Point the template at your files
Open the same ValueLens - Local CSV.pbit, set Copilot Interactions File to your *_Interactions_*.csv and Org Data File to your *_Users_*.csv, then Load.
4 Refresh when you need to
Re-run the Mini-Kitchen command to regenerate the files, then Refresh in Power BI Desktop.
Blank visuals almost always mean the file is a raw export, not a rollup. The template reads the pre-processed *_Interactions_*.csv / *_Users_*.csv pair only.
Large tenant? The Purview UI export caps out early, but the PAX engine partitions the query and runs unattended, so the Mini-Kitchen route above scales where a hand export does not.
⏱ Scheduled, hands-off · Power BI Pro · no Fabric capacity
Land the two rollup files in a SharePoint library and let Power BI refresh from there on a timer. Two ways to produce and land them: Mini-Kitchen with the AI Business Value Dashboard preset set to a SharePoint output folder and re-run on a Task Scheduler cadence (see Start here above, no install), or the report's own packaged scripts below, which wrap the PAX engine with app-only auth, seed-then-append de-duplication, upload and scheduling in one. The packaged route needs the app registration above, a SharePoint library, and a host with PowerShell 7+ and Python 3.10+.
1 Grant the app write access to your site
Run ProvisionSiteAccess-SP-AppReg.ps1 to grant the app per-library Sites.Selected write. Save the SiteId and DriveId it prints, the upload step needs both.
2 Seed, then append
The interactions data is a growing time series, so Run-PAX-AIBV.ps1 seeds a back-fill once, then appends short windows. It de-duplicates on each message identity, so overlapping days reconcile.
# First run, seed the file with a back-fill
.\Run-PAX-AIBV.ps1 -TenantId <id> -ClientId <id> -Days 30
# Scheduled runs, append only the latest window
.\Run-PAX-AIBV.ps1 -TenantId <id> -ClientId <id> -Days 2 `
    -AppendFile Purview_CopilotInteraction_Rollup.csv
Add -IncludeAgent365Info for the optional Agents 365 output, or -UserInfoFile to supply your own org directory instead of pulling Entra live.
3 Upload the rollups
Upload-Rollups-SharePoint.ps1 lands them as fixed names copilot_interactions_rollup.csv and copilot_users_rollup.csv, overwriting the previous run.
4 Put it on a schedule
Register-TaskScheduler.ps1 registers a daily task with -AppendFile. The secret is not stored in the task.
5 Connect the template
Open ValueLens - SharePoint.pbit, and under Transform data → Edit parameters point Copilot Interactions File and Org Data File at the two SharePoint URLs. Load → Publish, then in the Power BI service set the SharePoint data-source credentials and a scheduled refresh timed after your extract.
Tops out at Power BI Pro's 1 GB model and 2-hour refresh window. Beyond that, move to Fabric.
⏱ Pipeline-orchestrated · Fabric capacity (F2+ or trial), Premium or PPU · recommended at scale
PySpark notebooks pull straight from Graph into a Lakehouse, a processor builds the curated fact table, and an Import-mode template reads it. No file caps, and the optional feedback and Agent 365 sources plug into the same model. Needs the app registration above, with its secret in Key Vault.
Fastest way: the one-click installer
A Windows installer now sets everything up in your tenant and gives you the dashboard as a Fabric app called Analytics Hub, with no terminal and no Power BI Desktop. Download AnalyticsHubInstaller.exe, open it, and follow the steps in your browser. You still need a Fabric capacity (F2+ or trial), an Azure subscription for a Key Vault, and permission to register an Entra app. An admin grants the Graph consent and turns on three Fabric tenant settings (Service principals can call Fabric public APIs, Semantic Model Execute Queries REST API, and Fabric App items). Check what you need first. Prefer to wire it by hand? The manual steps below use the same files.
Manual setup (no installer), the same path the walkthrough video follows:
▶ Full Fabric setup walkthrough — from a fresh app registration to a saved, self-refreshing Power BI report. Also on the 1. Fabric setup page.
1 Create a Lakehouse
Fabric portal → your workspace (on capacity) → New → Lakehouse. Note its SQL analytics endpoint, or the workspace and Lakehouse GUIDs if you use the OneLake template.
Set RangeStart and RangeEnd to cover the history you want, keep Enable_ProductFeedback and Enable_Agent365 on Exclude until those tables exist, then Load.
5 Publish and schedule
Publish, set the data-source credentials in the service, then add a success-gated model refresh that runs after the pipeline succeeds. See pipelines/README.md. The shipped pipeline JSON has no refresh activity, you add it.
Optional sources
Agents 365 comes from either Copilot_Agent365_Registry_Ingester (preferred, unattended) or Copilot_Agent365_Lander (CSV fallback), never both. The shipped pipeline wires the CSV lander. Product feedback lands from Files/product_feedback/ behind Enable_ProductFeedback.
⏱ Preview · Power Automate premium + Dataverse capacity · plus Power BI
A Power Automate collector writes full audit records to Dataverse, a scheduled runner uses the same ValueLens processor to prepare them, and the template reads the result. Use this only if you are already collecting Copilot interactions into Dataverse. For the settled routes, use SharePoint or Fabric.
Preview, validated on a bounded interval
This is not a flow-only deployment and not certified for production-scale or unattended refresh. You advance the snapshot parameter by hand. Benchmark it before committing to a cadence.
Deploy-DataverseCoreSchema.py dry-runs with no credentials, then creates the tables with --execute and a DATAVERSE_TOKEN: raw audits, curated interactions, curated users, and run manifests.
3 Import the collector flow
Supply your authorized unmanaged CopilotInteractionLogging.zip, adapt it for full-record retention with Prepare-CollectorRawCapture.py, then import it into an isolated Power Platform environment. Run the manual back-fill before enabling its daily schedule.
4 Build a snapshot
Invoke-DataverseCoreRefresh.ps1 fetches Graph users and licences, reads the retained audits, runs the processor, and emits a Core Snapshot ID on success. Pin it to a completed collector run and its exact UTC window with -SourceRunId, -RawStartUtc and -RawEndUtc.
Your environment origin, e.g. https://contoso.crm.dynamics.com
Core Snapshot ID
The successful run ID from step 4
Use SharePoint CSV fallback
Leave false for this path
Load, then Publish and set organizational Dataverse credentials. To refresh, update Core Snapshot ID to a newer completed run.
Needs both an Entra app with Graph audit and directory permissions and a Dataverse application user, consent to Graph does not grant Dataverse access. See the path README.
ESS Insights
Employee Self-Serve Business Value — one Power BI template for your Copilot Studio agent
Who’s adopting it · what it resolves · tickets deflected · hours and dollars saved
BUILT BY MICROSOFTPOWER BI TEMPLATE
1 / 9
Auto-playing · use ‹ › to step through each page, or click a dot to jump
Pick how your data gets in. All three paths read the same Copilot Studio conversation transcripts and drive the same nine pages; they differ only in how the data arrives and how it refreshes. Want to see it first with zero setup? Open ESS Dashboard - DEMO PBIX.pbix to explore all nine pages on sample data before you arrange any access.
Turn on transcript capture(do this once before any of the paths below)
The dashboard reads the transcripts Copilot Studio writes for each conversation. Those exist only if the agent is set to save them, and Dataverse keeps them for 30 days by default. A Copilot Studio maker or admin, a few minutes:
In Copilot Studio, open the agent → Settings → Advanced → Conversation transcripts. Confirm Save conversation transcripts to Dataverse is On and node-level details are included, then save or publish.
Confirm the agent runs in a Production, Sandbox, or Default Dataverse environment. Teams and Microsoft 365 Copilot environments do not write transcripts and cannot be used.
Grant the analyst the Bot Transcript Viewer security role on that environment. Environment Maker is not enough. (The Fabric path uses an app registration instead, see tab 3.)
To keep more than 30 days of history, have an admin extend the environment’s retention window before the data you want exists.
Export the transcript table once, point the template at the file. Best for a snapshot, a demo, or sharing outside your tenant.
1 Export your transcripts
Open the Power Apps maker portal, switch to the agent’s environment, go to Tables then All, search conversation, open ConversationTranscript, then Export then Export data. Download the result and unzip the CSV. The default window is the last 30 days.
Do not open this CSV in Excel
Excel silently corrupts the JSON in the Content column and the template fails to load with a Token Identifier expected error. If you opened it, re-export from Dataverse rather than trying to repair it.
2 Add org data and credits optional
A roster CSV that maps UserPrincipalName to Department and Country unlocks the Organization and Country breakdowns. From the Microsoft 365 admin center: Users → Active users → Export users → Confirm (the template normalizes the column names). For the credit-consumption leaderboard, add an export from Copilot Studio → Analytics → Message Consumption. Both are optional; the report loads without them.
Want scheduled refresh without a gateway? Host the transcript CSV on SharePoint or OneDrive and point the parameter at its direct file URL, then bind credentials in the service. See AUTO-REFRESH.md.
⏱ ~5 minutes · no gateway · recommended for production
Connect the template straight to the Dataverse environment that hosts your agent and let it refresh itself. No file exports, no gateway.
1 Get the environment URL
Power Apps → switch to the agent’s environment → ⚙ gear icon → Session details → copy the Instance url (like https://orgXXXXXXXX.crm.dynamics.com). Drop the trailing slash; the connector is picky about it.
2 Add org data and credits optional
Same optional roster and Message Consumption files as the CSV path (see tab 1). Paste their paths into the matching parameters.
Leave blank for 90. The filter runs server-side, so a smaller window refreshes faster.
Click Load.
4 Sign in to Dataverse
When prompted, choose Organizational account, sign in with an account that holds the Bot Transcript Viewer role on that environment, then Connect. If it returns zero conversations, the account is missing that role, tenant admin is not the same thing.
Gateway-free scheduled refresh
Publishing to the Power BI service refreshes cloud-to-cloud with no gateway. Bind the Dataverse credential (OAuth2, Organizational) once, then set a schedule. Steps in AUTO-REFRESH.md.
One environment per file. For agents spread across several environments, either build one copy of the template per environment or use the Fabric path.
⏱ An afternoon · needs Fabric capacity (F SKU or eligible trial) · advanced
Notebooks land your transcripts and credit data in a Lakehouse, and the template reads from there. Use this only if you are consolidating multiple environments, hitting refresh limits at very large scale, or want built-in credit-consumption analytics and automatic offline topic classification. Otherwise stay on CSV Upload or Dataverse Direct.
Validate before productionESS - Fabric V1.pbit is structurally validated, but its refresh against a live Lakehouse is not yet confirmed. Run the full ingest to Lakehouse to refresh loop once, end to end, before you rely on it.
1 Create a Lakehouse
Fabric portal → your workspace → New → Lakehouse. Everything below writes into this one.
2 Import the transcript parser and fill its CONFIG
Import Copilot_Agent_Transcript_Parser.ipynb (New → Import notebook), then in the Explorer pane add your Lakehouse and set it as the default. In the CONFIG cell keep SOURCE_MODE = 'dataverse' and set TENANT_ID, CLIENT_ID, CLIENT_SECRET for an Entra app registration (read it from Key Vault with notebookutils.credentials.getSecret in production), plus DATAVERSE_URL, or a list in DATAVERSE_URLS to consolidate several environments. Run the preflight cell to confirm auth, then Run all. It writes agent_sessions and its companion tables and classifies every conversation by topic offline, with no data leaving your workspace.
The app registration is a higher bar than the other paths
It must be added as a Dataverse Application User with read on Conversation Transcript in every environment you ingest from, which usually needs a Dataverse or Entra admin. To skip it, set SOURCE_MODE = 'files' and drop an exported transcript CSV into the Lakehouse Files/ folder instead.
The parser is scoped to ESS agents by default (a filter keys on the copilotforemployeeselfservice schema). Comment out that one filter cell to ingest any Copilot Studio agent. Stage 2 of the offline classifier is toggleable with ENABLE_SEMANTIC_FALLBACK.
3 Import the credit ingester optional
Import Copilot_Credit_Consumption_Ingester.ipynb the same way. It reads the Message Consumption exports (the EntitlementConsumption... CSVs from Copilot Studio) from Files/credit_consumption in the Lakehouse, dropped there by hand or by a Power Automate flow, and writes the credit_consumption tables.
4 Open the template
Open ESS - Fabric V1.pbit, point it at your Lakehouse SQL analytics endpoint (Import or DirectQuery) or Direct Lake, then Refresh. Org data is still a separate roster file, the same one used on the other paths.
5 Schedule the notebooks recommended
Schedule both notebooks, or wrap them in a Fabric pipeline, so the Lakehouse stays current without manual runs.
One Power BI dashboard for every Microsoft Copilot and Agent adoption signal
M365 Copilot · Copilot Chat (licensed + unlicensed) · Agents · third-party AI — in one view
BUILT BY MICROSOFTPOWER BI TEMPLATE
1 / 13
Auto-playing · use ‹ › to step through each page, or click a dot to jump
Every number comes from the Microsoft Purview audit log plus Entra user and licensing data. You produce two pre-processed “rollup” files (the template can’t read raw exports), then open the edition that matches where your files live and how you want it to refresh. Pick your path below.
Do this first — turn on unified audit logging
The whole dashboard reads the Purview unified audit log. If it’s off, every export fails with AuditingDisabledTenant. It’s on by default for most tenants but often off in demo / dev / new tenants, so check before you start. In the Purview portal, if you see Start recording user and admin activity, click it. Enabling it does not backfill — collection starts from that moment and can take up to 24h to appear, so a brand-new tenant’s first export looks sparse. That’s expected.
Start here — how you produce the two input files (Mini-Kitchen)(the biggest time-saver — used by the Local and SharePoint tabs)
The template needs two pre-processed rollup files and can’t read a raw Purview CSV or a hand-exported Entra list. Mini-Kitchen is the guided, no-install way to produce them: it runs entirely in your browser, drives the open-source PAX engine, and ships an AI-in-One preset that fills in exactly the right collection settings for this dashboard, so you don’t have to understand the audit internals.
Open Mini-Kitchen and choose the AI-in-One preset. It runs entirely in that browser tab — no tenant data is pulled here, no account info is collected, no secrets are stored.
Work down the builder (name the recipe, data scope, what to collect, date range, rollup, filters, output location, PAX script path, sign-in). Include Agent 365 to also produce that file. Export the result as a .paxlite recipe if you want to reuse it.
Copy the command it built. Download the PAX engine from the PAX repository, open PowerShell 7, and paste the command. This is the step that reaches your tenant — Mini-Kitchen never did.
You’ll get Purview_Audit_..._Interactions.csv, EntraUsers_MAClicensing_..._Users.csv, and (optionally) Agent365_....csv. To keep the dashboard fresh, re-run the command on a cadence (for example a Windows Task Scheduler job).
Already export raw data another way? The standalone processor (scripts/Rollup_Processor_v3.0.0.py --purview ... --entra ...) turns raw Purview + Entra exports into the same two rollup files, no Mini-Kitchen. Agent 365 can also be exported by hand from admin.microsoft.com → Agents → All Agents → Export (it’s a passthrough, no processing needed).
Producing this data reads tenant audit and directory information. Typical roles: Audit Reader (Purview), User Administrator or Global Reader (Entra + licensing), and AI Admin or Global Reader for Agent 365. Your organisation is the data controller for anything you export.
⏱ Quickest to see it working · Power BI Desktop · manual refresh
Produce the rollup files, drop them on your machine, open the auto-detect edition, point three parameters at them.
1 Try it on sample data first
No tenant access yet? The repo ships fictional demo files in the exact rollup format. Open the template, point it at sample-data/, and explore every page with no Purview, PAX, or tenant.
2 Produce your two rollup files
Use Mini-Kitchen with the AI-in-One preset — see Start here above. Pick a local output folder, then run the command it builds in PowerShell 7.
You’ll get Purview_Audit_..._Interactions.csv, EntraUsers_MAClicensing_..._Users.csv, and (optionally) Agent365_....csv.
3 Open the auto-detect edition
Open AIO Dashboard - Rollup Edition (the 3-in-1 edition — it accepts local paths, SharePoint, or OneLake). Fill three parameters, click Load:
Copilot Interactions File
Path to your ..._Interactions.csv
Org Data File
Path to your ..._Users.csv
Agent 365 (optional)
Path to your Agent365_....csv, or leave blank
4 Refresh when you need to
Re-run the Mini-Kitchen command to regenerate the files, then Refresh in Power BI Desktop.
Why this edition can’t auto-refresh in the Service
The 3-in-1 edition resolves each file’s location at runtime (local / SharePoint / OneLake), which the Power BI Service treats as a dynamic data source and won’t schedule. That’s a platform rule, not a bug. Want scheduled refresh? Use the SharePoint or Fabric tab.
Blank visuals almost always mean the file isn’t a rollup file — confirm it matches the ..._Interactions.csv / ..._Users.csv pattern from a -Rollup run.
⏱ An afternoon · Power BI Pro · scheduled refresh, no Gateway
Write the rollup files to a SharePoint library, open the SharePoint edition, publish, and let the Service refresh it on a schedule.
1 Produce the files straight to SharePoint
Use Mini-Kitchen with the AI-in-One preset (see Start here above) and set its output location to a SharePoint document library instead of a local folder. Run the command it builds on a cadence (for example a Windows Task Scheduler job) so the files stay current.
Get the SharePoint URL the right way
Do not copy the URL from your browser’s address bar or a “Copy link” share link — those carry view state and won’t work. Instead: in SharePoint, click the ⋮ next to the folder or file → Details → scroll to Path → click the copy icon. You want a clean URL ending in the folder name (or .../file.csv), with no ?....
2 Open the SharePoint edition
Open AIO Dashboard - Rollup Edition - PBI-SharePoint. Every parameter must be a SharePoint URL (it validates this). Put all three files in the same folder — including a manually-exported Agent 365 CSV — so you don’t mix source types.
3 Publish and set scheduled refresh
Publish to a workspace, then in the Service: dataset → Settings → Data source credentials → sign in to SharePoint with OAuth2, set Privacy = Organizational. Then enable Scheduled refresh. No Gateway needed.
Tip: have the Mini-Kitchen command write the same filename each run so the dataset refreshes against a stable URL with no template edits.
Refresh limits & cross-tenant note
Power BI Pro allows up to 8 scheduled refreshes/day (48 on Premium/PPU); make sure the Mini-Kitchen run finishes writing before the window starts. If the files live in a different tenant than your Power BI Service, sign in with a guest account that can read them — Conditional Access / MFA on the file-hosting tenant can block unattended token renewal.
⏱ An afternoon · needs Fabric capacity (F2+ or trial) · enterprise volume, Direct Lake
The fastest, most reliable path at real audit-log volume. Three notebooks pull from Microsoft Graph and write Delta tables straight into a Lakehouse — no PowerShell, no CSV landing step. The report is a thin pass-through.
Create the Lakehouse with schemas enabled
All three notebooks write with saveAsTable('dbo.<table>') to the notebook’s attached default Lakehouse (there is no workspace / Lakehouse variable to edit — you pin the Lakehouse as default). A Lakehouse created without schema support has no dbo schema, and every notebook then fails with a generic Spark error that names neither the schema nor the table. Tick Lakehouse schemas in the creation dialog.
1 Register an Entra app for Graph
Create an app registration with these Microsoft Graph application permissions (admin consent required), then grab the Tenant ID, Client ID, and client secret value:
Permission
Used by
AuditLogsQuery.Read.All
Audit notebook (Purview audit query API — not the Entra AuditLog.Read.All scope)
Reports.Read.All
Licensed-users notebook
User.Read.All
Org-data notebook
2 Create a Lakehouse
Fabric workspace on a capacity → New → Lakehouse, enable schemas (see the note above). Note its SQL endpoint from settings.
3 Import and configure the three Direct Ingester notebooks
From Classic Editions/3. Fabric/notebooks/, import each, pin your Lakehouse as default, and paste your three app-reg values into the # === CONFIG === cell (use Key Vault via notebookutils.credentials.getSecret for production):
Run them ad-hoc, schedule each, or import the included CopilotAdoptionPipeline to orchestrate all three (audit first, then licensed-users + org-data in parallel).
Local path to your Agent 365 CSV (no Graph loader yet)
Publish to a workspace on the same Fabric capacity so Direct Lake gives sub-second refresh. Set scheduled refresh to match your notebook / pipeline cadence.
Not only Fabric
The same notebooks (plain Python + PySpark) and the Sql.Database-based template also run on Azure Databricks, Synapse Spark, or any SQL endpoint — adjust one OUTPUT_TABLE line per notebook and the two template parameters. See the alternative platforms section.
Cowork Adoption Intelligence
for Microsoft 365 Copilot, one Power BI template for Cowork adoption, delegation maturity, and champion signals
Who is adopting · who keeps coming back · what they delegate · who could be a champion
BUILT BY MICROSOFTPOWER BI TEMPLATEIN TESTING
1 / 10
Auto-playing · use ‹ › to step through each page, or click a dot to jump
Pick how your data gets in. Both paths use one small Python preprocessor that reads your exports once and writes the deterministic files the template loads. The one required source is a Microsoft Purview audit export; a Cowork usage export and optional consumption, organization, or identity files just fill in more pages. New to it, start with the fabricated sample: it needs no tenant role and runs in about ten minutes.
Show real names instead of anonymized identities(only if you want per-person or department views)
Microsoft 365 usage reports conceal user, group, and site names by default, so the Cowork usage export and any per-person or department views come back de-identified. Adoption totals are correct either way, and Reports Reader does not override this.
This is a tenant-wide privacy decision under your own policy, and it affects every admin-center report. Do not grant Global Administrator to the report operator.
⏱ ~10 minutes · Python 3.11+ and Power BI Desktop · no tenant role
See the whole report on fabricated data before you collect anything. Every identity is fictional and ends in @example.com.
Unzip the sample into C:\CoworkAdoptionSample and the bundle into C:\CoworkAdoptionRelease. The sample folder holds four CSVs plus a purview_audit\ subfolder of synthetic audit files.
3 Preprocess the sample
In PowerShell, turn the raw sample into template-ready files (input and output must be different folders):
Open Cowork Adoption Intelligence V4.pbit, set PreprocessedOutputPath to C:\CoworkAdoptionPreprocessed, and click Load.
Confirm it worked
Executive Summary shows 72 users, and Cowork Champions defaults to 8 Top-10% candidates (Top 5% / 10% / 20% show 4 / 8 / 15). No visual shows an error banner.
⏱ An afternoon for first collection · parameter PreprocessedOutputPath · scheduled refresh needs an on-premises gateway
Collect your exports into one protected input folder, run the preprocessor once to a separate output folder, then point the template at that output. Bring only the sources you have; missing optional ones just leave their pages empty.
1 Export the Purview audit (required)
In Microsoft Purview → Audit, search your reporting window in UTC with Activities - operation names set to CopilotInteraction, then Export and keep the raw CSV unchanged.
The export must carry the outer columns RecordId, CreationDate, Operation, UserId, AuditData, and at least one row whose AuditData has CopilotEventData.AppHost containing cowork.
Do not expand or reformat the JSON inside AuditData.
A search covers at most 180 days. For a longer window, drop several non-overlapping exports in the same folder; the preprocessor combines them and drops duplicate RecordId values.
2 Add the optional exports
Each one fills in more of the report. Match is by filename or by exact headers, so keep one current file per source.
A good run reports "status": "valid" and leaves manifest.json plus 13 entity-*.csv files. It never writes to the input folder, and needs no admin role, app registration, or extra Python packages.
Keeping it current and scheduled refresh
When exports change, drop the new files in the input folder, re-run the preprocessor to the same output folder, and Refresh in Power BI. The template reads local entity files, so the Power BI Service needs an on-premises data gateway over the output folder; run the preprocessor on a cadence (for example a Windows Task Scheduler job) before each refresh window.
Prefer the current template. The earlier raw-Purview and SharePoint editions are kept in release/archive/ for rollback only and are not paired with the preprocessor.
Agent Evaluator
for Copilot Studio, one Power BI template for deep agent performance and evaluation
What your agents resolve · what people ask for · what it costs
BUILT BY MICROSOFT BVAPOWER BI TEMPLATE
1 / 9
Auto-playing · use ‹ › to step through each page, or click a dot to jump
One template, three ways to feed it. The first prompt, Source Mode, is the only answer that matters: it decides which of the other parameters apply. Every page works on every path. Start on Local CSV with the bundled sample data to see the whole report in about two minutes.
Turn on Copilot Studio credit exports(only for the Credit Consumption pages)
The Credit Consumption pages read the Power Platform Admin Center per-message credit reports. Every other page works without them, so skip this unless you want the credit view.
A Global Administrator or Billing Administrator, once a month: open the Power Platform Admin Center → Billing → Licensing (Copilot Studio messages) and download the three reports.
There is no API for these reports, so it is a manual monthly download. On the Fabric path you can automate the drop with the ready-made email or SharePoint landing flows.
⏱ ~2 minutes on sample data · Power BI Pro · no tenant, no capacity
The template reads Copilot Studio transcripts from CSV files in one folder. Bundled sample data means it runs out of the box.
1 Open the template
Open Agent Evaluator.pbit in Power BI Desktop. Leave Source Mode on TranscriptCSV.
2 Point it at a folder of CSVs
Set CSV Folder Path to a folder holding the files below. The template finds them by name, so keep the names as shipped.
File
What it feeds
conversationtranscripts.csv
every transcript page
copilot_org_data.csv
the org filter on every page
Point it at the bundled data/ folder to fill the whole report with synthetic sample data first.
3 Load
Click Load. Every page renders.
Publishing to the Service?A SharePoint document library URL in CSV Folder Path refreshes cloud to cloud with no gateway. A local or network folder needs an on-premises data gateway.
Credit Consumption pages (optional): add credit_consumption_tenant.csv, credit_consumption_agent.csv and credit_consumption_user.csv to the same folder, using the column names the ingester writes. Leave them out and those pages just stay empty.
Set Dataverse Url to your environment URL, e.g. https://yourorg.crm.dynamics.com. Find it in the Power Platform Admin Center → Environments → your env → Environment URL. One environment per report.
3 Set the org folder
Set CSV Folder Path to a folder holding copilot_org_data.csv, which drives the org filter. A SharePoint library URL or a local folder both work.
4 Load and sign in
Click Load. On first refresh choose Organizational account and sign in with a login that can read the Conversation Transcript table. The native connector uses that login, so there is no app registration or client secret.
Dataverse keeps about 30 daysReading Dataverse directly, the report only ever sees the last month of transcripts, for one environment. For longer history or several environments in one report, use the Fabric tab.
Credit Consumption pages (optional): as on Local CSV, add the three credit_consumption_*.csv files to the CSV folder.
⏱ An afternoon · Fabric capacity (F2+ or trial) + Lakehouse · scheduled
Notebooks land your data as Delta tables in a Lakehouse and the template reads them over the SQL endpoint. This is the path for large volumes, history beyond 30 days, several environments at once, and the turnkey Credit Consumption pages.
Attach your Lakehouse before running a notebookFor each notebook: Explorer pane → add your Lakehouse → set it as the default (the star). That is what points the notebook at your data.
1 Create a Lakehouse
Fabric portal → your workspace → New → Lakehouse. Note its SQL analytics endpoint (Lakehouse → Settings).
Pulls live from one or many environments (DATAVERSE_URL or DATAVERSE_URLS). Needs an Entra app added as an Application User in each environment, with TENANT_ID, CLIENT_ID and a CLIENT_SECRET read from Key Vault. Each run accumulates history past the 30-day window.
SOURCE_MODE = 'files'
Reads a conversationtranscripts.csv you drop in Files/copilot_transcripts. Nothing else to set.
Land copilot_org_data for department breakdowns. The join uses the AAD object ID, so the export must include the id column, which a Graph /users call returns. Without it, org breakdowns come back blank.
5 Connect and schedule
Open Agent Evaluator.pbit, set Source Mode to Fabric, then Fabric SQL Endpoint and Lakehouse Name. Load, Publish, then schedule the notebooks to run before the dataset refresh.
No consumption switch to setThe Credit Consumption pages fill in on their own once the credit tables hold data, and stay empty when they do not. There is no parameter to toggle.
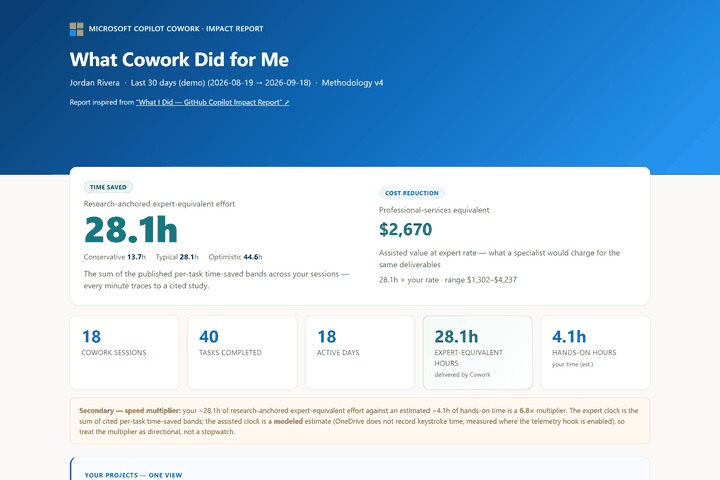
two Copilot Cowork skills that turn your team's Cowork activity into one anonymized ROI report
hours saved · the value of that time · the work Cowork helped with · emailed to your team on a schedule
BUILT BY MICROSOFTCOPILOT COWORK SKILLSNO ADMIN RIGHTS
1 / 3
Auto-playing · use ‹ › to step through each page, or click a dot to jump
Nothing to export, and no tenant data leaves anyone's machine. You install two Copilot Cowork skills wired to one shared Teams channel: every teammate runs the member skill, which emails a de-identified summary of their Cowork activity to the channel, and you run the manager skill, which reads the channel and emails the team one anonymized dashboard. You get both skills from the Installer Studio, which personalizes each download for your channel.
Create the Teams channel first(one time, needed before you install)
Both skills point at one dedicated, email-enabled Teams channel. Create it before you build or install anything, and keep it just for these reports so the totals stay clean.
In Microsoft Teams, add a new channel named for example Cowork report - your team, and add only the people whose work should count.
Open the channel's ··· More options menu, choose Get email address, then open Advanced settings and allow the members who will send reports to email the channel.
Keep both the channel link (··· → Get link to channel) and its email address handy. The member skill delivers to the email address, the manager skill reads from the link.
⏱ ~10 minutes · no admin rights · runs in your browser
You get both skills from the Installer Studio. It bakes your channel into both downloads, so no one is ever asked to paste a link. It runs entirely in your browser, and your channel link and email are never uploaded.
Click Build my install links. The page shows the channel name it found. Check it is the right one, then download both zips: the manager skill and the member skill.
3 Install the manager skill (that's you)
Open Copilot Cowork, upload the manager .zip as-is (do not unzip it), and say "Install this manager skill and walk me through setup." Those last words matter. Installing on its own runs nothing, and setup is what sends the member skill to your team.
4 Roll the member skill out to the team
Send everyone the member .zip. Each person uploads it in Cowork, installs it, and runs it once. After a required privacy review, their de-identified summary is emailed to the channel, and from then on it posts on its own 15-day cadence.
5 Schedule the rollup
Ask the manager skill to build the team report, then let it run on a schedule, a day or two after the member cadence so every post is in before it aggregates and emails the newsletter.
See it first: open the live sample dashboard (invented data) to see the finished report before you roll it out.
Super User Adoption
Power BI on Viva Insights person-query data, to see how Copilot super users emerge and scale their patterns
Who your super users are · how they built the habit · what they use Copilot for · where they cluster
BUILT BY MICROSOFTPOWER BI TEMPLATE
1 / 11
Auto-playing · use ‹ › to step through each page, or click a dot to jump
Both templates read the same thing: a Viva Insights person query, one row per person per week. Set the query up once below, then pick how the report reads it. Every path ends the same way: open the .pbit, fill one or two parameters, click Load.
Set up the Viva Insights person query(do this first, both paths need it)
An Insights Analyst (the role is assigned in Viva Insights admin) builds this in the Analyst Workbench. The first run can take a few hours, so start it early.
Set Time period to the last 6 months, Group by to Week (not Month, month grouping breaks the trend calculations), and turn Auto-refresh On.
Under employees to include add Is Active = True, and under employee attributes add Organization, FunctionType, TimeZone and SupervisorIndicator.
Under Metrics add every group in the table below. Choose All metrics unless a narrower selection is listed. Missing even one group leaves visuals blank in Power BI with no error to tell you why:
Metric group
Select
Microsoft 365 Copilot
All metrics
Collaboration activity
All metrics
Collaboration network
Diverse ties, External network size, Internal network size, Strong ties
Collaboration by day of the week
All metrics
Working hours collaboration
All metrics
After hours collaboration
All metrics
Meeting types
All metrics
External collaboration
External collaboration hours
Focus metrics
All metrics
Click Run, then wait until Status = Completed under Analysis results. Do not export while it is still processing.
Built this query before v13? Re-open it, open the Microsoft 365 Copilot metric selection and re-check Select all, so the newly consolidated Copilot Chat metrics are included.
⏱ ~15 minutes · Power BI Desktop · snapshot, refresh by hand
Download the query result once and point the template at the file. Simplest path; the report holds a snapshot until you re-download.
1 Download the result as CSV
In Analysis results, find your completed query and click the page icon in the Actions column to download the CSV.
2 Open the template
Open Template - Super User Adoption CSV -v13.pbit, set SourceType to CSV, paste the full path of the downloaded file into the CSV box, leave the Direct Query boxes empty, click Load.
To refresh: re-run the query, export a fresh CSV, and re-point the template at the new file.
⏱ ~10 minutes · refreshes weekly · keep Auto-refresh On
Connect the template straight to the live query. No download, and the report follows each weekly Viva Insights refresh.
1 Copy the two identifiers
In Analysis results, click the link icon in the Actions column for your completed query. It gives you a Partition ID and a Query ID.
2 Open the template
Open Template - Super User Adoption Direct Query -v13.pbit, set SourceType to DirectQuery, paste the two values into PartitionID and QueryID, leave the CSV box empty, click Load. Sign in with your Organizational account when prompted.
3 Publish and schedule
Publish to a Power BI workspace, then set a scheduled refresh on the semantic model so it keeps pace with Viva's weekly update.
Keep Auto-refresh On in Viva
This path reads the live query, so if you switch the query's Auto-refresh off in Viva later, the Direct Query connection stops updating.
Super User Impact
Power BI on Viva Insights person-query data, to measure the work-pattern impact of your Copilot super users
Collaboration hours · meeting load · focus time · estimated time saved · super users vs peers
BUILT BY MICROSOFTPOWER BI TEMPLATE
1 / 7
Auto-playing · use ‹ › to step through each page, or click a dot to jump
Both templates read a Viva Insights person query, one row per person per week, the same query the Super User Adoption report uses. If you already ran it there, reuse the completed query and skip to the tabs. Otherwise set it up once below, then pick how the report reads it. Every path ends the same way: open the .pbit, fill one or two parameters, click Load.
Set up the Viva Insights person query(do this first, both paths need it)
An Insights Analyst (the role is assigned in Viva Insights admin) builds this in the Analyst Workbench. The first run can take a few hours, so start it early. One export feeds both this report and Super User Adoption.
Set Time period to the last 6 months, Group by to Week (not Month, month grouping breaks the trend calculations), and turn Auto-refresh On.
Under employees to include add Is Active = True, and under employee attributes add Organization, FunctionType, TimeZone and SupervisorIndicator.
Under Metrics add every group in the table below. Choose All metrics unless a narrower selection is listed. Missing even one group leaves visuals blank in Power BI with no error to tell you why:
Metric group
Select
Microsoft 365 Copilot
All metrics
Collaboration activity
All metrics
Collaboration network
Diverse ties, External network size, Internal network size, Strong ties
Collaboration by day of the week
All metrics
Working hours collaboration
All metrics
After hours collaboration
All metrics
Meeting types
All metrics
External collaboration
External collaboration hours
Focus metrics
All metrics
Click Run, then wait until Status = Completed under Analysis results. Do not export while it is still processing.
Built this query before v13? Re-open it, open the Microsoft 365 Copilot metric selection and re-check Select all, so the newly consolidated Copilot Chat metrics are included.
⏱ ~15 minutes · Power BI Desktop · snapshot, refresh by hand
Download the query result once and point the template at the file. Simplest path; the report holds a snapshot until you re-download.
1 Download the result as CSV
In Analysis results, find your completed query and click the page icon in the Actions column to download the CSV.
2 Open the template
Open Template - Super User Impact CSV -v13.pbit, set SourceType to CSV, paste the full path of the downloaded file into the CSV box, leave the Direct Query boxes empty, click Load.
To refresh: re-run the query, export a fresh CSV, and re-point the template at the new file.
⏱ ~10 minutes · refreshes weekly · keep Auto-refresh On
Connect the template straight to the live query. No download, and the report follows each weekly Viva Insights refresh.
1 Copy the two identifiers
In Analysis results, click the link icon in the Actions column for your completed query. It gives you a Partition ID and a Query ID.
2 Open the template
Open Template - Super User Impact Direct Query -v13.pbit, set SourceType to DirectQuery, paste the two values into PartitionID and QueryID, leave the CSV box empty, click Load. Sign in with your Organizational account when prompted.
3 Publish and schedule
Publish to a Power BI workspace, then set a scheduled refresh on the semantic model so it keeps pace with Viva's weekly update.
Keep Auto-refresh On in Viva
This path reads the live query, so if you switch the query's Auto-refresh off in Viva later, the Direct Query connection stops updating.
M365 Copilot Readiness Report
User-level Microsoft 365 adoption and Copilot readiness, powered by Purview audit logs
Who is ready for Copilot · who to license next · where adoption is strong · where the gaps are
BUILT BY MICROSOFTPOWER BI TEMPLATE
1 / 10
Auto-playing · use ‹ › to step through each page, or click a dot to jump
Pick how your data gets in. Every path ends the same way: open the .pbit, point its five parameters at the CSVs you produced, click Apply, then Refresh. Start with a one-month window on your first run.
Turn on unified audit logging(do this first, or every export comes back empty)
The whole report is built from the Microsoft 365 unified audit log. With logging off, every Purview search and every PAX run returns zero rows and nothing tells you why. It does not backfill, so a tenant that just switched it on starts thin.
Open Purview audit search. If you see the banner Start recording user and admin activity, click it.
Allow a short while for logging to begin, then run your export over a date range that starts after logging was on.
Audit permission change (April 2026): Microsoft now enforces AuditLogsQuery.Read.All for the Graph audit query API. With only the legacy AuditLog.Read.All, Copilot audit calls appear to succeed and silently return zero records. PAX v1.10.9 and later request the correct scopes, so grant admin consent for the new permission.
⏱ ~15 minutes · PowerShell 7 · one command
One command pulls your audit data, rolls it up into the shape Power BI needs, and exports your Entra users at the same time. This is the recommended path, and it skips the processing step entirely.
1 Build the command
Easiest: open Mini-Kitchen, choose the M365 Usage Dashboard preset, work down the builder, and copy the command it writes. Mini-Kitchen runs entirely in that browser tab, so it pulls no tenant data and stores no secrets.
Download the PAX script from the PAX repository (Mini-Kitchen's own Download PAX script button takes you to the same place), open PowerShell 7, paste the command, and sign in. This is the step that reaches your tenant. It produces five import-ready CSVs:
File
Contents
Rollup
Per-user, per-app, per-day event counts
UserStats
One row per user with tiers and engagement segments
SessionCohort
One row per (user, app) with a session-count bucket
⏱ An afternoon · Purview + Python · no PowerShell script
No PAX? Export from Purview by hand, then flatten the exports with the Python processor that ships in the repo.
1 Run four Purview searches
In Purview audit search, run four searches over the same date range, leaving Users blank. Export each with Download all results and save under the filename shown. Keep each pull under the 50K / 100K row cap; split a pull into weekly chunks if it hits the cap.
CopilotInteraction, ConnectedAIAppInteraction(paste into Record types, not Activities)
pull4_copilot.csv
Extend the Teams pull by +1 day: Purview batches meeting events up to 24 hours after a meeting ends.
2 Export your Entra users
In the Microsoft Entra admin center go to Identity → Users → All users → Download users, including userPrincipalName, displayName, department, jobTitle, and assignedLicenses.
To split licensed from unlicensed users, add a hasLicense column
The plain Entra download has no hasLicense flag, so the Enablement Strategy quadrant and license ranking cannot tell licensed users apart. The repo's PowerShell export snippet auto-detects every Copilot SKU in your tenant and adds the column. PAX (tab 1) adds it for you.
3 Flatten the exports
The raw Purview CSVs carry a nested AuditData JSON column Power BI cannot read. Run the processor to turn the four pulls into the four import-ready CSVs:
Have a single raw PAX CSV instead of four pulls? Use --pax "Purview_Export.csv".
Keep the default outputs
Do not pass --skip-precompute or --no-session-stats: Department Readiness needs UserStats and SessionStats, and Adoption Momentum needs SessionStats plus at least 60 days of history for its current-versus-previous 30-day comparison.
4 Open the template
Open the .pbit and set the same five parameters as tab 1: the four processor outputs (Rollup, UserStats, SessionCohort, SessionStats) plus your Entra CSV. Apply, Refresh, Save as .pbix.
⏱ ~2 minutes · no tenant · preview only
Want to see the finished report before you touch your tenant? Open the synthetic demo.
1 Open the demo file
Download M365 Dashboard - DEMO PBIX.pbix and open it in Power BI Desktop. It ships with cached synthetic @example.com users, so every one of the ten pages fills in with no parameters and no exports.
This file is for preview and testing only. When you are ready for your own tenant, use tab 1 or tab 2, both of which drive the .pbit template.
RLS-ready Power BI report for Cowork credit consumption, chargeback, optimization and billing
Who is consuming credits · what each department owes · who is over limit · what next quarter looks like
BUILT BY MICROSOFTPOWER BI TEMPLATECSV OR VIVA DIRECT QUERY
1 / 6
Auto-playing · use ‹ › to step through each page, or click a dot to jump
This report runs two ways: from two CSV exports joined on user principal name (your Copilot credit consumption and a Microsoft Entra org directory), or live from Viva Insights through the self-refreshing Direct Query variant. Wire up your own data on either path, or explore the shipped demo dataset first.
⏱ ~45 minutes · Power BI Desktop · two admin exports
Produce the two CSV exports, point the template at them, refresh.
1 Export 1 — Copilot credit consumption
Microsoft 365 admin center → Copilot → Cost management → Consumption tab → Export CSV. One row per user with the monthly credit limit, credits used, session count, % used and last activity date.
2 Export 2 — Microsoft Entra org directory
Microsoft Entra admin center → Identity → Users → All users → Download users (or Microsoft Graph GET /users). Supplies department, jobTitle, city, country and manager — the org context the credit export doesn’t carry.
Exact fields required(don’t rename columns — a missing one produces blank visuals with no error)
Export 1 (credit consumption):Display Name, User Principal Name (join key), Monthly credit limit, Monthly credits used, User ID, Microsoft 365 Copilot license, Last activity date, Session Count, % Used.
jobFamily, costCenter and businessUnit are not standard Entra fields — an admin maps them in (for example from an HR feed), or those slicers stay blank. Every user in the credit export needs a matching directory row, or their credits aren’t attributed to a department.
3 Open the template
Open Cowork Chargeback.pbit, set CreditCsvPath to the credit CSV and EntraCsvPath to the directory CSV, click Load.
4 Refresh and verify
Click Refresh and confirm the Consumption visuals populate (total credits used, allowance, utilization %, top user) and all six pages render.
5 Add your own cut (optional — slice by a custom attribute)
Need to group by something the standard fields don’t cover (say CustomDivision)? Add it as an extra column in your Entra directory CSV (Export 2), keyed by userPrincipalName — the template passes any extra directory column straight through. Click Refresh and the column shows up on the Org table in the Data pane. Then select the Slice By table and, in the formula bar, add one line before the closing }:
Label shown in the dropdown · the real column · the next sort number. It appears instantly as a new checkbox in the Slice By slicer on every page.
Refresh is manual on the CSV path
Re-export the two CSVs on your cadence (for example monthly), overwrite the files at the same paths, and refresh the report. Want automated, scheduled refresh instead? Use the Viva Direct (live) path in tab 2, which connects straight to Viva Insights and self-refreshes in the Power BI Service.
⏱ ~10 minutes · Power BI Desktop · Viva Insights analyst · self-refreshing
Connect Power BI straight to Viva Insights. No CSV exports, and once published it refreshes on a schedule, so monitoring is hands-off.
1 Build a Consumption query in Viva
In the Viva Insights Advanced Insights portal, an analyst builds and saves a custom Consumption query, ticking Select spending policy and employee attributes so policy, limits and org context travel on the rows. Note the query’s Partition and Query identifiers.
The Partition: GUID shown in the Advanced Insights portal
VivaQueryId
The identifier of your saved Consumption query
Optional: BillingPeriodWeeks (default 4) sets how many trailing weeks roll into the current billing window.
4 Sign in and refresh
Sign in to the Viva Insights connector with your organizational account, click Load, then Refresh. Every page populates from live tenant data.
5 Publish for automation
Publish to the Power BI Service and set a scheduled refresh on the dataset. The report then keeps itself current with no manual step.
6 Add your own cut (optional — slice by a custom attribute)
To group by a custom employee attribute (say CustomDivision), include it in your Viva Consumption query’s employee attributes so it rides along on the people rows. Click Refresh and the template carries custom people columns through to the Org table, so your attribute appears in the Data pane. Then select the Slice By table and, in the formula bar, add one line before the closing }:
Label shown in the dropdown · the real column · the next sort number. It appears instantly as a new checkbox in the Slice By slicer on every page.
Re-saving the query rotates its id
If you re-save the Consumption query in the portal it gets a new Query identifier. Update the VivaQueryId parameter so refresh keeps resolving.
When prompted, set the parameters to the two files in the demo data folder, then click Load:
CreditCsvPath
Path to cowork_billing_synthetic.csv
EntraCsvPath
Path to entra_org.csv
3 Explore
All six pages render on synthetic data: Consumption, Chargeback (PayGo), Prepaid Allocation, Optimization, Forecast, and Glossary.
Row-Level Security(optional — show each department lead only their own data)
The report ships two roles: All Org (Admin) (unrestricted, for finance and program leads) and Department Admin (only the viewer’s own department, via a USERPRINCIPALNAME() filter). Set it up in two places:
Power BI Desktop — define the roles (Modeling → Manage roles).
Power BI Service / Fabric — assign members to each role after publishing.
Auto-playing · use ‹ › to step through each page, or click a dot to jump
This web app reads two CSV exports in your browser: a Microsoft Entra user export and a Copilot credit consumption export. Nothing is uploaded. Drop the files in, reconcile to your invoice total, then export the journal or line items.
⏱ ~10 minutes · browser only · two admin exports
Export the two CSVs, open the app, then drop both files into the upload area.
1 Export Microsoft Entra users
Microsoft Entra admin center (entra.microsoft.com) → Identity → Users → All users → Download users (CSV; supplies department, job title, cost centre, business unit; you can load more than one).
2 Export Copilot credit consumption
Microsoft 365 admin center (admin.microsoft.com) → Copilot → Cost management → Consumption tab → Export CSV (one row per user with credits consumed).
How the app matches rowscolumn names are auto-detected
The join key is user principal name. The Entra file supplies department, job title, cost centre and business unit. The credit export supplies one row per user with credits consumed.
You can load more than one Entra CSV if your tenant exports users in batches. Files are parsed locally in the page.
3 Open the app and load both files
Open Cowork Chargeback, then drop the Entra export and the Copilot credit export into the app. It joins the files on user principal name and produces the chargeback.
4 Reconcile the journal
Enter your Microsoft invoice total so the app can reconcile billed cost against the file-level chargeback calculation.
5 Export outputs
Export the journal or the line items as CSV for finance review or downstream allocation.
⏱ ~1 minute · browser only · no tenant
Run the entire chargeback on synthetic data before you use tenant exports.
The demo uses synthetic users and credits. Nothing is uploaded.
Cowork Policy Helper (Web App)
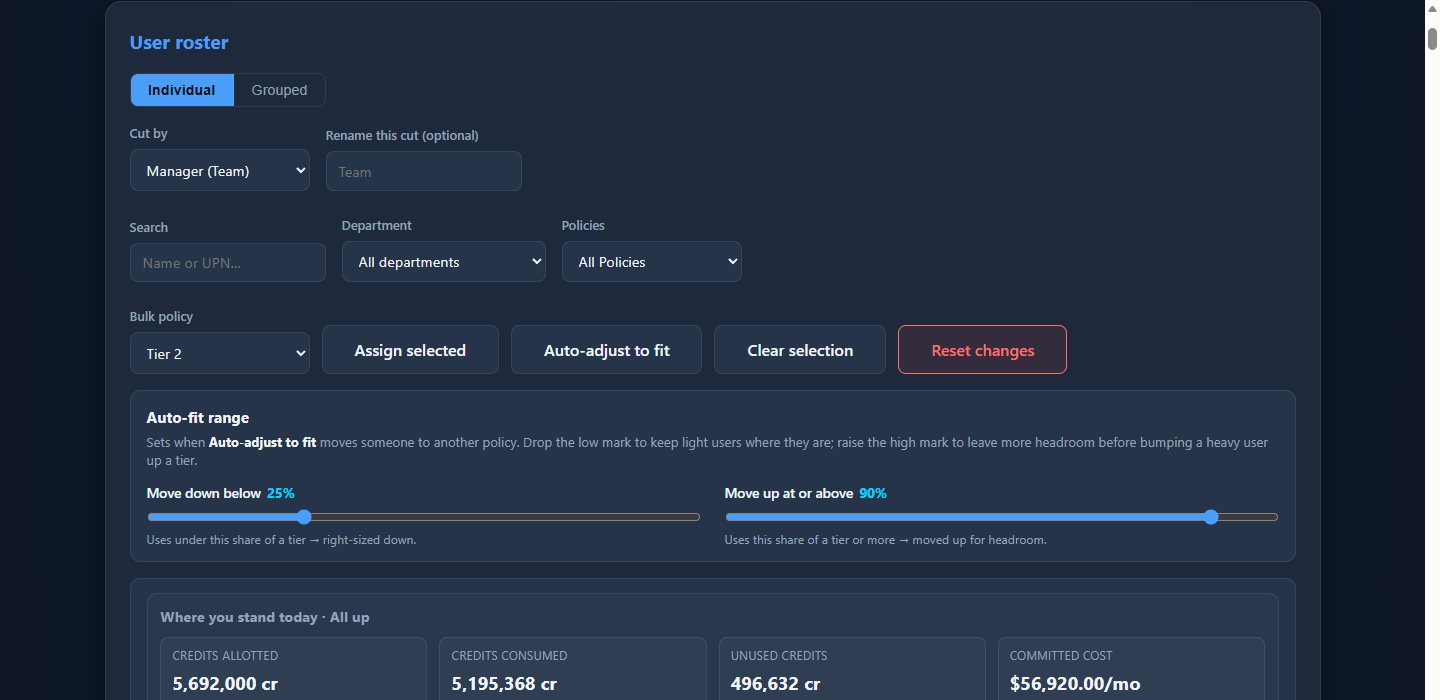
One click Auto-adjust to fit right-sizes every employee to the correct spend policy from thresholds you set
Set a low and high utilization mark, auto-move everyone at once, then export assignments by policy, by department cut, or as a group-import CSV
AUTO-ADJUST TO FITGROUP + DEPARTMENT EXPORTSRUNS IN YOUR BROWSER
1 / 4
Auto-playing · use ‹ › to step through each page, or click a dot to jump
This web app reads two CSV exports in your browser: a Microsoft Entra user export and a Copilot credit consumption export. Nothing is uploaded. It joins the files on user principal name, assigns usage cohorts and lets you tune spend-tier policies before exporting assignments.
⏱ ~10 minutes · browser only · two admin exports
Export the two CSVs, open the app, then drop both files into the upload area.
1 Export Microsoft Entra users
Microsoft Entra admin center (entra.microsoft.com) → Identity → Users → All users → Download users (CSV; supplies department, job title, cost centre, business unit; you can load more than one).
2 Export Copilot credit consumption
Microsoft 365 admin center (admin.microsoft.com) → Copilot → Cost management → Consumption tab → Export CSV (one row per user with credits consumed).
How recommendations are builtfiles stay local
The two files are joined on user principal name. Each user is placed in a usage cohort by percentile of credits used, then given a recommended spend-tier policy.
The Entra file supplies department, job title, cost centre and business unit so you can review policies by organization context.
3 Open the app and load both files
Open Cowork Policy Helper, then drop in the Entra export and the Copilot credit export.
4 Tune the policy tiers
Adjust each policy's monthly credit allowance live and review how the recommendations change.
5 Override and export
Override individual users where needed, then export the assignments as CSV.
⏱ ~1 minute · browser only · no tenant
Explore the policy workflow on synthetic data before you use tenant exports.
Files are parsed locally and demo assignments are held in memory only.
GitHub Copilot Impact
Power BI template that combines GitHub Enterprise Copilot exports with Entra department data
Adoption by org · engagement · impact · languages · models · IDEs · benchmarking · retention
BUILT BY MICROSOFTPOWER BI TEMPLATEGITHUB + ENTRA EXPORTS
1 / 9
Auto-playing · use ‹ › to step through each page, or click a dot to jump
This report reads three admin exports: one GitHub Copilot Usage Insights JSON, one GitHub Enterprise Members CSV, and one Entra users CSV. Point the Power BI template at local files, or use the sample files first.
⏱ ~30 minutes once exports are ready · Power BI Desktop · 2 CSVs + 1 JSON
Produce the three exports, open the template, and paste each full local file path when prompted.
1 Export GitHub Copilot Usage Insights (JSON)
Sign in as a GitHub Enterprise Owner, go to github.com/settings/enterprises, pick your enterprise, then use the top-right (...) menu → Insights → Copilot Usage → select Last 28 days → Download. Save the .json file locally.
2 Export GitHub Enterprise Members (CSV)
In the same enterprise, go to People → Members → right side CSV Report. Fewer than 1000 members downloads immediately. For 1000 or more members, GitHub emails a download link.
3 Export Entra users (CSV)
In Microsoft Entra admin center, sign in as User Administrator or Global Reader, then Identity → Users → All users → Download users. Include at least UserPrincipalName and Department.
4 Open the template
Open Template GitHub Copilot Usage Analytics v2-14.pbit in Power BI Desktop. When prompted, paste the full local path to the GitHub Usage JSON, the GitHub Members CSV, and the Entra users CSV, then click Load.
5 Refresh manually
To refresh later, re-export the files, keep the same paths or update the parameters, and reload the template.
Important data notesfile types, policy, and sign-in
The inputs are 2 CSVs + 1 JSON, not 3 CSVs. There is no API token or PAT anywhere in this setup, access is through interactive admin sign-in.
The GitHub export is empty unless the enterprise Copilot usage metrics policy is opted in under AI Controls. Department segmentation is blank unless SAML SSO is enforced between GitHub and Entra.
All pages render on synthetic data for the enterprise nicknamed Byte-Sized-Donuts.
GitHub Copilot Panel
Power BI template for Viva Insights GitHub Copilot telemetry, with CSV and Viva connector paths
Start here · executive view · reach · depth · value · models · appendix
BUILT BY MICROSOFTPOWER BI TEMPLATEVIVA INSIGHTS
1 / 7
Auto-playing · use ‹ › to step through each page, or click a dot to jump
This Power BI template reads the Viva Insights GitHub Copilot Export query output. Use the reliable CSV route first, or switch the single DataSource parameter to Viva when using the connector route.
⏱ ~30 minutes · Power BI Desktop · Viva Insights Analyst
Run the Viva Insights GitHub Copilot Export, then choose CSV files or the Viva connector by setting DataSource.
1 Run the GitHub Copilot Export query
In Viva Insights, go to Analysis → Analyst Workbench, run a GitHub Copilot Export query, then open Analysis results. This requires the Insights Analyst role. GitHub Copilot data in Viva Insights is in preview.
2 CSV route, recommended
From Analysis results, download the CSVs, put them flat in one folder, open GitHub Copilot Panel.pbit, leave DataSource=CSV, set DataFolder to that folder, and click Load.
CSV files expectedkeep them flat in the folder
PersonGitHubActivityMetrics.csv, GitHubActivityBreakdownByFeatureMetrics.csv, GitHubActivityBreakdownByModelFeatureMetrics.csv, GitHubActivityBreakdownByLanguageFeatureMetrics.csv, GitHubActivityBreakdownByLanguageModelMetrics.csv, and PeopleMetaData.csv.
3 Viva connector route
In Analysis results, click the query link icon, then Copy identifiers and connect to Power BI to get the Partition ID and Query ID. Set DataSource=Viva, then set PartitionId and QueryId. In connector settings use Schema=Pivoted, Granularity=Row-level, and Connectivity=Import.
4 Confirm parameters
DataSource
CSV or Viva
DataFolder
Folder that contains the six CSV files for the CSV route
PartitionId
Viva connector route only
QueryId
Viva connector route only
Connector caveatwhy CSV is reliable today
The shipped template connector TableName options currently carry the CSV names, so the CSV route is the reliable one today.
The sample data route is the preloaded Route 1 path, no tenant connection required.
1 Copy the sample CSVs
Download the CSVs from the sample-data folder. The sample contains 200 people, 16 orgs, and 26 weeks. Copy the files flat into the default folder C:\GitHub Copilot Panel\Data.
2 Open the template
Open GitHub Copilot Panel.pbit, leave DataSource=CSV, and click Load. No parameter change is needed when the files are in the default folder.
3 Switch later to real data
When you later point at real export data, set config is_synthetic=0.
What I Did: Copilot Impact Report
Local Python report over your GitHub Copilot CLI and VS Code Copilot Chat history
Auto-playing · use ‹ › to step through each page, or click a dot to jump
This tool reads your existing local GitHub Copilot session logs on your own machine, including GitHub Copilot CLI session-state events and VS Code Copilot Chat sessions. Nothing is uploaded. It requires Python 3.10+, the GitHub CLI (gh) signed in for AI analysis, and real Copilot usage history. A machine with no Copilot history produces an empty report.
⏱ ~5 minutes · GitHub Copilot CLI · local logs
Install the plugin inside Copilot CLI, then run the report against your own recent sessions.
1 Install the plugin
In a Copilot CLI session run /plugin install whatidid@awesome-copilot.
2 Run it
Run whatidid. The default lookback is 7 days. You can also pick it via /agent.
3 Open the HTML report
The tool writes a self-contained HTML report for the selected period. If there is no local Copilot history, the report is empty rather than populated with sample data.
What this connects tolocal GitHub Copilot history only
It reads GitHub Copilot CLI logs under ~/.copilot/session-state/<uuid>/events.jsonl and VS Code Copilot Chat session history on the same machine. It is for GitHub Copilot, not Microsoft 365 Copilot.
Install the same agent plugin from VS Code, then ask Copilot Chat for a report.
1 Open Chat plugins
Open the Command Palette, choose Chat: Plugins (@agentPlugins), search whatidid, then click Install.
2 Ask for the report
In Copilot Chat ask, for example, give me a 7-day Copilot report.
3 Review the output
The plugin uses the Copilot history on your machine. There is also a separate first-party VS Code extension named What I Did with a Report Builder panel.
Before you run ithistory and sign-in requirements
You need real GitHub Copilot activity on the machine and gh signed in when AI analysis is requested. The tool does not ship demo or sample data.
⏱ ~10 minutes · Python 3.10+ · developer path
Clone the repo and run the Python CLI directly when you want to inspect or modify the tool.
Copilot Cowork skill that summarizes your OneDrive Cowork sessions into an impact report
Sessions classified · time saved · value pillars · professional-services equivalent · email automation
BUILT BY MICROSOFTCOPILOT COWORK SKILLONEDRIVE VIA GRAPH
1 / 7
Auto-playing · use ‹ › to step through each page, or click a dot to jump
This skill reads your own Copilot Cowork session history under OneDrive Documents/Cowork/ through Microsoft Graph, using the Cowork app allow-list. It is not reading local disk files. You need Copilot Cowork access and existing Cowork session history; synthetic demo artifacts are available only for preview.
⏱ ~5 minutes · Copilot Cowork · recommended
Install the skill zip in Cowork and let the agent read your allowed OneDrive Cowork session folders.
The repo ships synthetic inputs at skill/examples/demo_sessions.json behind the prebuilt demo report.
Demo limitspreview only
The demo does not connect to OneDrive or read Cowork session folders. For your own impact report, use the Cowork skill path.
Adoption & Sentiment Report
Power BI template that joins M365 Admin Copilot usage with optional survey and Entra CSVs
Usage cohorts · sentiment survey · comment themes · saved time · assisted value · feature popularity
POWER BI TEMPLATELOCAL CSV PARAMETERSNO DEMO DATA
1 / 6
Auto-playing · use ‹ › to step through each page, or click a dot to jump
This template has one real connection mechanism: three Power Query parameters that point at local CSV files. The M365 Admin Copilot usage export is required. Survey responses and Entra users are optional. No demo data ships with the repo.
⏱ ~30 minutes · Power BI Desktop · one required CSV, two optional CSVs
Export the files, open the .pbit, set the parameters to local paths, and load.
1 Export the M365 Copilot usage CSV
Go to admin.microsoft.com → Reports → Usage → Microsoft 365 Copilot → select the 180-day period → Export in the top right. The file name looks like CopilotActivityUserDetail_YYYY-MM-DD.csv.
If user names are hashed
In the M365 admin center, go to Settings → Org settings → Reports, uncheck Display concealed user, group, and site names in all reports, wait 48 hours, then re-export.
2 Optional: build the sentiment survey
The repo does not ship a downloadable survey file, and its survey link is broken. Recreate the 12 recommended questions in Microsoft Forms or another survey tool from the README table. Capture an Email or UPN field by turning on Forms Record name or by adding a required email question, then export responses as CSV.
Recommended survey question labels
Overall satisfaction, Helps me work faster, Improves work quality, Improves productivity, Benefits my role, Copilot readiness, Agents usage (all 1-5); Time saved using Copilot (buckets); Time repurposed; Use cases; Barriers to adoption; What else? (free text).
3 Optional: export Entra users
Go to entra.microsoft.com → Identity → Users → All users → Download users. This supplies organization, department, and display names.
4 Open the template and set parameters
Open M365 Copilot - Adoption & Sentiment.pbit in Power BI Desktop, Feb 2025 or later. Set Copilot Activity (MAC) to the required usage CSV full path with no quotes, Raw Survey Data to the survey CSV path or / to skip, and User Details (Entra) to the Entra CSV path or / to skip. Click Load.
Re-export monthly and append to build month-over-month trends.
Comments page note
The Comments page uses a Smart Narrative visual. It needs Power BI Pro or PPU with Copilot in Power BI enabled, otherwise that one visual is blank.
Personal Copilot, Agent & Cowork Dashboard
Power BI dashboard for personal Copilot usage, agent activity, Cowork credits and org benchmarks
BUILT BY MICROSOFTPOWER BI TEMPLATEREFRESHES WEEKLY
1 / 6
Auto-playing · use ‹ › to step through each page, or click a dot to jump
This dashboard has three genuine setup paths. Start with the Copilot Dashboard export if you only need your own view, or use Viva Insights person-query paths when you need analyst-controlled CSV or Direct Query inputs. No demo data ships with the repo, and report data refreshes weekly.
Prerequisites
You need an M365 Copilot license and Power BI Desktop. The Viva person-query paths also require Viva Insights Analyst Workbench access.
⏱ ~15 minutes · self-service · recommended
Use exports from the Copilot Dashboard in Viva Insights. Load any combination of Copilot, Agent, and Cowork data.
1 Export your Copilot data
Open the Copilot Dashboard via Viva Insights, then click Export data. This downloads your Copilot usage CSV.
2 Optional: export Agent and Cowork folders
For Agent data, export the folder containing AgentMetadata.csv, PersonAgentResponsesMetrics.csv, PersonAgentCreditsRetentionMetrics.csv, and PeopleMetadata.csv. For Cowork data, export the folder containing PersonServiceCreditsMetrics.csv, PeopleMetaData.csv, and SpendingPolicyMetadata.csv.
Set Time period to Last 6 months (rolling), Group by to Week, filter Is Active = True, add attributes Organization, FunctionType, and TimeZone, and under Microsoft 365 Copilot select All metrics. Missing even one metric can leave visuals blank.
3 Run and export
Save and run the query, wait for Completed, then export the CSV.
4 Open the CSV template
Open Viva Insights Personal Dashboard V9 (CSV Import pbit).pbit from the repository and enter the CSV path.
Use the same person-query build, then connect the template to the completed query IDs.
1 Build and run the person query
Use the same setup as the CSV path: Last 6 months rolling, group by Week, Is Active = True, attributes Organization, FunctionType, TimeZone, and all Microsoft 365 Copilot metrics.
2 Copy the IDs
From the completed query, copy the Partition ID and Query ID.
3 Open the Direct Query template
Open Viva Insights Personal Dashboard V9 (Direct Import pbit).pbit and enter the Partition ID and Query ID.
CustomizeCopilot Add-on Library
Library of Power BI add-on pages that graft onto existing Super User Adoption or Impact reports
The Champion-ID add-on, running on sample data · use ‹ › to step through its two pages
CustomizeCopilot is a library of ready-made add-on pages that graft onto an existing Super User Adoption or Super User Impact report, version 4 or later. The data lives in that host report, fed by Viva Insights, and the add-on inherits it. Today the library has one live add-on: Champion-ID.
⏱ ~15 minutes · Power BI Desktop · existing host report
Copy the add-on pages into a host report that is already connected to your Viva Insights data.
1 Open your host report
Open your Super User Adoption or Super User Impact report, version 4 or later, in Power BI Desktop. It should already be connected to your data.
Open Champion ID.pbix on its own. It ships with sample data and renders both pages populated, so you can inspect the add-on before grafting it into your host report.
Network metrics requirement Strong ties, Diverse ties, and Internal network size require Viva Insights network analysis enabled in the host report.
Advanced: .pbip projects
For source-controlled .pbip reports, copy the page GUID folder under definition/pages/ and register the GUID in pages.jsonpageOrder, adding any missing measures to the model.
FinOps & FOCUS Cost Report (Web App)
Browser-only FinOps cost view for Cowork consumption with FOCUS-aligned columns
List, Contracted, Effective and Billed cost · live rate tuning · department, cost centre and business unit allocation
BUILT BY MICROSOFTRUNS IN YOUR BROWSERNO INSTALL
1 / 5
Auto-playing · use ‹ › to step through each page, or click a dot to jump
This web app reads two CSV exports in your browser: a Microsoft Entra user export and a Copilot credit consumption export. Nothing is uploaded. It joins the files on user principal name and prices usage into FOCUS-aligned cost columns.
⏱ ~10 minutes · browser only · two admin exports
Export the two CSVs, open the app, then drop both files into the upload area.
1 Export Microsoft Entra users
Microsoft Entra admin center (entra.microsoft.com) → Identity → Users → All users → Download users (CSV; supplies department, job title, cost centre, business unit; you can load more than one).
2 Export Copilot credit consumption
Microsoft 365 admin center (admin.microsoft.com) → Copilot → Cost management → Consumption tab → Export CSV (one row per user with credits consumed).
Cost columns producedrates can be tuned live
The app joins the two files on user principal name and prices usage into the FOCUS cost columns: List, Contracted, Effective and Billed.
Use department, cost centre or business unit from the Entra export as the allocation lens.
The demo uses synthetic data and runs in the browser.
Cowork ROI Model (Web App)
Browser-only ROI scenario model with research-backed defaults and editable assumptions
Task volumes · minutes-per-task bands · assisted hours · value and ROI calculated live
BUILT BY MICROSOFTRUNS IN YOUR BROWSERNO FILES NEEDED
1 / 3
Auto-playing · use ‹ › to step through each page, or click a dot to jump
There is no file to upload, no export to request and no admin to chase. The model runs entirely in your browser: type task volumes and assumptions, then read the live assisted-hours, value and ROI outputs.
⏱ ~10 minutes · browser only · no tenant export
Open the model and enter the scenario assumptions you want to test.
Give the scenario a clear name so exported or shared outputs are easy to identify later.
3 Enter task volumes
Enter your task volumes per category. Adjust minutes per task if you want to depart from the research band; use the reset control to return minutes to the band.
What is pre-filledyou can override it
Minutes-per-task bands are pre-filled from published research. The model keeps the assumptions visible so finance and business owners can challenge them before relying on the ROI result.
4 Set money inputs
Set annual cost, blended hourly rate, monthly active users and unlicensed seats.
5 Read and export the outputs
Review assisted hours, value and ROI as they recalculate live, then export or share the scenario.
🧮 M365 Copilot Productivity ROI Calculator
Browser-only ROI modeler that turns one Viva Insights person-query export into a defensible Copilot value story
Executive summary · per-org value · usage-tier ROI · break-even · expansion · unlicensed opportunity
BUILT BY MICROSOFTRUNS IN YOUR BROWSERNO INSTALL
1 / 7
Auto-playing · use ‹ › to step through each page, or click a dot to jump
The calculator reads one CSV: a Viva Insights person-query export, one row per person per week. Everything is parsed in your browser — the file is never uploaded anywhere. Bring your own export, or open the built-in demo first.
⏱ ~15 minutes · browser only · one Viva Insights export
Run one Viva person query, open the calculator, drop the CSV in.
1 Run the Viva Insights person query
Open the Viva Insights Analyst Workbench (sign-in required), then Analysis results → Create analysis → the Person query card → Set up analysis. Set Time period to Last 6 months (rolling), Group by to Week, and the filter to Is Active = True. Under metrics choose Microsoft 365 Copilot — all metrics, add the attributes Organization, FunctionType and TimeZone, then run it and download the result as CSV from Analysis results.
What the file must contain(the calculator validates the header row on upload)
At minimum the export needs PersonId, MetricDate and Total Copilot actions taken. Grouping by Week is required — the usage-tier cohorts need at least 12 consecutive weekly rows per person (the 9-of-12-weeks habit rule). British-English and Spanish column names are auto-translated, so a localized export works as-is.
The retired Super Usage heatmap export is rejected on upload — its wide YYYY-MM-DD Metric columns are detected and the app tells you to re-export as a Person query. The person query is the only accepted format.
Want to see the exact shape first? sample-data.csv is a real person-query example.
2 Open the calculator
Open the ROI Calculator — it runs entirely in your browser, nothing to install. Prefer an air-gapped copy? Download & run locally (a ~2 MB ZIP with a one-click launcher, zero external calls).
3 Set your assumptions
Pick an industry (or a custom blended hourly rate), the licence cost per user per month, the minutes saved per Copilot action, and the analysis period. Every figure recalculates live as you sweep these.
4 Drop in the CSV
Drag the export onto the upload area. Parsing happens locally in the page — the file never leaves your machine — and the Executive Summary, per-org value, usage-tier ROI, break-even, expansion and unlicensed-opportunity views populate immediately.
One click to a sponsor-ready deliverable
With your data loaded, the calculator exports a branded Executive Deck (9 slides), a Word write-up or a PDF — the same deck previewed in step 1, populated with your numbers.
See the whole value story on a synthetic dataset before you touch tenant data.
1 Open the live demo
Open the demo report (or click View Demo inside the calculator). It loads a built-in Viva person-query dataset — 300 people, 7 organizations, 14 weeks — with sensible defaults (350 licences, $30/user/mo, 6 min/action, $78/hr). No file to pick, no sign-in.
2 Explore every section
Executive Summary, Organizations, Usage Tier Value Distribution, ROI & Forecast, Expansion Projections, Unlicensed User Opportunity Cost and the Adjusted Copilot-Assisted-Hours model all render on the sample data, exactly as they will on yours.
3 Switch to real data when ready
Every export from demo mode is watermarked DEMO DATA, so swap in your own person-query CSV (tab 1) before sharing anything with a sponsor.