RFC: Fix overlapping bars on continuous axes
Rendering x-axis and bars
D3's linear scales don't account for the bar width. So it is necessary to create the scale(s) in such a way that the bars fit within the available space, and the x-axis ticks align correctly with the bars.
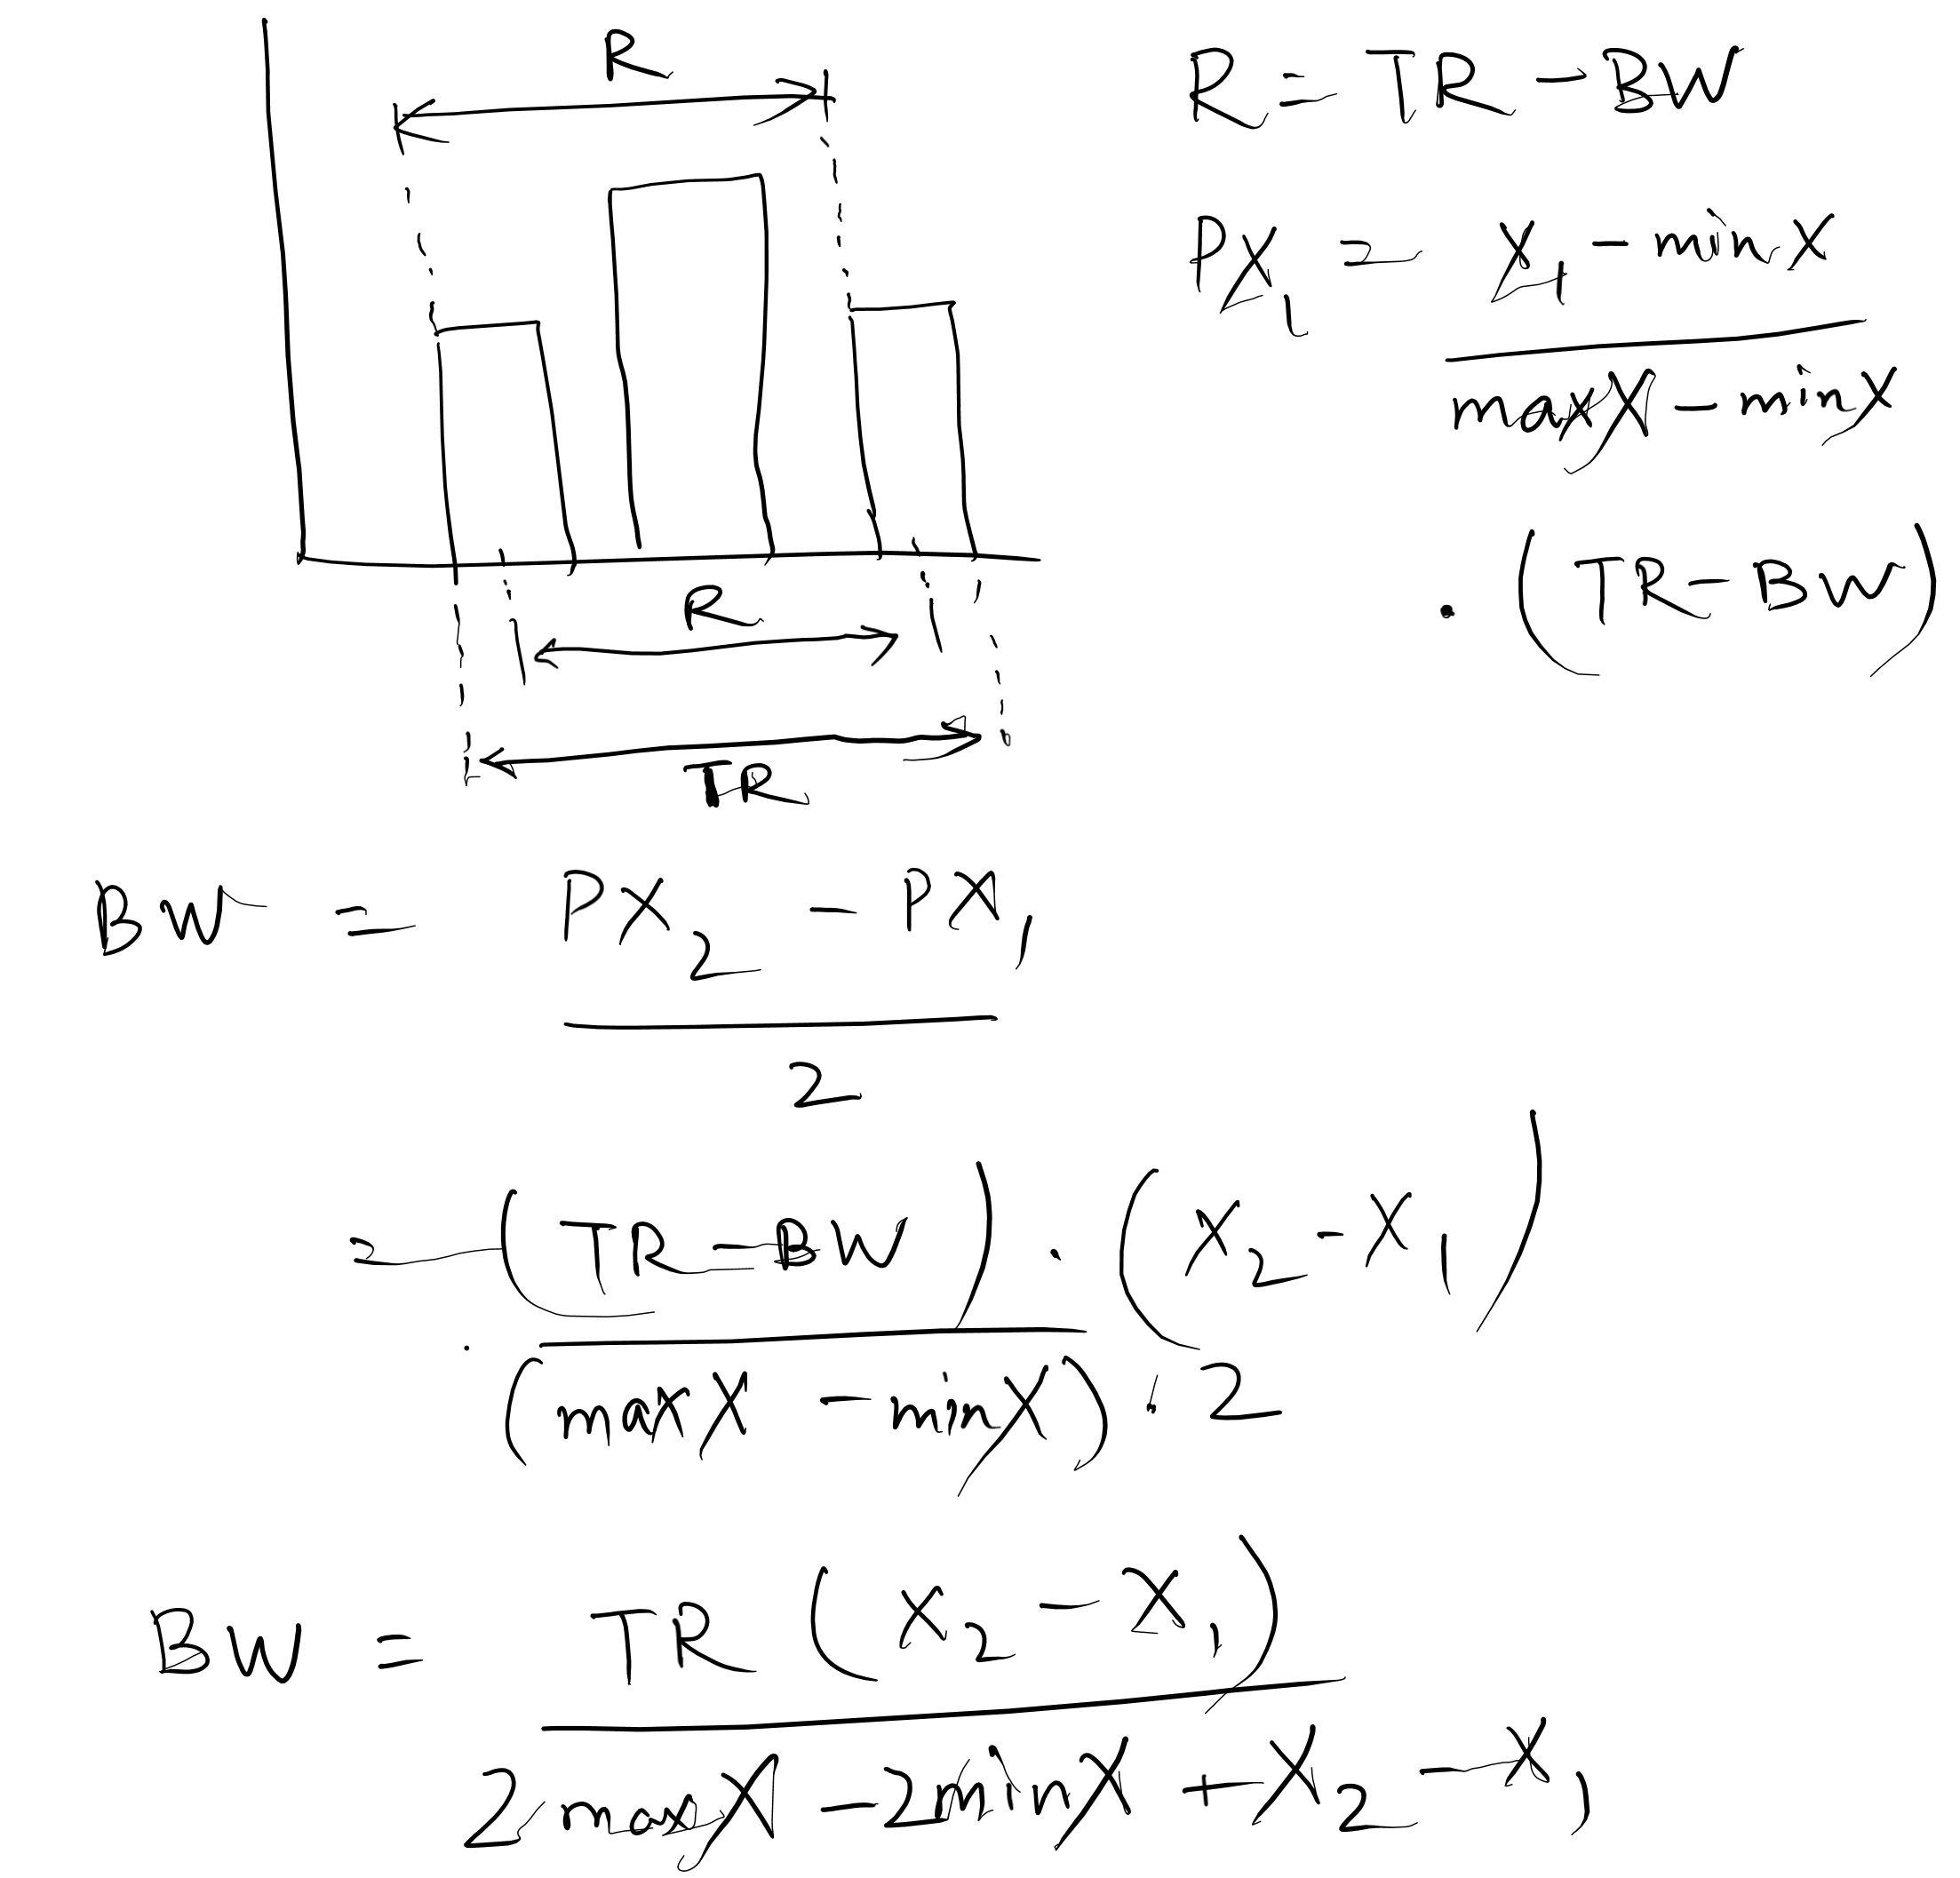
Let be the total width of the space available to render the bars. The first bar should begin at the leftmost end of the space, and the last bar should extend to the rightmost end of the space. The x-axis ticks should align with the center of their respective bars, i.e., the first tick should align with the center of the first bar, and the last tick should align with the center of the last bar. Thus, the range of the x-axis scale becomes , where is the bar width. To render the bars, we can just adjust the scale range by translating it to the left by , resulting in . This will ensure that the scale returns the starting points of the bars.
Therefore, it is important to determine the bar width beforehand to ensure accurate rendering of both the x-axis and the bars.
Note: There is no need to create separate scales for the x-axis and bars. Instead, we can use the same scale and adjust its range accordingly to render them.
Calculating appropriate bar width
To prevent bars from overlapping, we will need to adjust the bar width dynamically based on several factors, rather than using a fixed value. Consider this perspective: If we can estimate the bar width to ensure that the closest pair of bars don't overlap, rendering all bars with that width would eliminate overlapping altogether. To determine this bar width, we require the pixel distance between the closest pair of bars. Let's assume a minimum spacing of 1:1 between adjacent bars. Thus,
where and are the positions of the closest pair of bars on the x-axis.
In linear scales, each range value can be expressed as a function of the domain value : . While we have established the range for the x-axis scale, we also need to define the scale domain to determine the positions of the bars. The scale domain will be equal to the range of the data . To calculate and , we must identify the closest pair of x values from the data. Thus,
and
Consequently,
Solving it yields
Note: The above calculation may not yield accurate results for numeric scales when created with the nice() function, which extends the domain so that it starts and ends on nice round values. While this approach can help prevent overlapping, it might not guarantee exact 1:1 spacing between the closest bars.
Implementation
Attempt
As the rendering of bars is handled within VerticalBarChart, the bar width calculation is also integrated there. To determine the total width , we rely on the containerWidth, a state within CartesianChart. States from a child component (CartesianChart) can only be passed to its parent component (VerticalBarChart) through a function prop provided by the parent. Currently, the following functions are used to pass containerWidth to VerticalBarChart:
getDomainMargins()getGraphData()
Since getDomainMargins() is invoked before the x-axis and bars are rendered, it serves as the appropriate location to integrate the bar width calculation. Although the bar width in VerticalBarChart is not a state but a class variable, it is passed as a prop to CartesianChart for the purpose of rendering the x-axis.
Observations
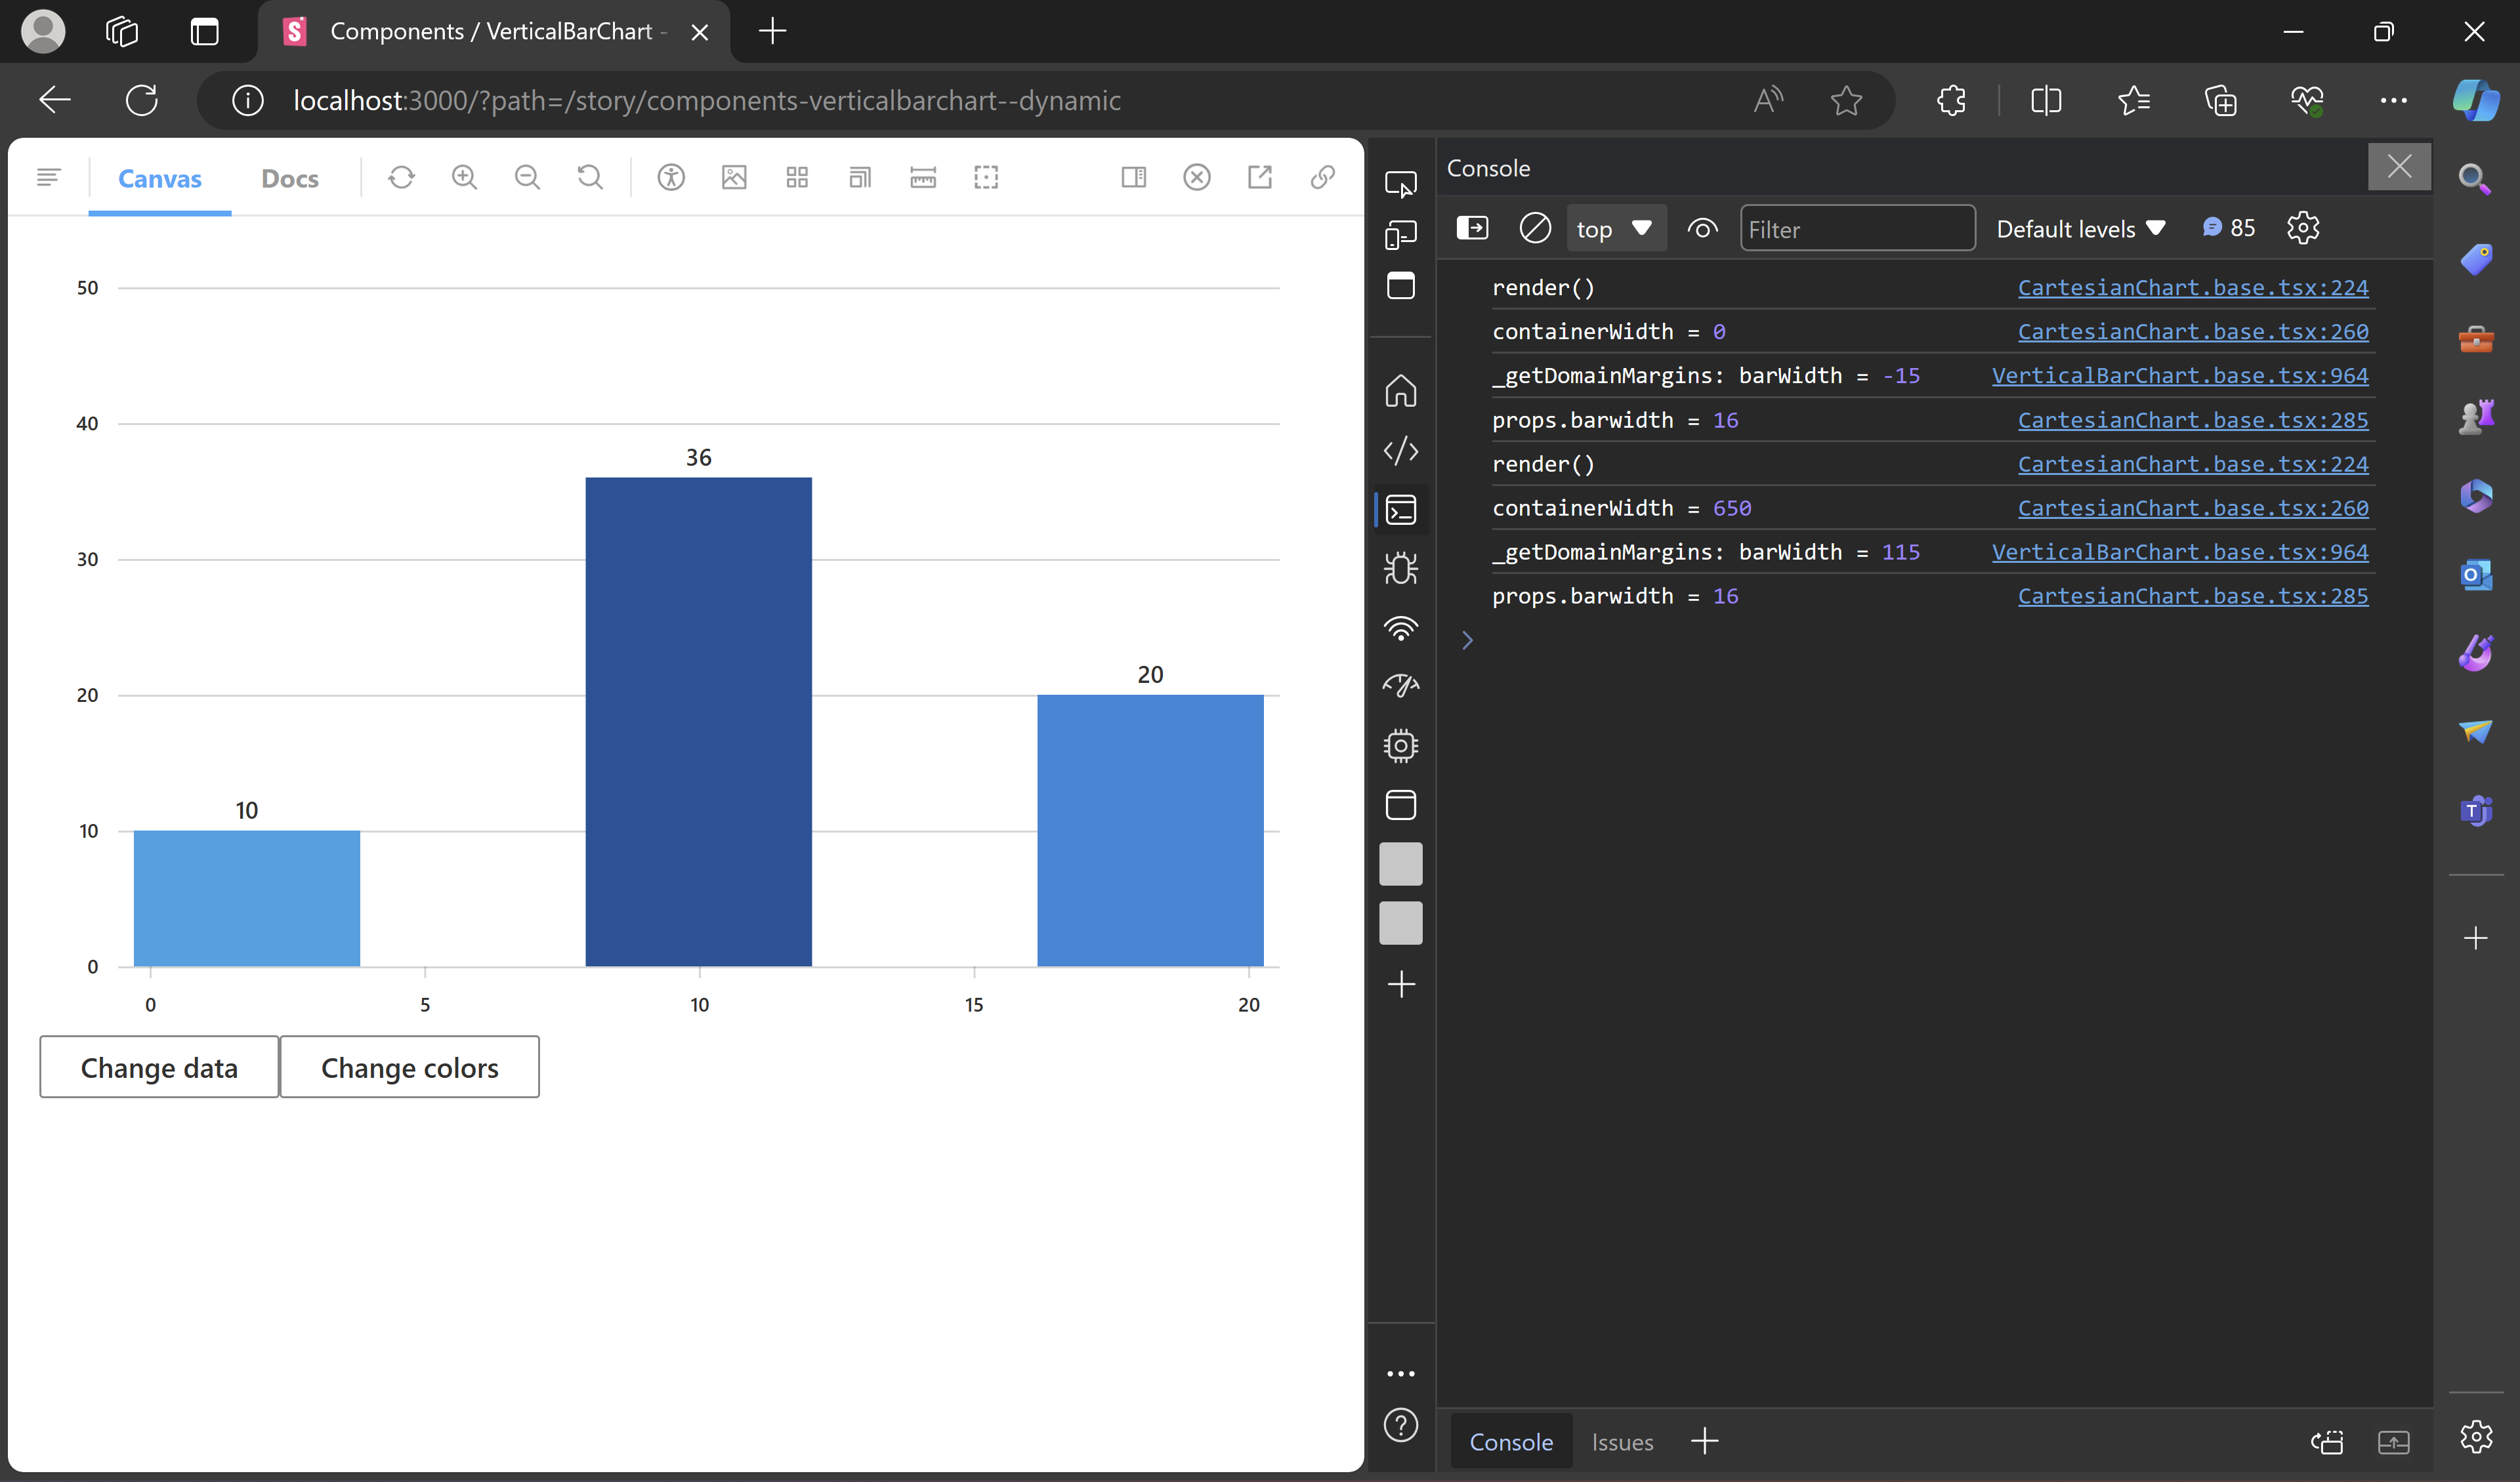
- The bars are rendered with the updated
barWidth. - The axis ticks do not align with the bars.
Solutions
- Update
barWidthafter thecontainerWidthstate is updated but before CartesianChart renders. This can be done by using a React lifecycle method that executes with the updated state just before rendering. - Create a state for bar width within VerticalBarChart to ensure that CartesianChart also rerenders when the value of the
barwidthprop changes. - Decouple the axis utilities invoked within CartesianChart from directly depending on the
barwidthprop by including the bar width in the margins used for calculating the scale range. (This solution has been implemented due to its simplicity) - Manage and update bar width within CartesianChart, and pass it to VerticalBarChart through the
getGraphData()function.