This page describes the
SQL Server VM on Azure
SQL Server On-Premises
HDInsight Spark
solution.
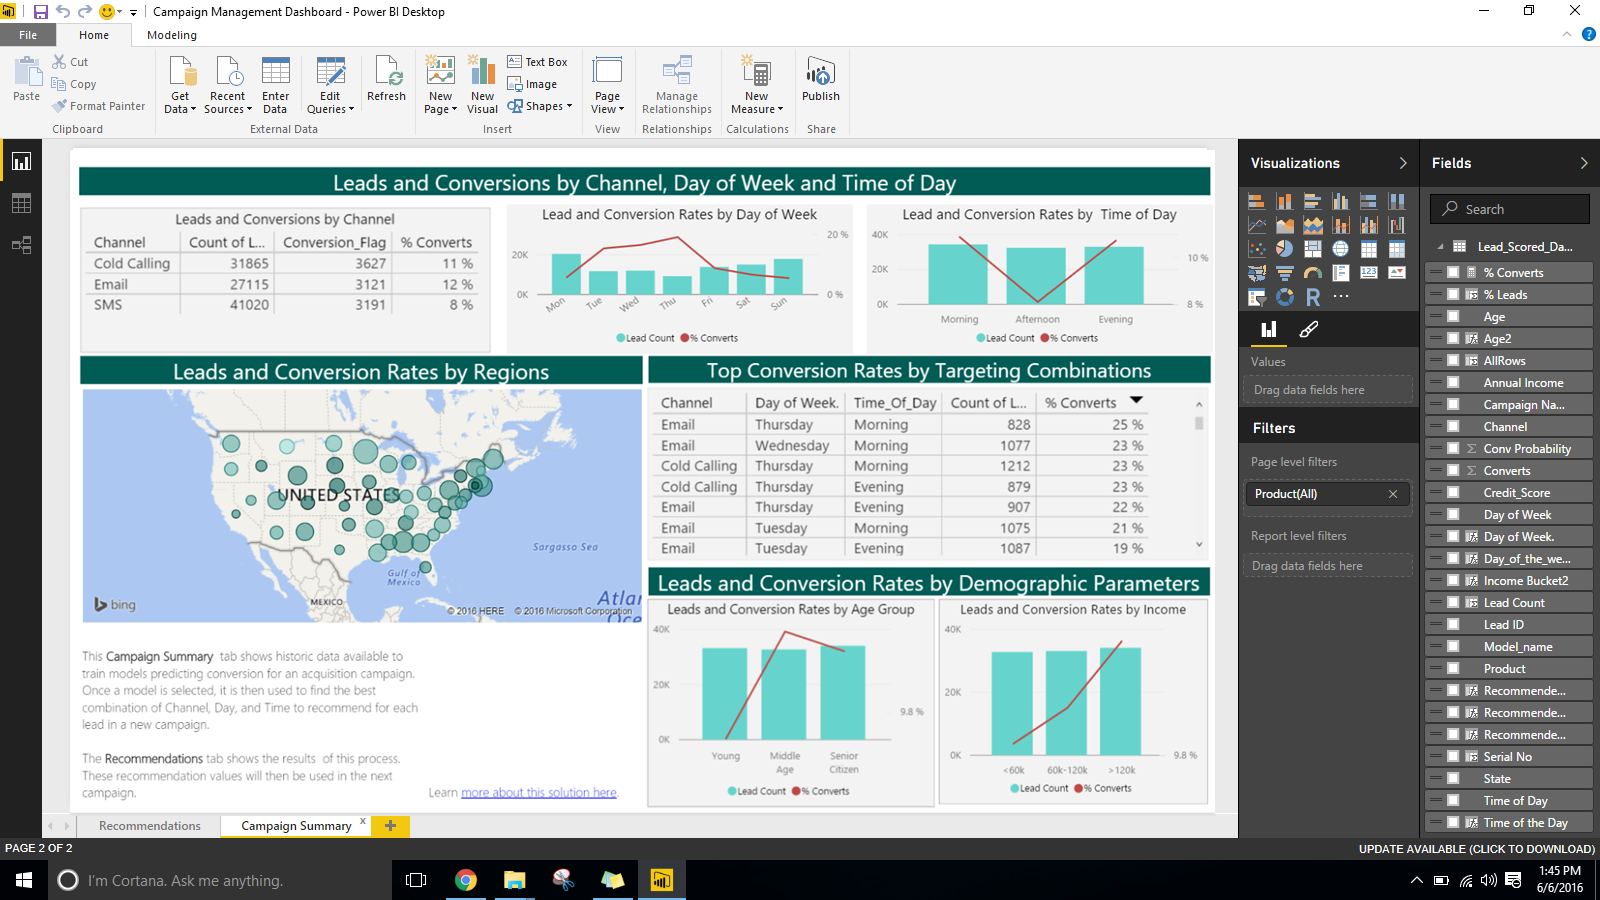
Visualizing Results with PowerBI
These instructions show you how to replace the cached data in the PowerBI dashboard with data from your SQL Server HDInsight solution , by using an ODBC connection to the SQL Database Hive table.
First, try refreshing the data using the Refresh button on the toolbar.
Use your Windows credentials if prompted.
If this does not work, you may need to modify the connection information by using the steps below.
- Set up Connection between SQL Server and PowerBI using these instructions.
- Set up Connection between Hive and PowerBI using these instructions.
- Open the
Campaign Optimization Dashboard.pbixfile in the Campaign folder. Download the Campaign Optimization DashboardHDI.pbix and open it on your desktop. - Click on
Get Dataand selectMore...The PowerBI dashboard will show charts built from cached data. We need to set it up to use the latest available scored dataset in the SQL ServerHive table.
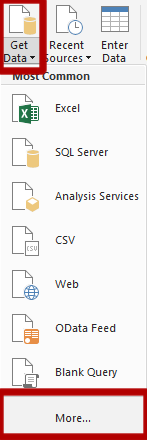
- Select
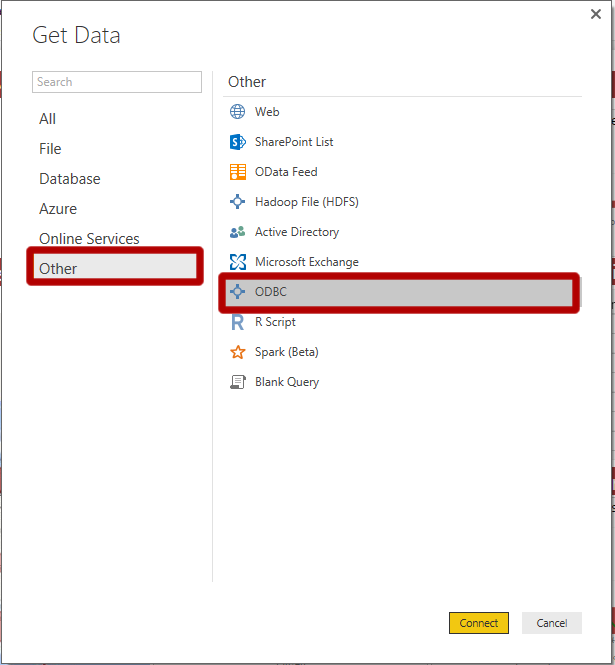
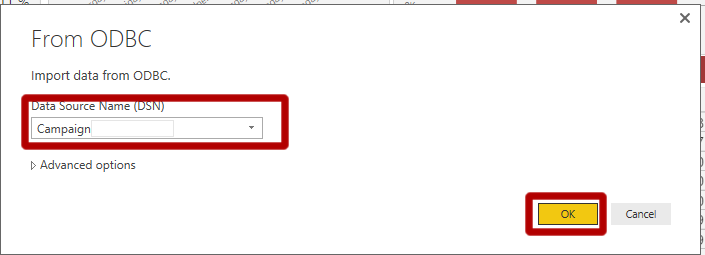
Get DatathenOtherand then selectODBCand ClickOK
- Under Data Source Name Enter
Campaignand clickOK
- Navigate to Campaign > dbo and check Recommendations. Click
Load.
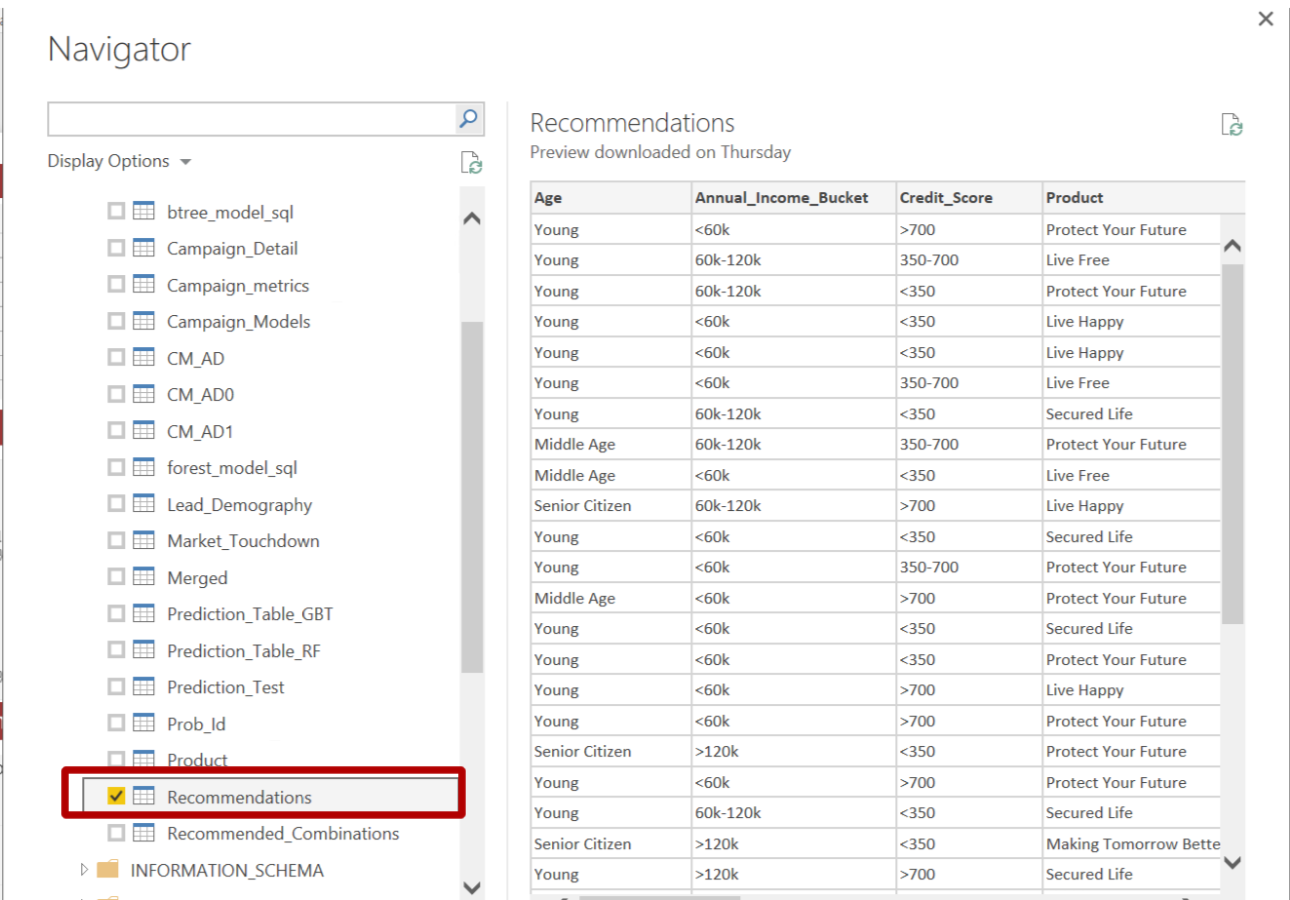
- Navigate to Spark > default and check recommendations. Click
Load. - Once the data is loaded. Click on
Edit Queries. You will see this new window
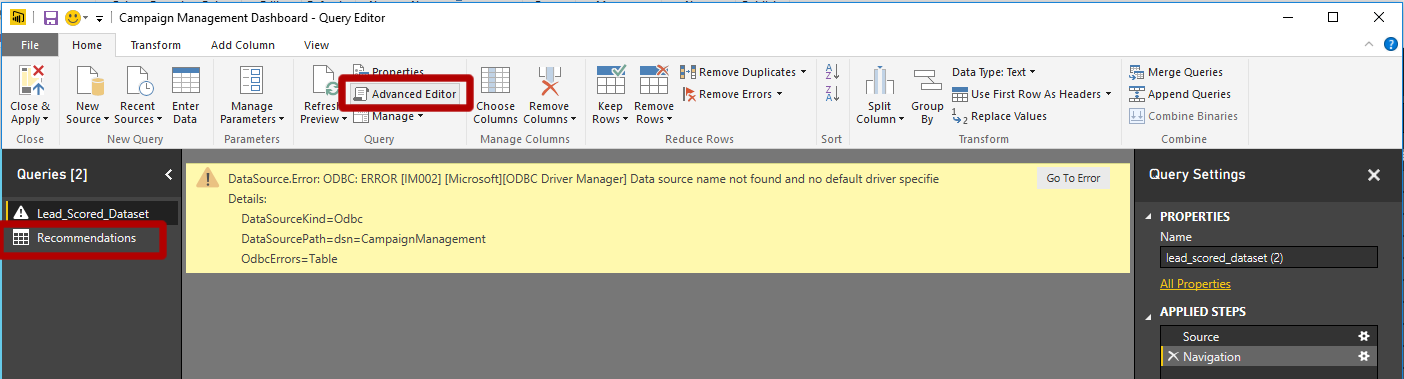 Notice that on the left hand side you have 2 datasets:
 Lead_Scored_DatasetandRecommendationsrecommendations. - Click on the second dataset (
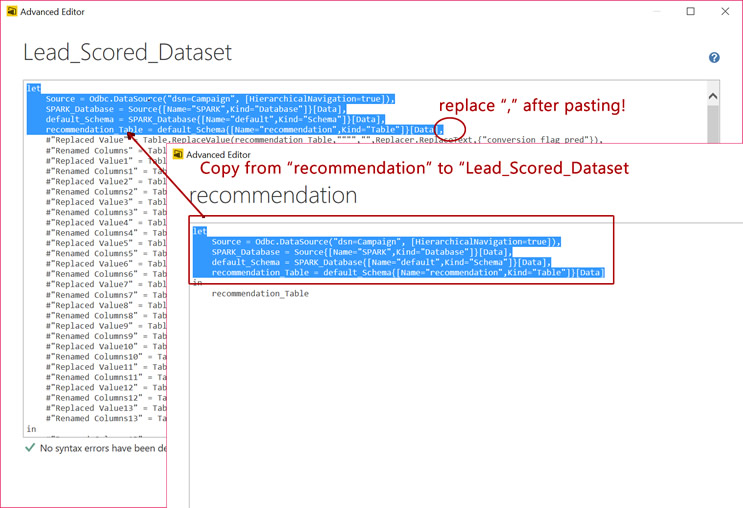
Recommendationsrecommendations) and then click onAdvanced Editorin the toolbar. Select and copy all the code in the dialog that appears. Select and copy the code in the dialog that appears - from the top to the fifth line (ending with [Data]). Then clickDoneto close this dialog. - Next, click on the first dataset (
Lead_Scored_Dataset) and then click on ‘Advanced Editor’ in the toolbar. Delete all the code here and paste what you just copied into this dialog. Replace the first five lines with the code you just copied. Then add a "," to the end of what you pasted.
-
Click
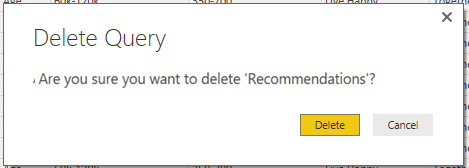
Doneto close this dialog. You should see the earlier warning disappear and be replaced with a table of data. This is the data from the SQL databaseHive table. - Next, click on the second dataset (
Recommendationsrecommendations) and press the delete key on your keyboard. You will see a pop up asking if you want to delete it. Click onDelete.
- Next, click on
CloseandApply.
- Press
Refresh. This will refresh the back end data of the dashboard and refresh the visuals. You are now viewing data from your SQL DatabaseHive table, rather than the imported data that was part of the initial solution package. Updates from the SQL DatabaseHive table will be reflected each time you hitRefresh.