For the Business Manager
This solution template uses (simulated) historical data to predict how and when to contact leads for your campaign. The recommendations include the best channel to contact a lead (in our example, Email, SMS, or Cold Call), the best day of the week and the best time of day during which to make the contact.
You can access this dashboard in either of the following ways:
-
Visit the online version.
-
Open the PowerBI file from the Campaign directory on the deployed VM desktop.
-
Install PowerBI Desktop on your computer and download and open the Campaign Optimization Dashboard
-
Install PowerBI Desktop on your computer and download and open the Campaign Optimization HDI Dashboard
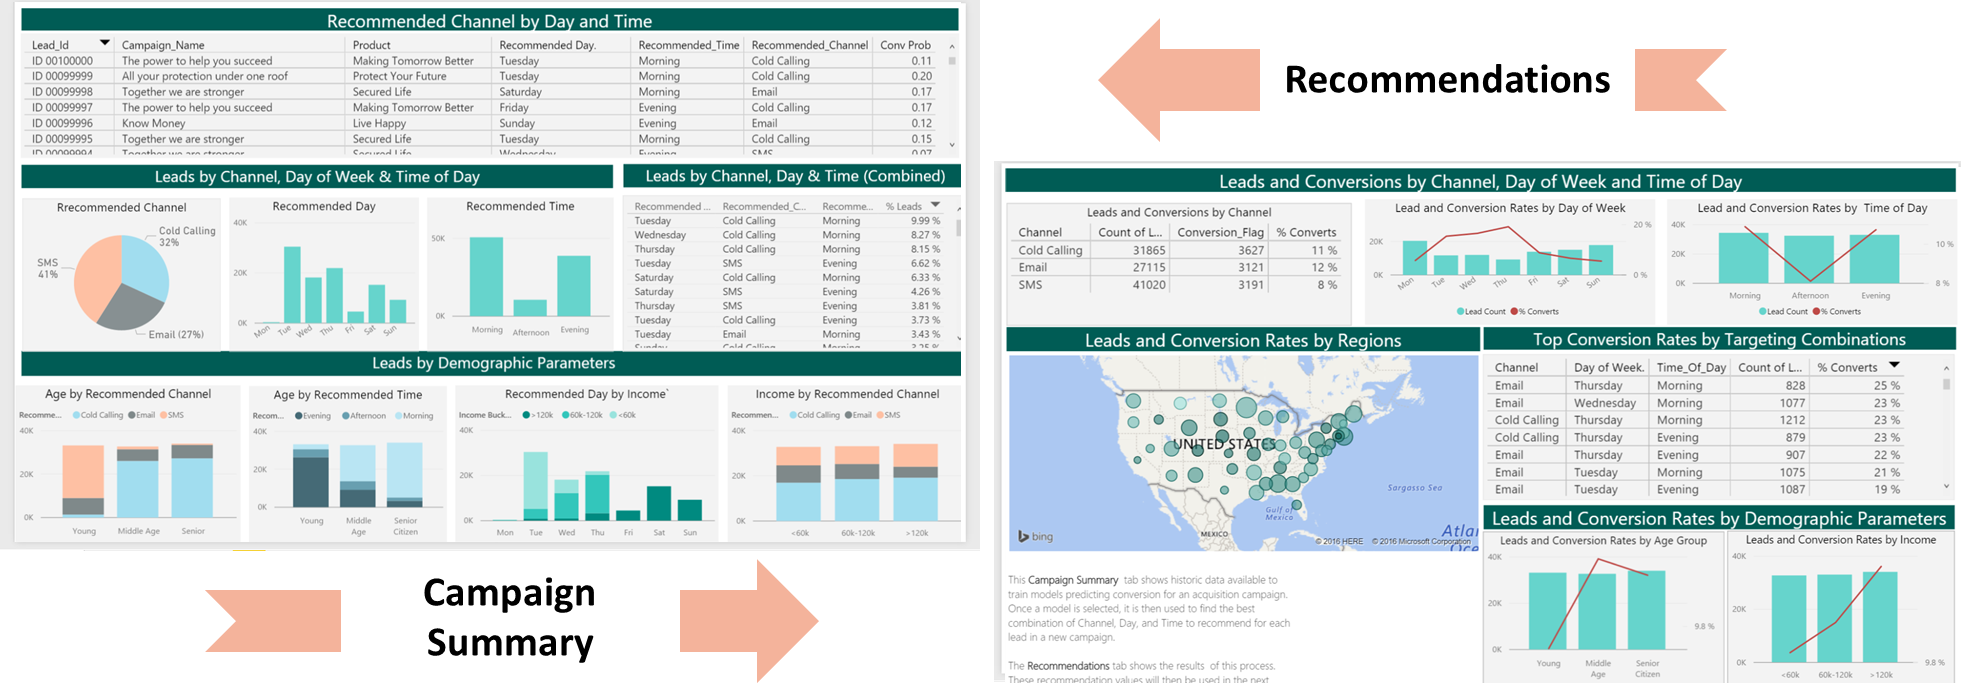
The Recommendations tab of this dashboard shows the recommendations based on a prediction model. At the top is a table of individual leads for our new deployment. This includes fields for the Lead ID (unique customer ID), campaign and product, populated with leads on which our business rules are to be applied. This is followed by the optimal channel and time to contact each one, and then the estimated probabilities that the leads will buy our product using these recommendations. These probabilities can be used to increase the efficiency of the campaign by limiting the number of leads contacted to the subset most likely to buy.
Also on the Recommendations tab are various summaries of recommendations versus demographic information on the leads.
The Campaign Summary tab of the dashboard shows summaries of the historical data used to create the prediction model. While this tab also shows values of Day of Week, Time of Day, and Channel, these values are actual past observations, not to be confused with the recommendations shown on the Recommendations tab.
To understand more about the entire process of modeling and deploying this example, see For the Data Scientist.