For the Data Scientist - Develop with R
Campaign Optimization
This template is focused on marketing campaign optimization. In particular, customer-oriented businesses can learn patterns from their data to intelligently design acquisition campaigns and convert the highest possible number of customers.
Among the key variables to learn from data are the best communication channel (e.g. SMS, Email, Call), the day of the week and the time of the day through which/ during which a given potential customer is targeted by a marketing campaign.
To try this out yourself, visit the Quick Start page.
Below is a description of what happens in each of the steps: dataset creation, model development, recommendations, and deployment in more detail.
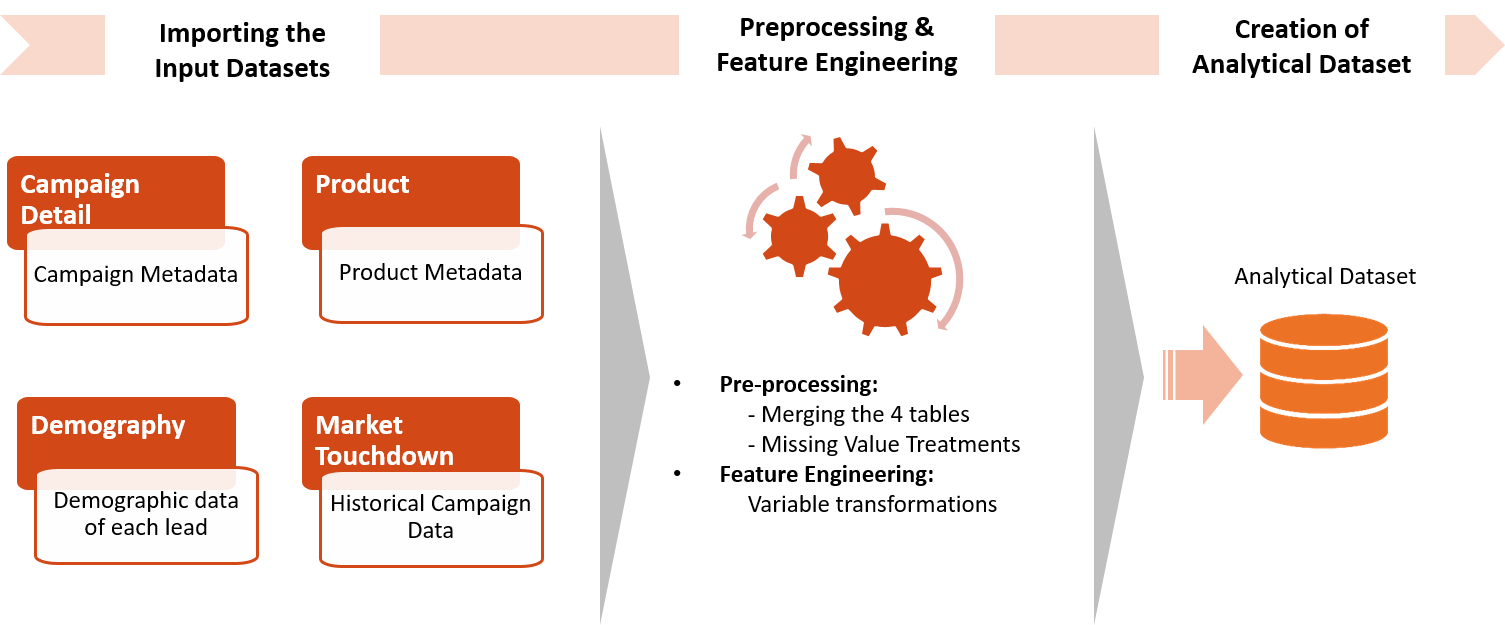
Analytical Dataset Preprocessing and Feature Engineering
This part simulates input data and performs preprocessing and feature engineering to create the analytical dataset.
rxExec function. This function is similar to the foreach function in open source R, while it can parallel computation across different nodes under the Spark compute context. In this implementation, we split the whole data set into multiple subsets by Lead_ID and apply transformation functions to each subset with the rxExec function. The computational time is significantly reduced since the computation is fully paralleled across nodes and cores on the cluster.
The script campaign_main.R is used to run each of the scripts step1*-step4*, described in the sections below.
step1_data_processing.R
step2_feature_engineering.R
This script performs feature engineering in-database to generate the Analytical Dataset.
-
SMS_Count,Call_Count,Email_Count: number of times every customer (Lead_Id) has been contacted through every Channel. -
Previous_Channel: the previous channel used towards every customer for every campaign activity.
Finally, only the latest campaign activity for every customer is kept.
Model Development
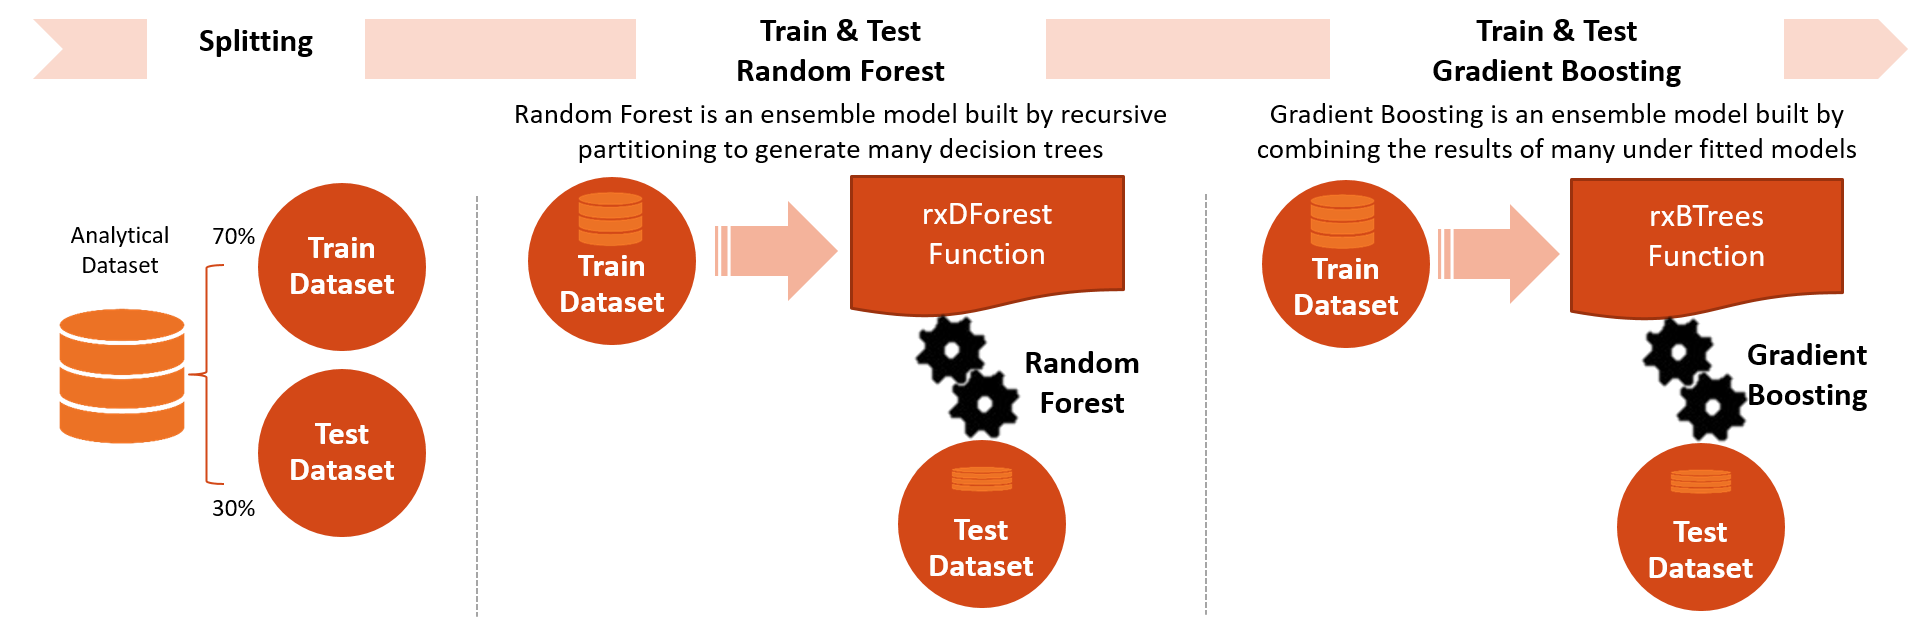
Two models, Random Forest and Gradient Boosted Trees are developed to model Campaign Responses. The R code to develop these models is included in the step3_training_evaluation.R script
step3_training_evaluation.R
In this step, after splitting the analytical data set into a training and a testing set, two prediction models are built (Random Forest and Gradient Boosted Trees) on the training set. Once the models are trained, AUC of both the models are calculated using the testing set.
The R script draws the ROC or Receiver Operating Characteristic for each prediction model. It shows the performance of the model in terms of true positive rate and false positive rate, when the decision threshold varies.
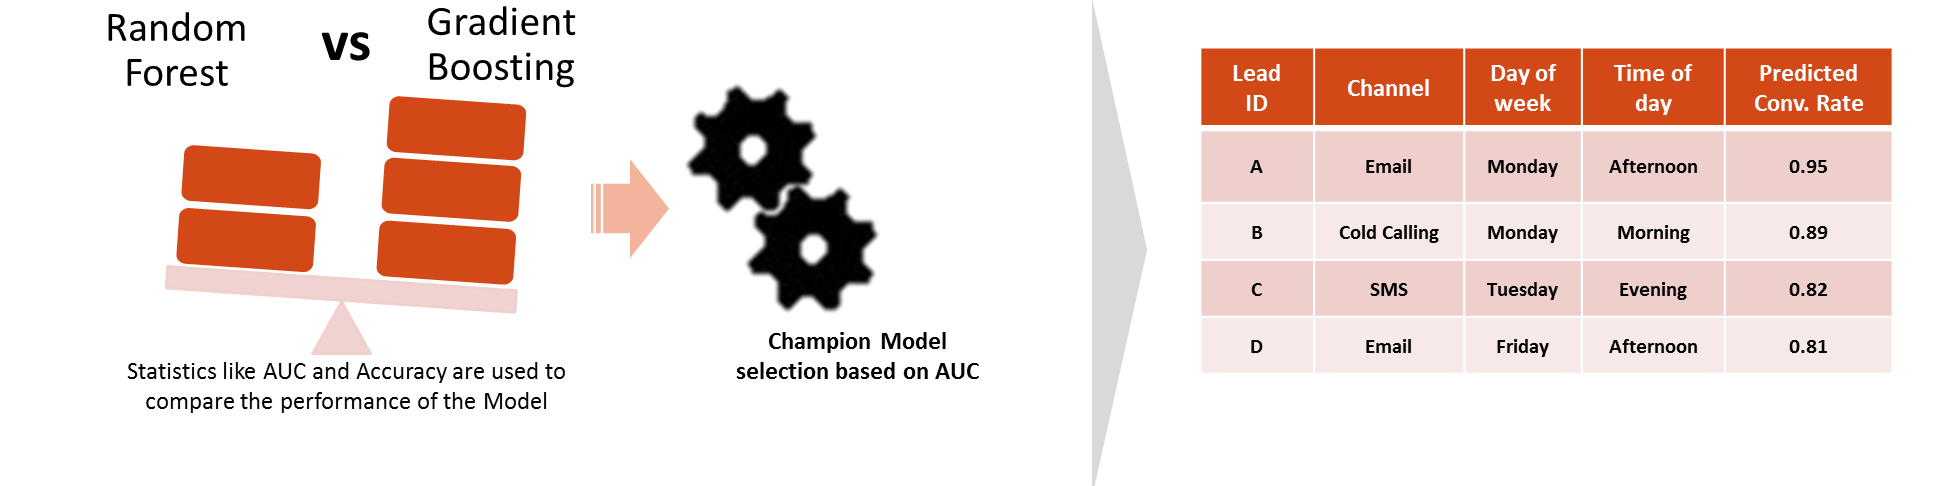
The AUC is a number between 0 and 1. It corresponds to the area under the ROC curve. It is a performance metric related to how good the model is at separating the two classes (converted clients vs. not converted), with a good choice of decision threshold separating between the predicted probabilities. The closer the AUC is to 1, and the better the model is. Given that we are not looking for that optimal decision threshold, the AUC is more representative of the prediction performance than the Accuracy (which depends on the threshold).
The model with the best AUC is selected as the champion model and will be used for recommendations.
Computing Recommendations
The champion model is used to provide recommendations about how and when to contact each customer. The R code to provide the recommendations is inlcuded in the step4_campaign_recommendations.R script.
step4_campaign_recommendations.R
This script creates a full table with 63 rows for each customer, corresponding to the possible 63 combinations of day, time and channel (7 Days x 3 Times x 3 Channels = 63). Each combination is scored with the champion model and, for each customer, the one with the highest conversion probability is used as the recommendation for that lead. Results from this step are stored in the Recommendations Hive database table.
Deploy and Visualize Results
Deploy
The script campaign_deployment.R creates and tests a analytic web service. The web service can then be used from another application to score future data. The file web_scoring.R can be downloaded to invoke this web service locally on any computer with Microsoft ML Server 9.0.1 or later installed.Visualize
The final step of this solution visualizes these recommendations.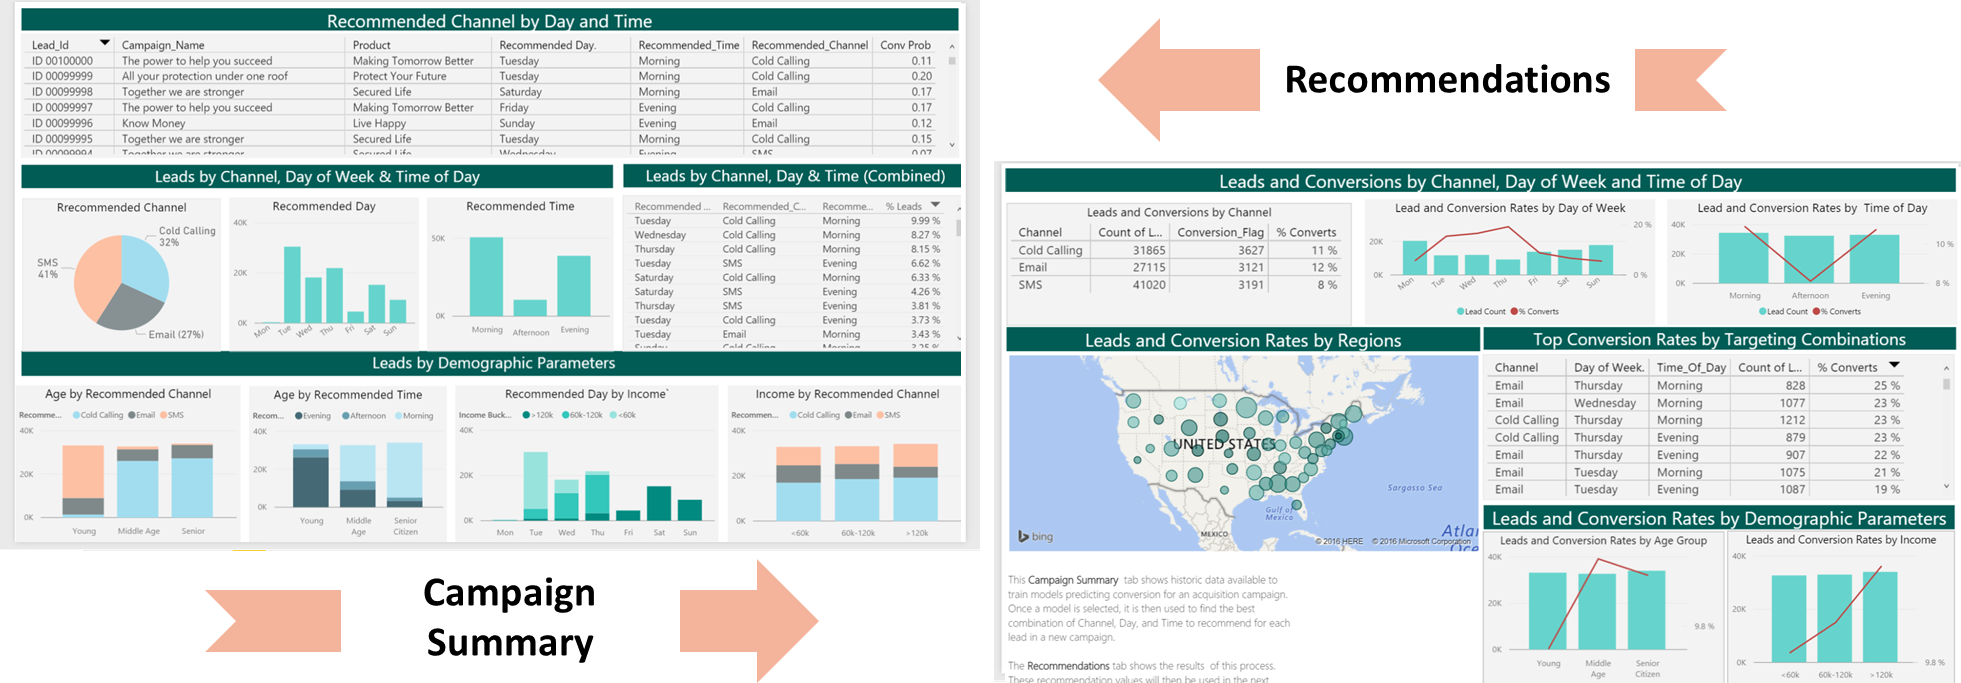
You can access this dashboard in either of the following ways:
-
Visit the online version.
-
Open the PowerBI file from the Campaign directory on the deployed VM desktop.
-
Install PowerBI Desktop on your computer and download and open the Campaign Optimization Dashboard
-
Install PowerBI Desktop on your computer and download and open the Campaign Optimization HDI Dashboard
System Requirements
The following are required to run the scripts in this solution:- SQL Server 2016 with Microsoft R Server (version 9.0.1) installed and configured.
- The SQL user name and password, and the user configured properly to execute R scripts in-memory.
- SQL Database which the user has write permission and execute stored procedures.
- For more information about SQL server 2016 and ML Services, please visit: https://docs.microsoft.com/en-us/sql/advanced-analytics/what-s-new-in-sql-server-machine-learning-services
Template Contents
View the contents of this solution template.
To try this out yourself:
- View the Quick Start.