SPARK Attestation Campaign
Schedule Send Email Runbook
- Schedule
- Every Morning at 07:00 AM
- Repeat for 2-4 weeks
- Day 1
- Notifiy DL-SPARK-SiteOwners 1-2 DLs
- Day 2
- Notifiy DL-SPARK-SiteOwners 1-4 DLs
- Day 3
- Notifiy DL-SPARK-SiteOwners 1-6 DLs
- Day 4
- Notifiy DL-SPARK-SiteOwners 1-8 DLs
- Day 5
- Notifiy DL-SPARK-SiteOwners 1-10 DLs
The rb-spark-sendemail-toDL can be scheduled to send to the distribution list groups throughout the week. This will allow users to access the system without creating a large demand. We recommend sending an email very early in the morning. This will allow users to gradually access the system, as the start time for the users will range from 6AM to 9AM. If you schedule the email after 9AM, you will generally see a much higher demand of the resources which may lead to degradation of the services. This process should run for at least 2-4 weeks, depending on how quickly the site admins and owners take to attest for their sites.
Notification Sent State
The rb-spark-sendemail-toDL runbook properties will need to be set correctly if you choose to schedule the runbooks to send to the DLs over 5 days. Set the UpdateStateToNotificationSent property to False until Day 5. We do not want to move them all to the notification sent state, until all DLs have been notified.
Scale Up
- SQL >50k
- Scale to P1
- SQL >250k
- Scale to P2
- Function App >50k
- Plan: P2V3
- Instances: 5
- Function App >100k
- Plan: P2V3
- Instances: 10
- Function App >250k
- Plan: P3V3
- Instances: 15
It’s recommended to start to ramp up the system at least 1 hour prior to sending the email. The system will need to be ramped up and settled. The main service used by the users will be the Function App. We will need to be scale it up and out. Scaling up will increase the CPU/Memory/Storage, while scaling out will increase the instances allowing it to handle more demand. Scaling to handle demand will cause an increase demand for SQL, which will need to be scaled up to the Performance Tier based on the number of sites in the tenant.
SQL Defragmentation
Until the DB Maintenance runbook is published, you will need to manually run some SQL to ensure the fragmentation of the indexes are under 10%. You should complete this after you scale up and have waiting for SQL to settle. Below is the script to execute to view the fragmentation percentages of the indexes.
1
2
3
4
5
6
7
8
9
10
11
12
13
14
15
16
17
18
19
20
21
SELECT
    dbschemas.[name] AS schema_name,
    dbtables.[name] AS table_name,
    dbindexes.[name] AS index_name,
    indexstats.avg_fragmentation_in_percent,
    indexstats.page_count
FROM sys.dm_db_index_physical_stats (
        DB_ID(),
        OBJECT_ID('dbo.spark_site_collection'),
        NULL,
        NULL,
        'SAMPLED'
    ) AS indexstats
INNER JOIN sys.tables dbtables
    ON dbtables.[object_id] = indexstats.[object_id]
INNER JOIN sys.schemas dbschemas
    ON dbtables.[schema_id] = dbschemas.[schema_id]
INNER JOIN sys.indexes AS dbindexes
    ON dbindexes.[object_id] = indexstats.[object_id]
    AND indexstats.index_id = dbindexes.index_id
ORDER BY indexstats.avg_fragmentation_in_percent DESC;
Below are the SQL commands to execute one at a time for rebuilding the indexes.
1
2
3
4
5
6
/* Run each command individually*/
ALTER INDEX PK_spark_Site_Collection ON [dbo].[spark_Site_Collection] REBUILD WITH (ONLINE=ON)
ALTER INDEX IX_SiteCollection_siteUrl ON [dbo].[spark_Site_Collection] REBUILD WITH (ONLINE=ON)
ALTER INDEX IX_SiteCollection_attestationAction ON [dbo].[spark_Site_Collection] REBUILD WITH (ONLINE=ON)
ALTER INDEX IX_SiteCollection_siteTitle ON [dbo].[spark_Site_Collection] REBUILD WITH (ONLINE=ON)
ALTER INDEX IX_SiteCollection_templateType ON [dbo].[spark_Site_Collection] REBUILD WITH (ONLINE=ON)
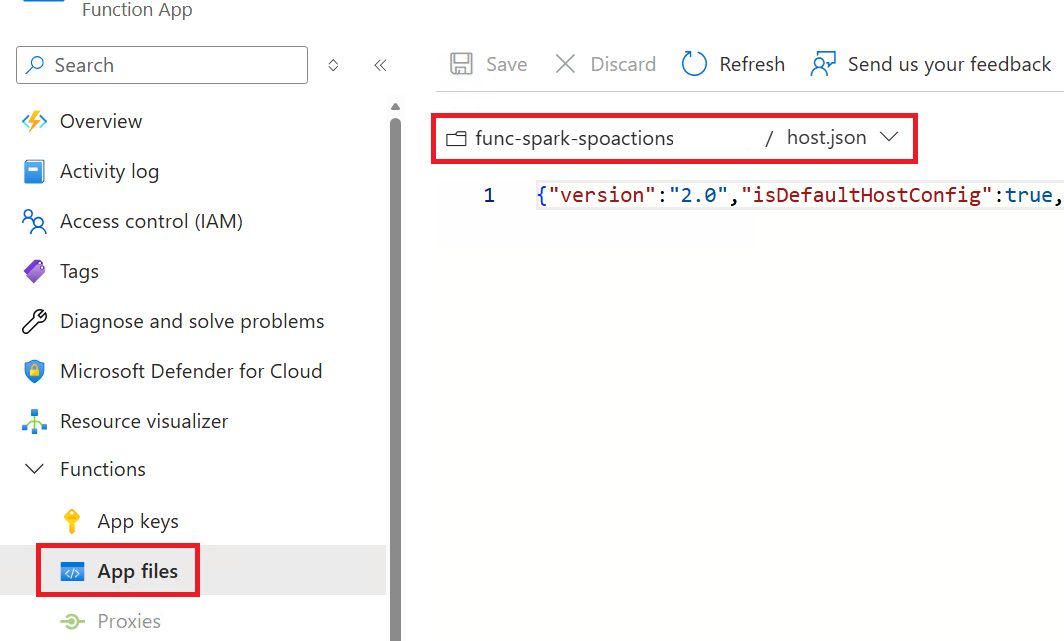
Scale Out
The Function App can be configured to handle more demand and process requests concurrently. Access the hosts.json file by clicking on App Files under the Functions navigation menu.
Function App - Enable Concurrency
You will need to enable concurrency and configure the max allowed values, in order to enable the following:
- Dynamic Concurrency
- Maximum Concurrent Requests
- Maximum Outstanding Requests
1
2
3
4
5
6
7
8
9
10
11
12
13
14
15
16
17
18
19
20
21
22
{
  "version": "2.0",
  "isDefaultHostConfig": true,
  "managedDependency": {
    "Enabled": true
  },
  "extensionBundle": {
    "id": "Microsoft.Azure.Functions.ExtensionBundle",
    "version": "[4.*, 5.0.0)"
  },
  "concurrency": {
    "dynamicConcurrencyEnabled": true,
    "snapshotPersistenceEnabled": true
  },
  "extensions": {
    "http": {
      "maxOutstandingRequests": 50,
      "maxConcurrentRequests": 30,
      "dynamicThrottlesEnabled": true
    }
  }
}
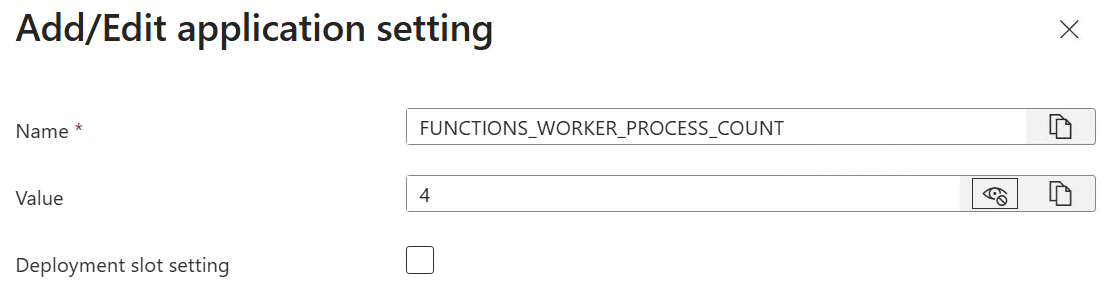
Function App - Configure Worker Processes
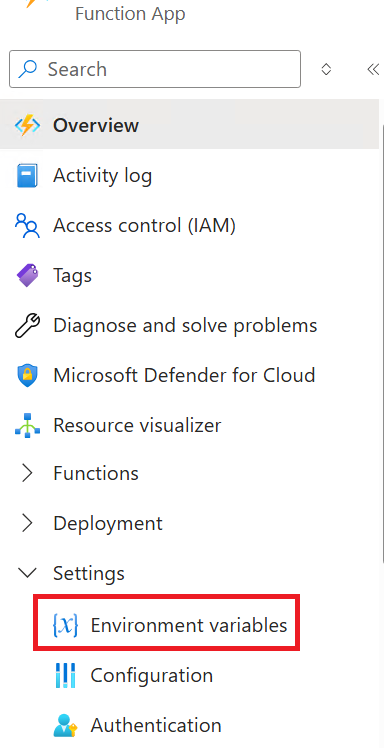
The next configuration item to complete is to specify the maximum number of language worker processes that can be spawned for the Function App. This will help optimize the performance of the function app. Access the Environment Variables by click on Environment Variables under the Settings navigation menu. Add the new variable and set the value.
Monitor Metrics
You will need to monitor the load of the Function App and SQL based on the demand. This will be critical to monitor during the first two hours after sending the email to the site admins and owners.
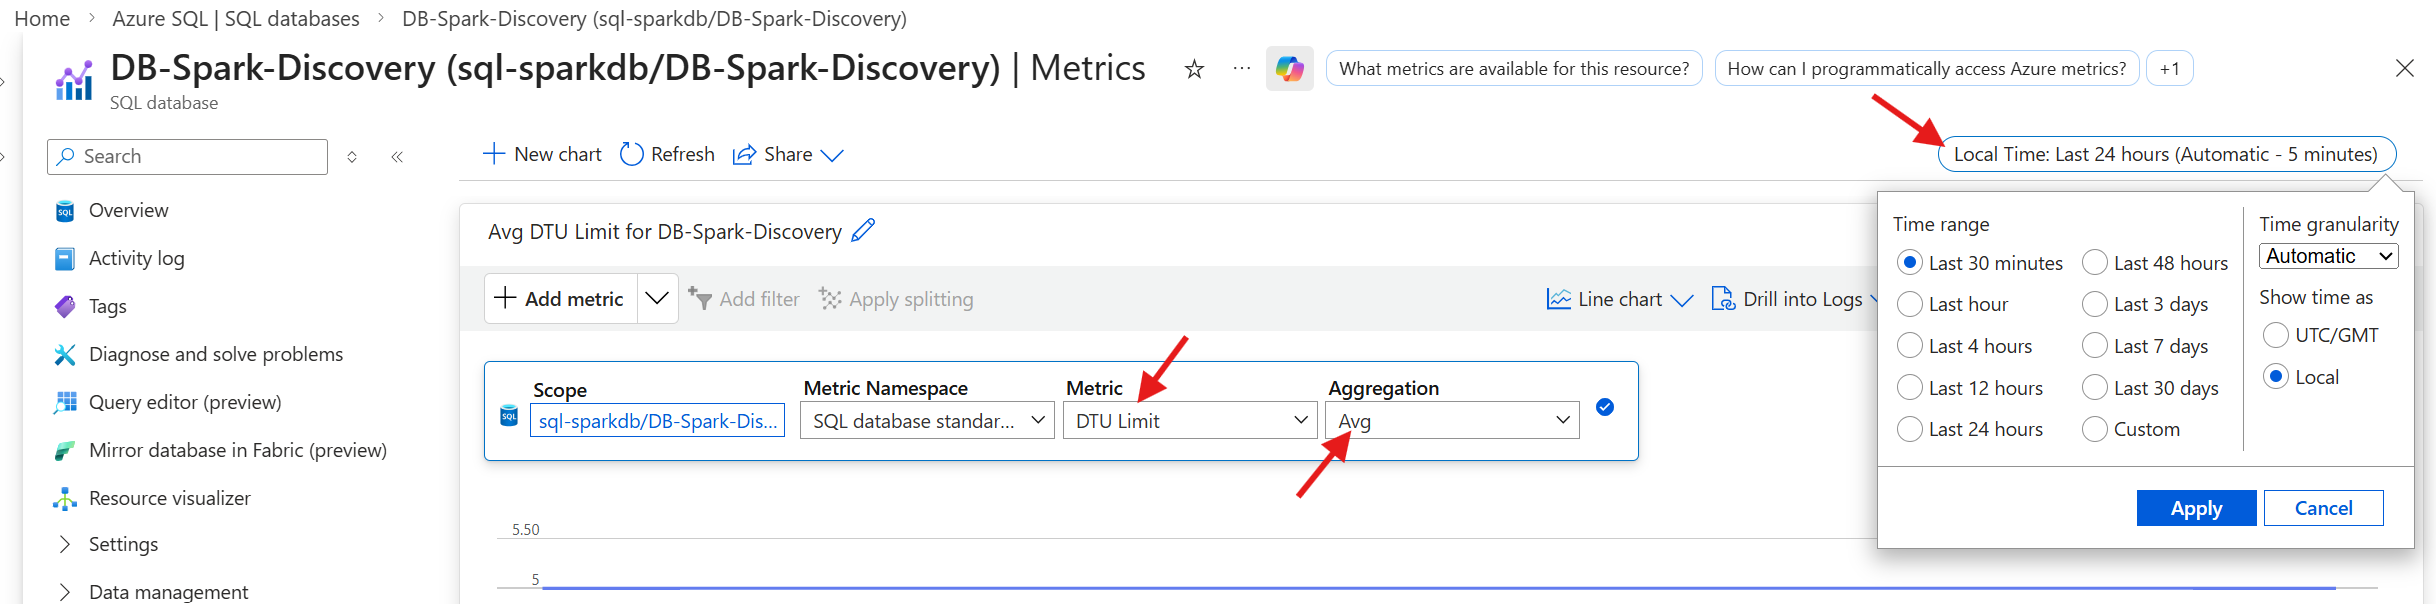
SQL - Access Metrics
To access the SQL metrics, select Metrics under the Monitoring navigation menu.
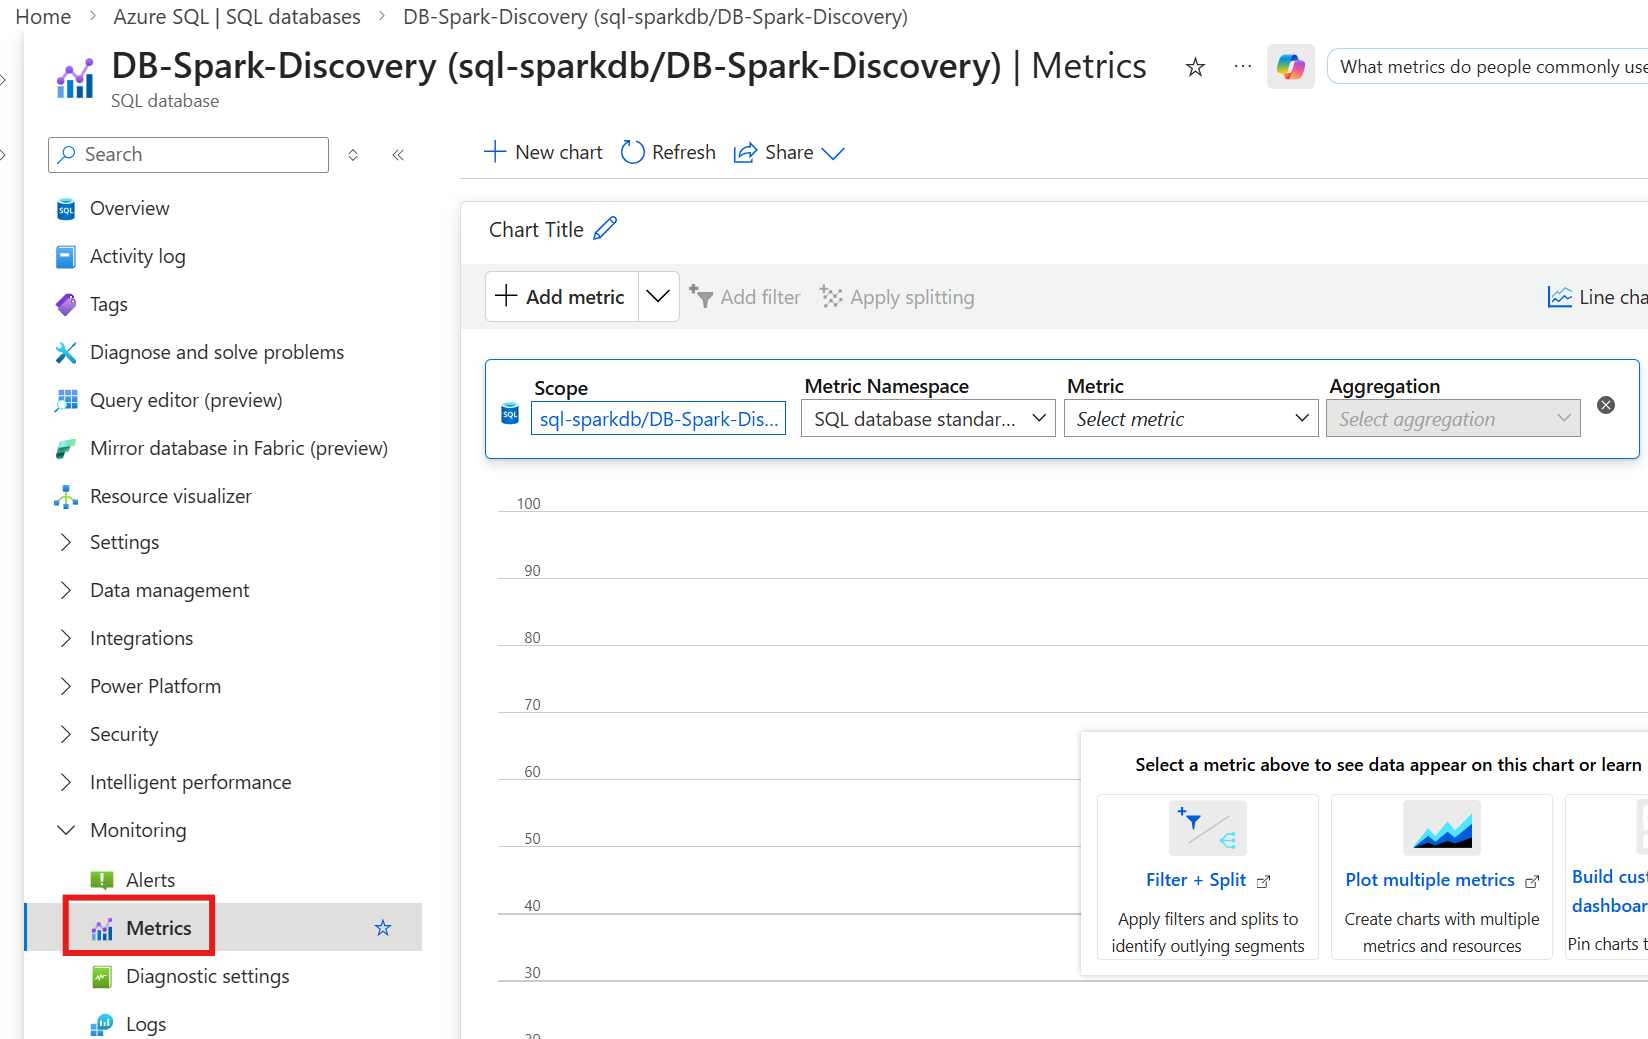
SQL - Monitor DTU
- Metric
- DTU Limit
- Aggregation
- Avg
- Time Range
- Last 30 minutes
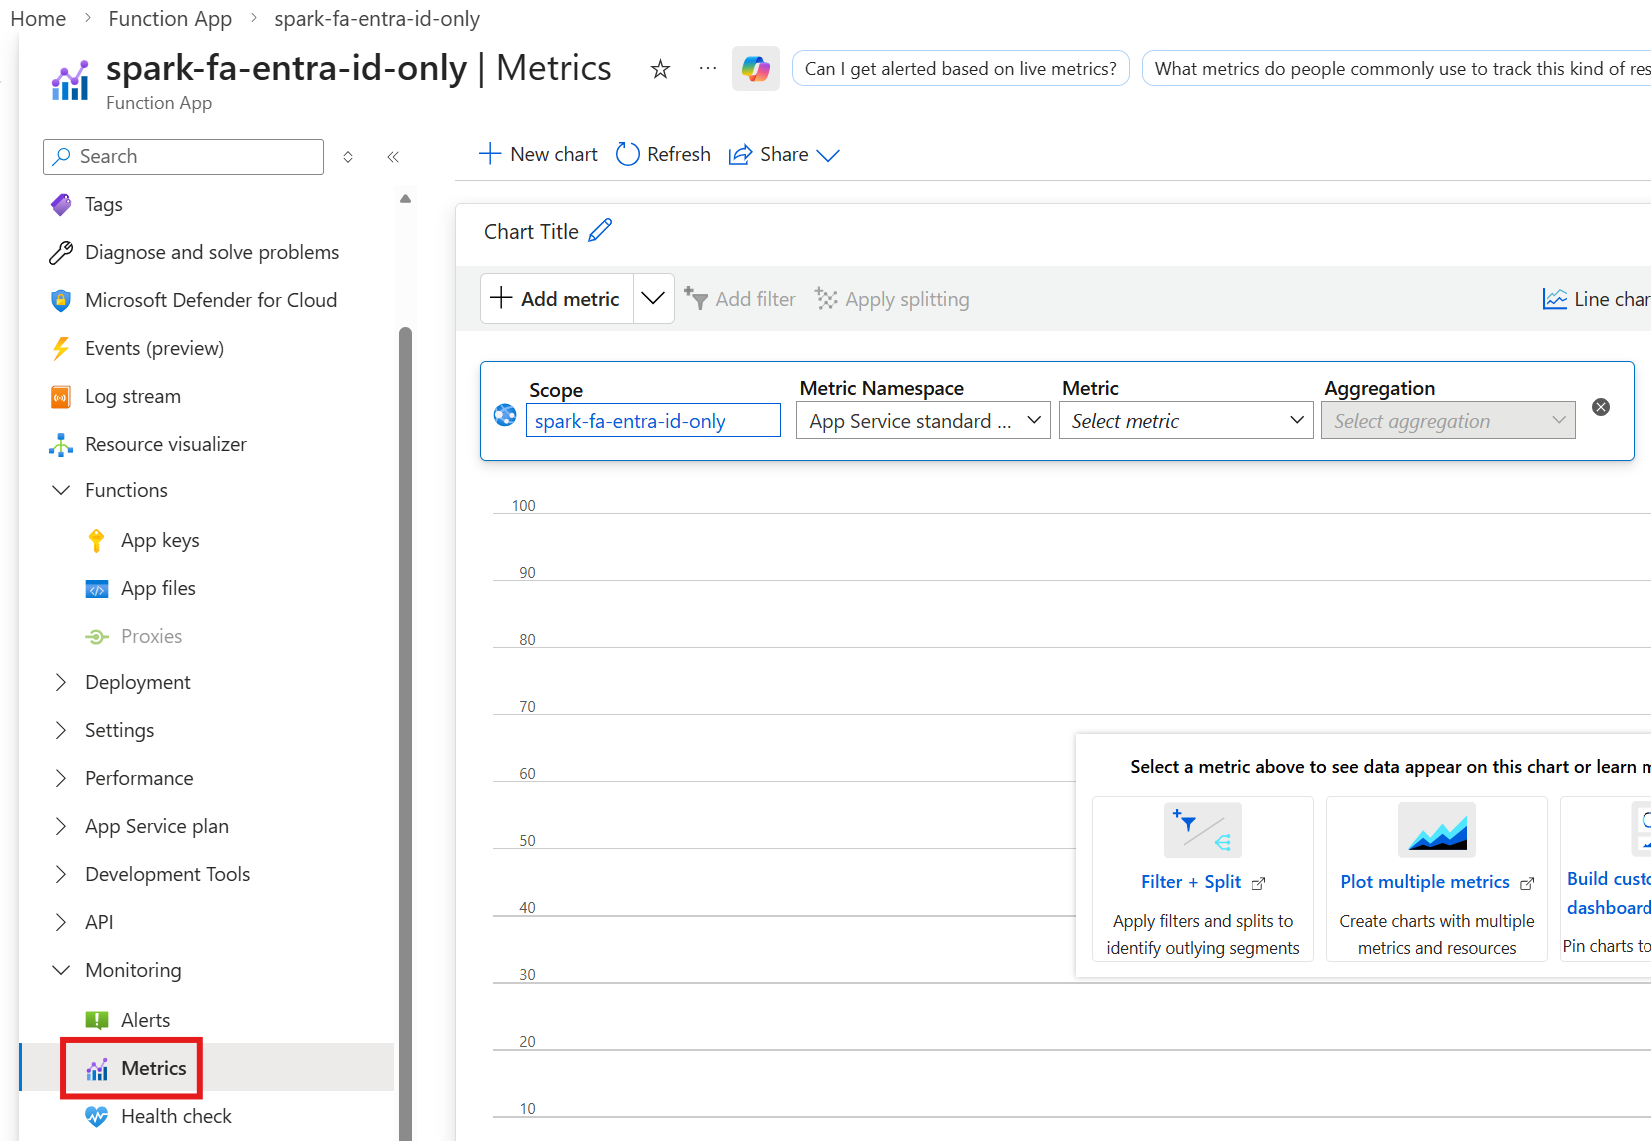
Function Apps - Access Metrics
To access the Function App metrics, select Metrics under the Monitoring navigation menu.
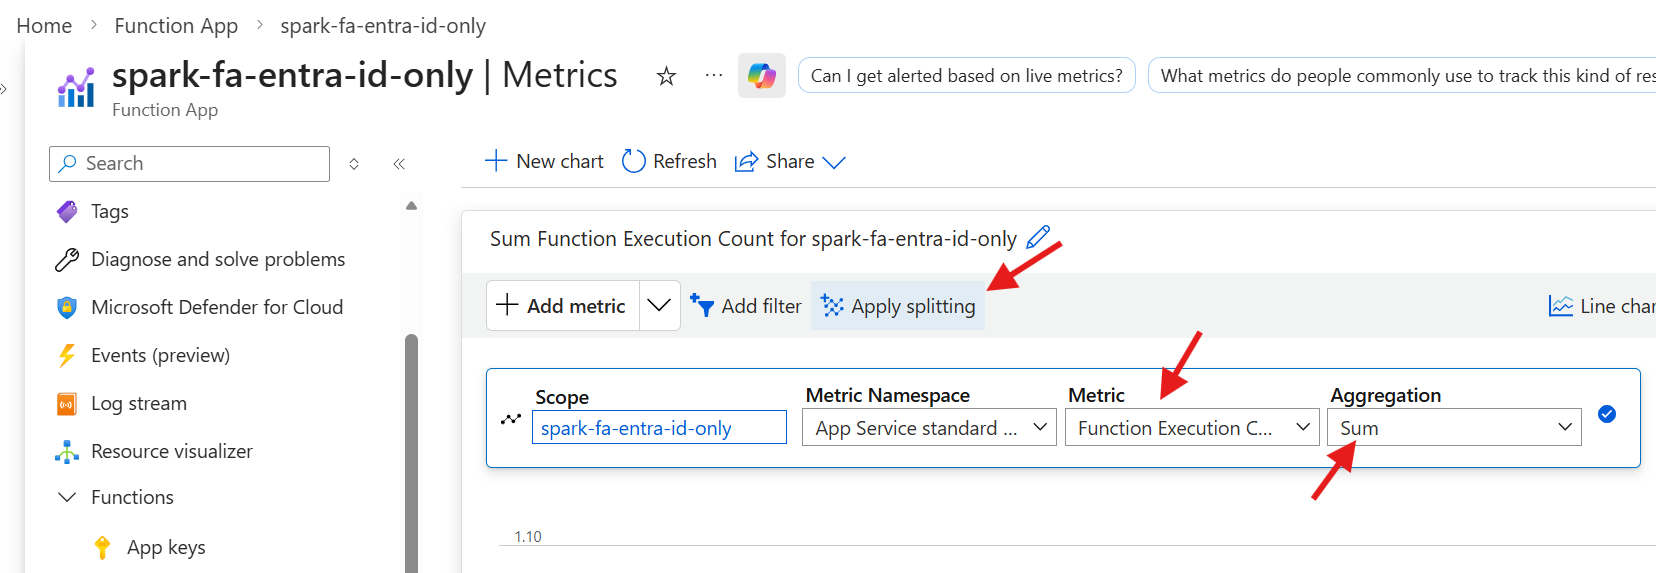
Function Apps - Monitor Execution Count
- Metric
- Function Execution Count
- Aggregation
- Sum
- Split By
- Instance
- Click on `Apply splitting` and select `Instance`
Scale Down
- SQL
- Lower by 1 (P2 -> P1 -> S2)
- Monitor DTU consumption to determine correct tier
- Function App (Instances)
- Lower the # of instances by 3
- Monitor demand and lower them based on load and demand
- Function App (Plan)
- Lower down by 1 (P3V3 -> P2V3 -> P1V3)
- Monitor demand and lower them based on load and demand
As the demand starts to drop, you can begin to scale down the Function App and SQL. It’s important to understand that lowering the Function App instances will cause a higher demand on the other instances. You must let the services settle as you start to scale down.