OpenTelemetry Support in Teams SDK for .NET 2.1 Preview
Teams SDK for .NET 2.1 Preview now emits OpenTelemetry traces, metrics, and correlated logs. Route them to Azure Monitor / Application Insights, a local OTLP collector, or both — the SDK emits the telemetry; your app decides where it goes.
Why This Matters
A single user message can trigger middleware, handler dispatch, token acquisition, outbound Bot Service calls, and downstream service requests. When something goes wrong — or just runs slow — isolated log lines are not enough. You need to see the full turn, end to end.
The Teams SDK now instruments its pipeline through standard .NET primitives — ActivitySource, Meter, and ILogger. This is not proprietary instrumentation — it is the same OpenTelemetry model that the rest of the .NET ecosystem uses. The SDK follows the .NET library instrumentation guidance: libraries produce telemetry; applications choose collection and export.
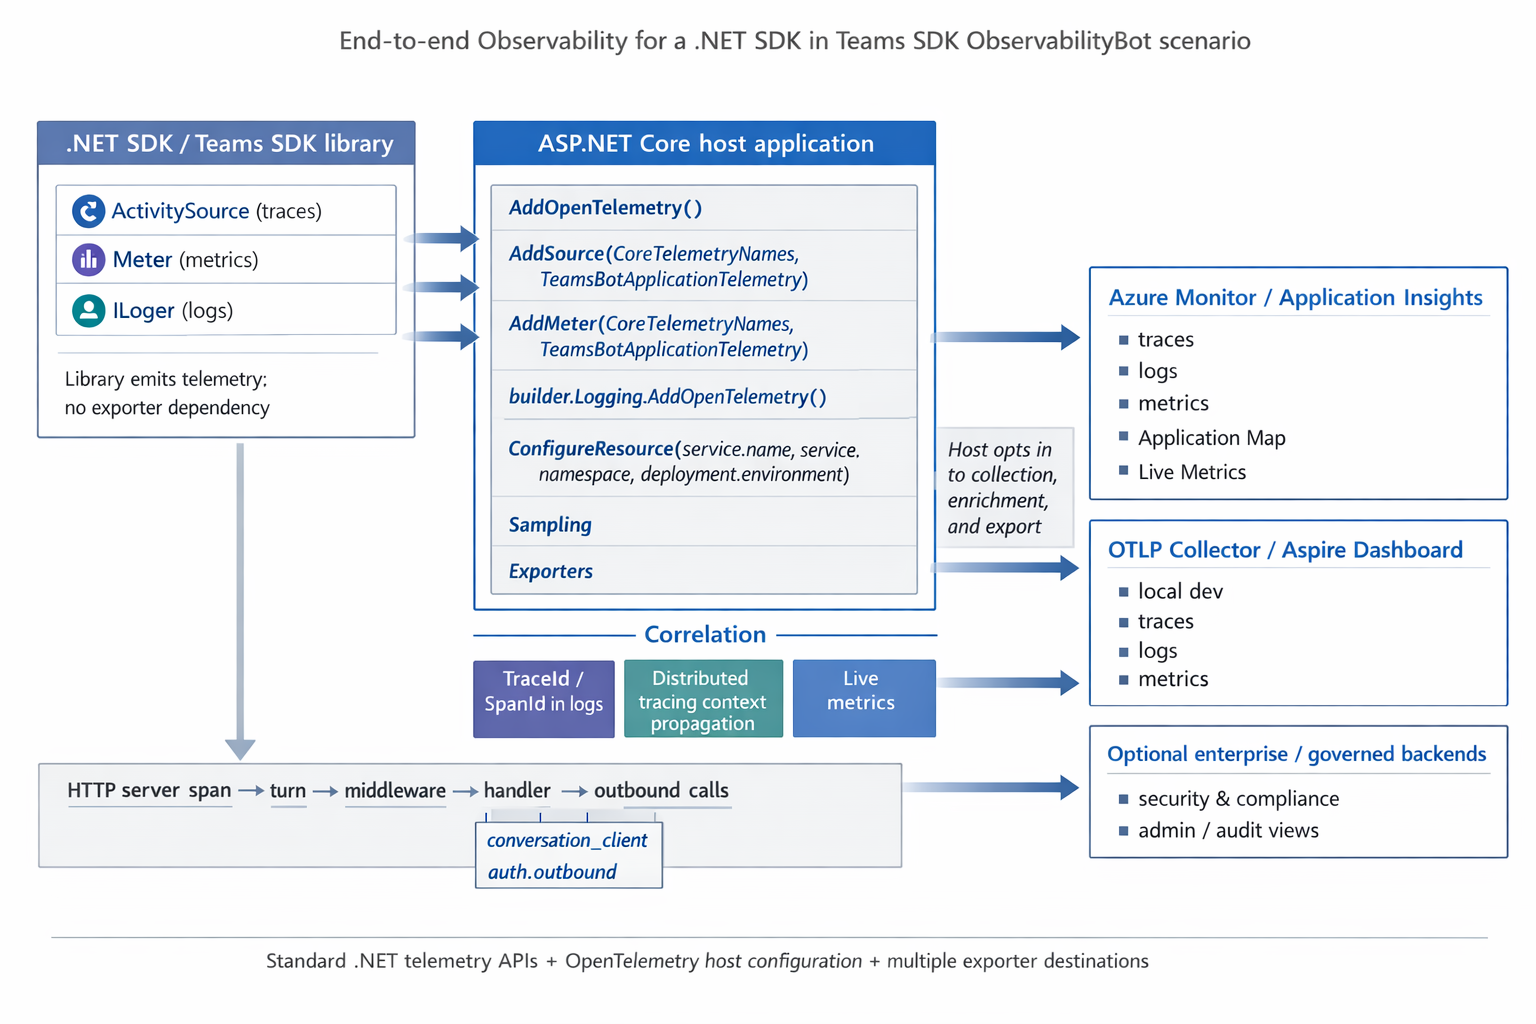
Two Lines of Teams-Specific Code
The only Teams-specific wiring is registering the SDK's ActivitySource and Meter names:
tracing.AddSource(new[] { CoreTelemetryNames.ActivitySourceName,
                          TeamsBotApplicationTelemetry.ActivitySourceName });

metrics.AddMeter(new[] { CoreTelemetryNames.MeterName,
                         TeamsBotApplicationTelemetry.MeterName });
Everything else — ASP.NET Core and HttpClient auto-instrumentation, exporters, logging — is standard OpenTelemetry .NET setup. With .NET Aspire service defaults, your bot's Program.cs stays minimal:
WebApplicationBuilder builder = WebApplication.CreateBuilder(args);
builder.AddServiceDefaults(); // configures OpenTelemetry, health checks, service discovery
builder.Services.AddTeamsBotApplication();
WebApplication app = builder.Build();

TeamsBotApplication bot = app.UseTeamsBotApplication();

bot.OnMessage(async (ctx, ct) =>
{
    string? message = ctx.Activity.TextWithoutMentions;
    await ctx.SendActivityAsync($"Echo: {message}", ct);
});

app.MapDefaultEndpoints();
app.Run();
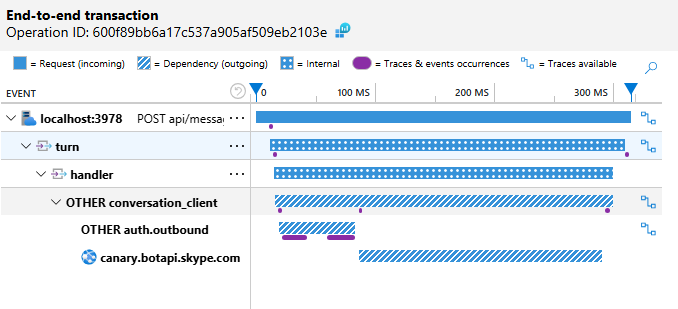
What You See
In Application Insights, you can inspect each turn end-to-end — from the inbound request through middleware, handler dispatch, token acquisition, and outbound Bot Service calls:
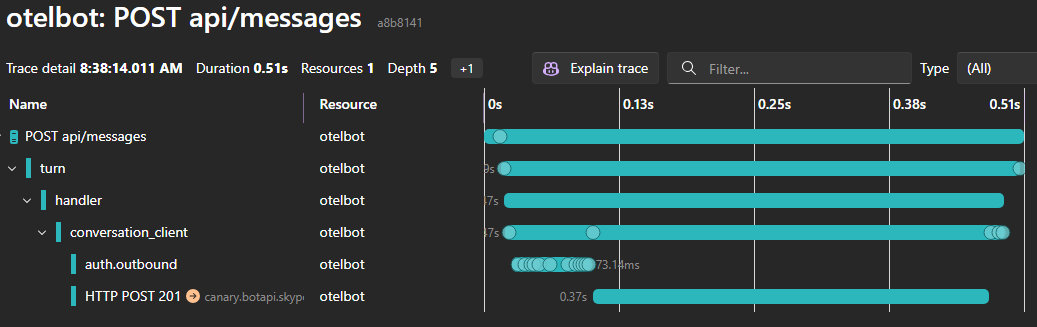
The same telemetry works locally with any OTLP-compatible backend. The sample includes an Aspire AppHost — run it and the dashboard opens automatically:
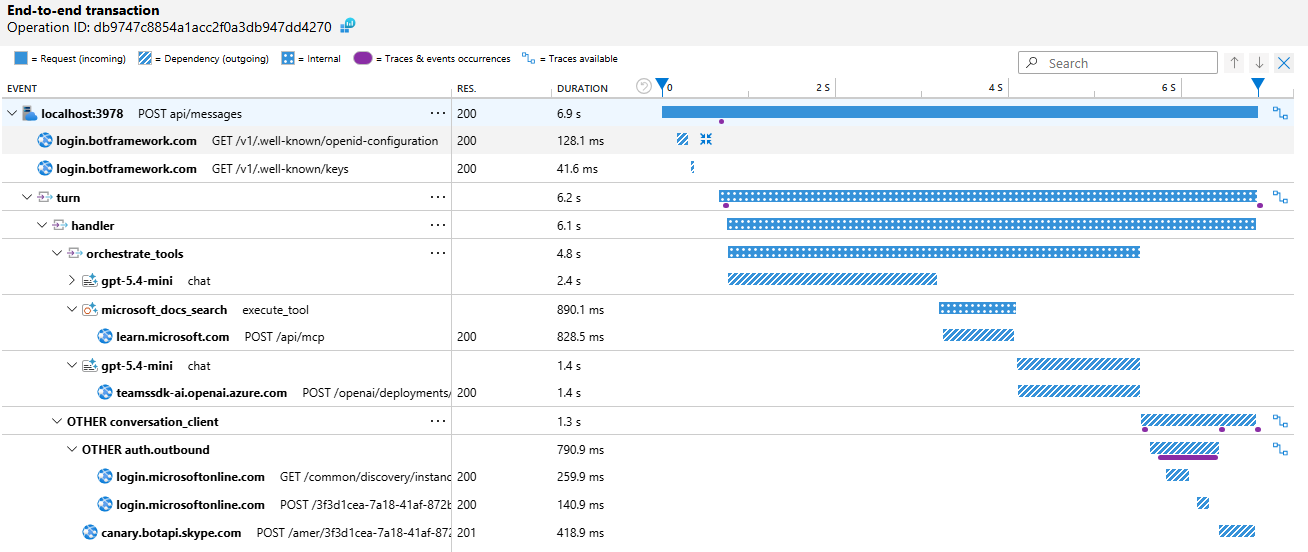
For bots that call AI models through Microsoft.Extensions.AI, you get the full chain — from the inbound message, through chat completions and MCP tool calls, and back out through the Bot Service response:
Try It
Two samples are available to get started:
| Sample | What it shows |
|---|---|
| OTelBotWithAspire | Echo bot with Aspire service defaults and dashboard |
| AIBotWithOTel | AI bot with Azure OpenAI, MCP tools, and full LLM tracing |
For the complete setup guide — including standalone (non-Aspire) configuration, Azure Monitor, Grafana LGTM, resource attributes, metrics reference, and AI instrumentation details — see the OpenTelemetry in-depth guide.
We'd love your feedback on the observability experience. File issues on the GitHub repository.