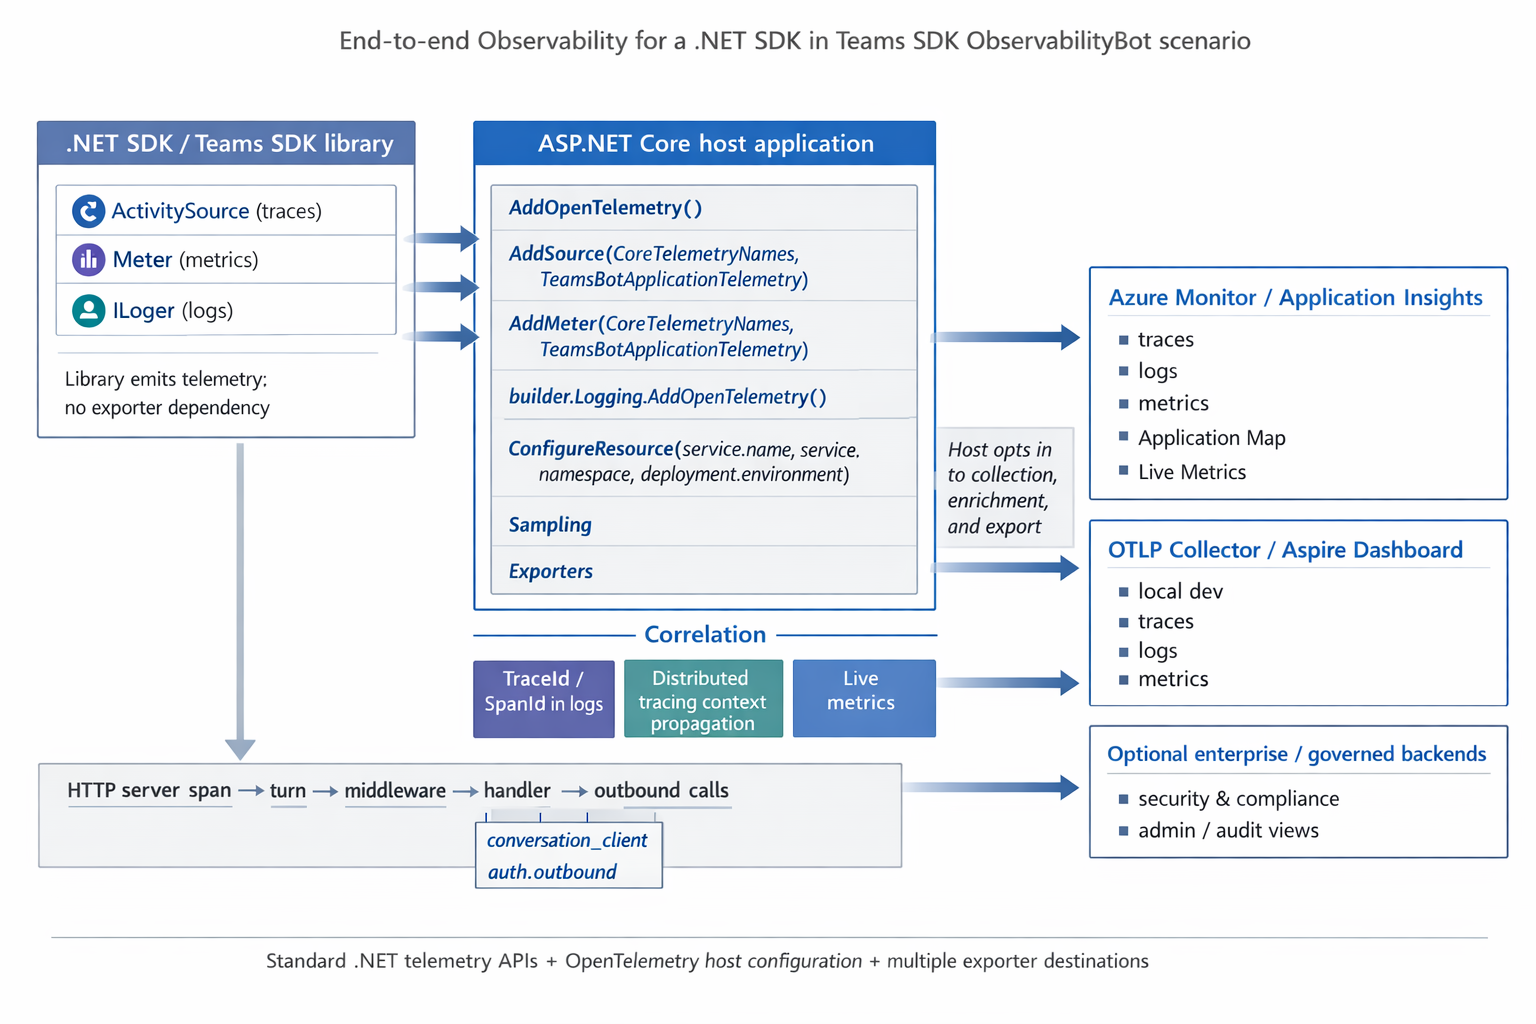
OpenTelemetry
The Teams SDK instruments its pipeline through standard .NET primitives — ActivitySource, Meter, and ILogger. Your host application opts in by registering the SDK's source and meter names, then choosing where to export — Azure Monitor / Application Insights, an OTLP collector, or both.
The SDK follows the .NET library instrumentation model: libraries produce telemetry; applications choose collection and export. The SDK does not automatically send telemetry anywhere — your app controls what is collected and where it goes.
Prerequisites
OpenTelemetry instrumentation is available starting with the 2.1 preview of the Teams SDK for .NET. APIs may change before the stable release.
Install the Teams SDK and OpenTelemetry packages:
dotnet add package Microsoft.Teams.Apps --prerelease
dotnet add package OpenTelemetry.Extensions.Hosting
dotnet add package OpenTelemetry.Instrumentation.Http
dotnet add package OpenTelemetry.Instrumentation.AspNetCore
For Azure Monitor / Application Insights export, also add:
dotnet add package Azure.Monitor.OpenTelemetry.AspNetCore
Or start from the OTelBotWithAspire sample, which includes all dependencies pre-configured through .NET Aspire service defaults.
Setup
Register the Teams SDK's telemetry sources when configuring OpenTelemetry. The key lines are AddSource and AddMeter — everything else is standard OpenTelemetry .NET setup:
using Microsoft.Teams.Apps.Diagnostics;
using Microsoft.Teams.Core.Diagnostics;

builder.Services.AddOpenTelemetry()
    .WithTracing(tracing =>
    {
        tracing.AddAspNetCoreInstrumentation()
            .AddHttpClientInstrumentation();
        tracing.AddSource(new[] { CoreTelemetryNames.ActivitySourceName,   // "Microsoft.Teams.Core"
                                   TeamsBotApplicationTelemetry.ActivitySourceName }); // "Microsoft.Teams.Apps"
    })
    .WithMetrics(metrics =>
    {
        metrics.AddAspNetCoreInstrumentation()
            .AddHttpClientInstrumentation()
            .AddRuntimeInstrumentation();
        metrics.AddMeter(new[] { CoreTelemetryNames.MeterName,
                                 TeamsBotApplicationTelemetry.MeterName });
    });
What the SDK Instruments
The Teams SDK emits spans and metrics from two sources. Auto-instrumented libraries (ASP.NET Core, HttpClient, Azure SDKs) add their own spans as children automatically.
Traces
Every incoming activity flows through a structured span hierarchy:
HTTP server span                       (auto — ASP.NET Core)
└─ turn                                (Microsoft.Teams.Core)
   ├─ middleware [n times]             (Microsoft.Teams.Core)
   ├─ handler                          (Microsoft.Teams.Apps)
   └─ conversation_client              (Microsoft.Teams.Core)
      ├─ auth.outbound                 (Microsoft.Teams.Core)
      │  └─ HTTP client span           (auto — token endpoint)
      └─ HTTP client span              (auto — Bot Service API)
The turn span is enriched with activity type, activity ID, conversation ID, and channel ID.
Metrics
The SDK exposes counters and histograms through two meters:
| Metric | Type | Description |
|---|---|---|
teams.activities.received | Counter | Activities received by the bot |
teams.turn.duration | Histogram (ms) | End-to-end turn processing time |
teams.handler.errors | Counter | Unhandled exceptions in handlers |
teams.middleware.duration | Histogram (ms) | Per-middleware execution time |
teams.outbound.calls | Counter | Outbound Bot Service API calls |
teams.outbound.errors | Counter | Failed outbound calls |
Correlated Logs
Every ILogger record produced inside a turn automatically carries the active TraceId and SpanId. This means you can pivot from a slow trace directly to its log lines — no manual correlation needed.
Enable OpenTelemetry log export so that ILogger output flows to the same backend as your traces and metrics:
builder.Logging.AddOpenTelemetry(logging =>
{
    logging.IncludeFormattedMessage = true;
    logging.IncludeScopes = true;
});
Setting IncludeScopes = true preserves log scopes as custom properties in your backend — useful for filtering by conversation ID, tenant ID, or other contextual values.
Exporting to Azure Monitor
To export to Azure Monitor / Application Insights, set the APPLICATIONINSIGHTS_CONNECTION_STRING environment variable and call UseAzureMonitor():
using Azure.Monitor.OpenTelemetry.AspNetCore;

if (!string.IsNullOrEmpty(builder.Configuration["APPLICATIONINSIGHTS_CONNECTION_STRING"]))
{
    builder.Services.AddOpenTelemetry().UseAzureMonitor();
}
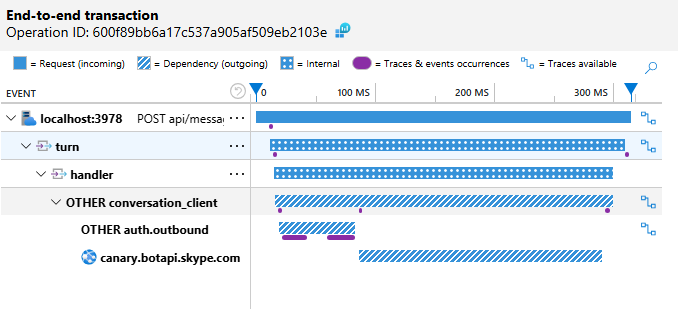
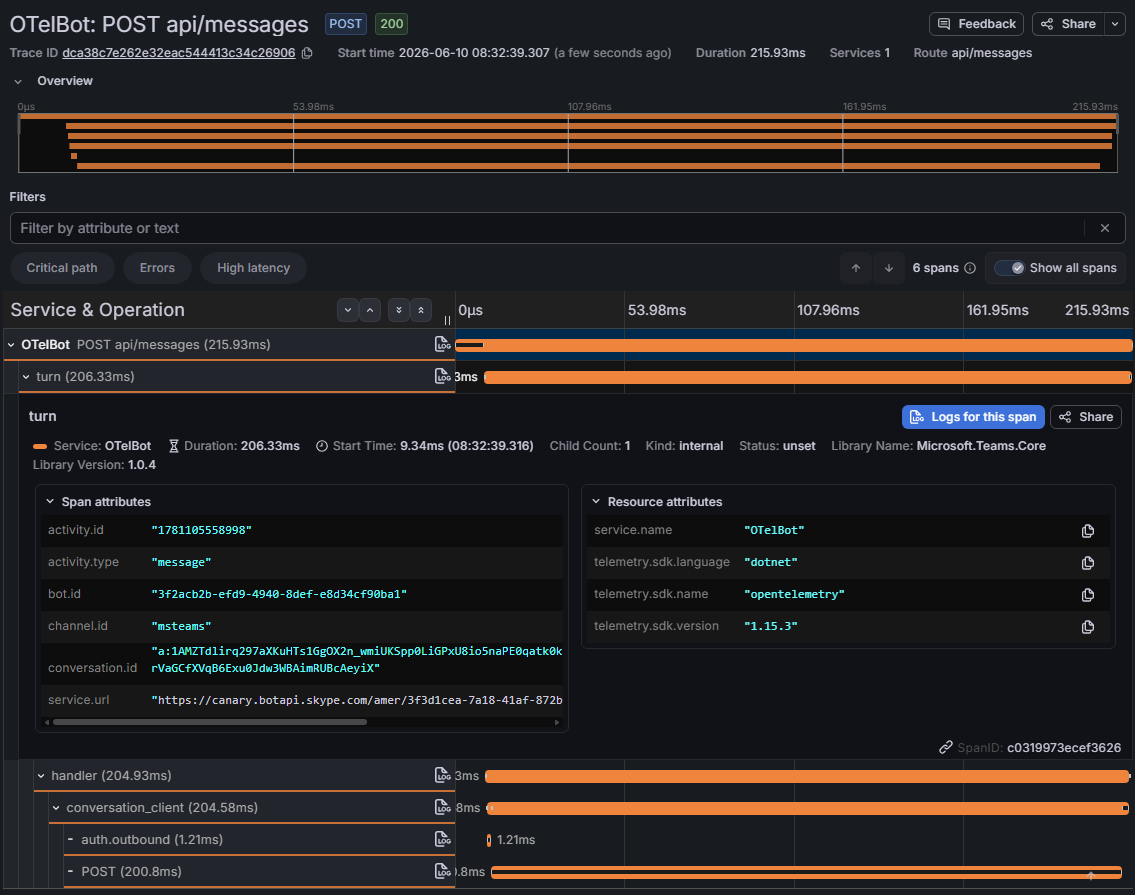
UseAzureMonitor() bundles instrumentation and exporters for traces, metrics, logs, and Live Metrics. In the Application Insights portal, you can inspect each turn end-to-end — from the inbound HTTP request through middleware, handler dispatch, and outbound Bot Service calls — all in a single correlated trace view.
Note: Azure Monitor enables trace-based log sampling by default, keeping logs aligned with trace sampling decisions. Review the sampling configuration for production workloads.
Here is a turn in Application Insights — the span hierarchy from the inbound HTTP request through turn processing, handler dispatch, and outbound Bot Service calls:
Exporting to a Local OTLP Collector
For local development, you can send telemetry to any OTLP-compatible backend without changing your application code — just configure the exporter endpoint.
Aspire Dashboard
The .NET Aspire Dashboard shows traces, metrics, and structured logs in a single standalone UI:
The OTelBotWithAspire sample includes an Aspire AppHost that orchestrates the bot and automatically provides the dashboard. Run the AppHost project and the dashboard opens at http://localhost:18888:
// OTelBotWithAspire.AppHost/AppHost.cs
IDistributedApplicationBuilder builder = DistributedApplication.CreateBuilder(args);
builder.AddProject<Projects.OTelBot>("otelbot");
builder.Build().Run();
Alternatively, run the standalone Aspire Dashboard as a Docker container:
docker run --rm -d --name aspire-dashboard \
  -p 18888:18888 -p 4317:18889 \
  mcr.microsoft.com/dotnet/aspire-dashboard:latest

export OTEL_EXPORTER_OTLP_ENDPOINT=http://localhost:4317
export OTEL_SERVICE_NAME=my-teams-bot

dotnet run
Grafana LGTM
Grafana LGTM bundles Tempo (traces), Mimir (metrics), Loki (logs), and Grafana in a single container:
docker run --rm -d --name lgtm \
  -p 3000:3000 -p 4317:4317 -p 4318:4318 \
  grafana/otel-lgtm

export OTEL_EXPORTER_OTLP_ENDPOINT=http://localhost:4317
export OTEL_SERVICE_NAME=my-teams-bot

dotnet run
Open http://localhost:3000 (default credentials: admin / admin) to explore Tempo for traces, Mimir for metrics, and Loki for logs.
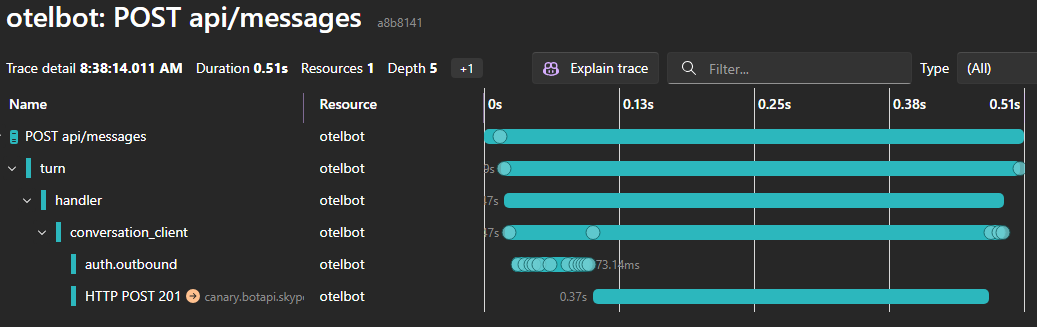
Here is the same turn in Grafana Tempo — the span waterfall with span attributes showing activity.type, activity.id, conversation.id, channel.id, and the Microsoft.Teams.Core library name:
AI and LLM Instrumentation
If your bot calls AI models through Microsoft.Extensions.AI, you can add OpenTelemetry instrumentation to capture LLM spans (chat completions, token usage) and tool-call spans (MCP or function invocation) as part of the same trace. These spans appear as children of the bot's handler span, giving you end-to-end visibility from the inbound Teams message through AI model calls and back.
Step 1: Add the OpenTelemetry middleware to the chat client
When building the IChatClient pipeline, call .UseOpenTelemetry() to emit spans for each chat completion and tool invocation:
using Azure.AI.OpenAI;
using Microsoft.Extensions.AI;

IChatClient innerClient = new AzureOpenAIClient(new Uri(endpoint), new Azure.AzureKeyCredential(key))
    .GetChatClient(deployment)
    .AsIChatClient();

IChatClient chatClient = innerClient
    .AsBuilder()
    .UseFunctionInvocation()
    .UseOpenTelemetry(sourceName: "Experimental.Microsoft.Extensions.AI")
    .Build();
The sourceName parameter determines the ActivitySource name used for the emitted spans. If you use Model Context Protocol (MCP) tools, the MCP client also emits its own spans under the "ModelContextProtocol" source.
Step 2: Register the AI source and meter names
Add the AI and MCP source/meter names alongside the Teams SDK ones in your OpenTelemetry configuration:
builder.Services.AddOpenTelemetry()
    .WithTracing(tracing =>
    {
        // Teams SDK sources
        tracing.AddSource(new[] { CoreTelemetryNames.ActivitySourceName,
                                  TeamsBotApplicationTelemetry.ActivitySourceName });
        // AI / MCP sources
        tracing.AddSource(new[] { "Experimental.Microsoft.Extensions.AI",
                                  "ModelContextProtocol" });
    })
    .WithMetrics(metrics =>
    {
        // Teams SDK meters
        metrics.AddMeter(new[] { CoreTelemetryNames.MeterName,
                                 TeamsBotApplicationTelemetry.MeterName });
        // AI / MCP meters
        metrics.AddMeter(new[] { "Experimental.Microsoft.Extensions.AI",
                                 "ModelContextProtocol" });
    });
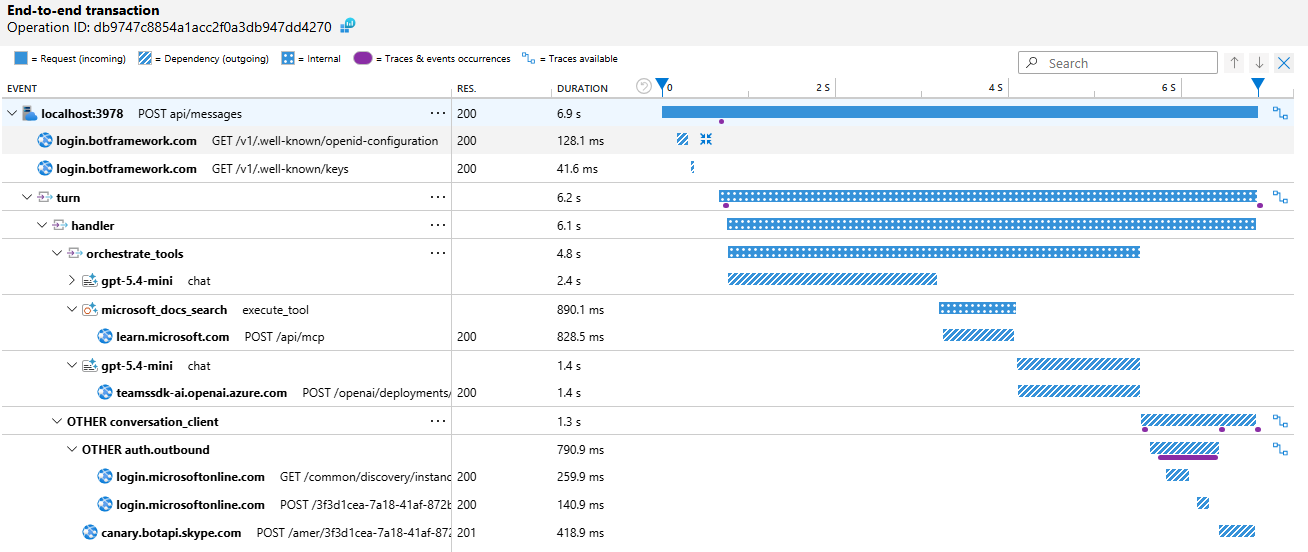
With both steps in place, your traces show the full chain — from the inbound Teams message, through turn and handler processing, into AI model chat completions and tool calls, and back out through the Bot Service response:
For a complete working example, see the AIBotWithOTel sample.
Resource Configuration
Resource attributes identify your service in the backend. At a minimum, set service.name so your bot is distinguishable in Application Map and trace views:
builder.Services.AddOpenTelemetry()
    .ConfigureResource(r => r
        .AddService(
            serviceName: "my-teams-bot",
            serviceVersion: "1.0.0",
            serviceNamespace: "Contoso.Agents"));
For production, also consider setting deployment.environment so you can filter between staging and production:
builder.Services.AddOpenTelemetry()
    .ConfigureResource(r => r
        .AddService(serviceName: "my-teams-bot", serviceVersion: "1.0.0")
        .AddAttributes(new Dictionary<string, object>
        {
            ["deployment.environment"] = builder.Environment.EnvironmentName,
            ["service.namespace"] = "Contoso.Agents",
        }));
If multiple bots share the same Application Insights resource, service.name and service.namespace are what separate them in the Application Map.
Note: When using .NET Aspire, the AppHost automatically sets
service.namefrom the project name passed toAddProject<T>("name"), so you typically don't need to configure it manually.
Full Example with Aspire
The OTelBotWithAspire sample is a ready-to-run Aspire solution with three projects:
| Project | Purpose |
|---|---|
OTelBot | The Teams bot — Program.cs is 18 lines |
OTelBotWithAspire.ServiceDefaults | OpenTelemetry, health checks, and service discovery |
OTelBotWithAspire.AppHost | Aspire orchestrator that launches the bot with the dashboard |
The bot's Program.cs stays minimal because all observability is configured in service defaults:
using Microsoft.Teams.Apps;

WebApplicationBuilder builder = WebApplication.CreateBuilder(args);
builder.AddServiceDefaults();
builder.Services.AddTeamsBotApplication();
WebApplication app = builder.Build();

TeamsBotApplication bot = app.UseTeamsBotApplication();

bot.OnMessage(async (ctx, ct) =>
{
    string? message = ctx.Activity.TextWithoutMentions;
    await ctx.SendActivityAsync($"Echo: {message}", ct);
});

app.MapDefaultEndpoints();
app.Run();
AddServiceDefaults() configures OpenTelemetry (traces, metrics, logs), health checks, service discovery, and resilience — all through the standard .NET Aspire service defaults pattern. The service defaults register the Teams SDK's ActivitySource and Meter names, and conditionally enable OTLP and Azure Monitor exporters based on environment variables.
Full Example (Standalone)
If you are not using .NET Aspire, here is a standalone Program.cs that wires up a Teams bot with OpenTelemetry tracing, metrics, and logs — exporting to OTLP and optionally to Azure Monitor:
using Azure.Monitor.OpenTelemetry.AspNetCore;
using Microsoft.Teams.Apps;
using Microsoft.Teams.Apps.Diagnostics;
using Microsoft.Teams.Core.Diagnostics;
using OpenTelemetry.Resources;

WebApplicationBuilder builder = WebApplication.CreateBuilder(args);

builder.Services.AddTeamsBotApplication();

// --- OpenTelemetry ---
var otel = builder.Services.AddOpenTelemetry()
    .ConfigureResource(r => r
        .AddService(serviceName: "my-teams-bot", serviceVersion: "1.0.0")
        .AddAttributes(new Dictionary<string, object>
        {
            ["deployment.environment"] = builder.Environment.EnvironmentName,
        }));

// Azure Monitor (requires APPLICATIONINSIGHTS_CONNECTION_STRING env var)
if (!string.IsNullOrEmpty(builder.Configuration["APPLICATIONINSIGHTS_CONNECTION_STRING"]))
{
    otel.UseAzureMonitor();
}

// Traces: Teams SDK sources + auto-instrumentation + OTLP export
otel.WithTracing(tracing =>
{
    tracing.AddAspNetCoreInstrumentation()
        .AddHttpClientInstrumentation();
    tracing.AddSource(new[] { CoreTelemetryNames.ActivitySourceName,
                              TeamsBotApplicationTelemetry.ActivitySourceName });
    tracing.AddOtlpExporter();
});

// Metrics: Teams SDK meters + auto-instrumentation + OTLP export
otel.WithMetrics(metrics =>
{
    metrics.AddAspNetCoreInstrumentation()
        .AddHttpClientInstrumentation()
        .AddRuntimeInstrumentation();
    metrics.AddMeter(new[] { CoreTelemetryNames.MeterName,
                             TeamsBotApplicationTelemetry.MeterName });
    metrics.AddOtlpExporter();
});

// Logs: correlated to active traces
builder.Logging.AddOpenTelemetry(logging =>
{
    logging.IncludeFormattedMessage = true;
    logging.IncludeScopes = true;
});

// --- App ---
WebApplication app = builder.Build();

TeamsBotApplication bot = app.UseTeamsBotApplication();

bot.OnMessage(async (ctx, ct) =>
{
    string? message = ctx.Activity.TextWithoutMentions;
    await ctx.SendActivityAsync($"Echo: {message}", ct);
});

app.Run();
Run with a local OTLP collector (Aspire Dashboard or Grafana LGTM) to see traces, metrics, and correlated logs for every turn. Set APPLICATIONINSIGHTS_CONNECTION_STRING to additionally export to Azure Monitor.
Next Steps
- OTelBotWithAspire sample — ready-to-run Aspire solution with the Aspire Dashboard
- .NET observability with OpenTelemetry — conceptual overview of the three pillars
- Configure Azure Monitor OpenTelemetry — sampling, resource attributes, and advanced configuration
- OpenTelemetry .NET documentation — upstream reference