Performance Efficiency review
“The application is slow … sometimes”
                              A user
Application performance is tricky but also the most interesting part of Well Architected Review.
How a user perceives your performance is as important, or perhaps more important, than any objective statistic, but it’s subjective, and not as readily measurable. Perceived performance is user perspective, not a metric.
Capture as much data (raw performances) but always include end-users.

Try to answer to these questions:
- Can you provide a solution that scales to meet the public demand?
- How would this solution change in an PaaS architecture?
- How can you improve the performance visibility and alerting? Are all the tiers covered?
- Is there a more proactive approach?
- Is the architecture properly sized? Consider cost analysis to determine how much you can improve.
Level 1 - Sizing, Networking and Scaling
The first thing to check are the raw performances of your application: virtual machine sizing, IOPS, CPU, Memory, Response time and Resource hogging. There are several tools to gather this information.
- For VMs, you can use Azure Monitor, or use the Performance diagnostics tool in the Azure portal.
- In the case of web applications you have Application Insights.
- When your application is deployed into containers you can use [Container insights][containersinsights].
Network performance is also something that can be critical to your application. It is important to ensure that you have the proper network bandwith, that the latency is acceptable, and that the network is not oversubscribed. You can monitor the network performance with Azure Monitor too with the Network insights.
Review the network paths and boundaries, and the use of a CDN and compression to enhance network performance.
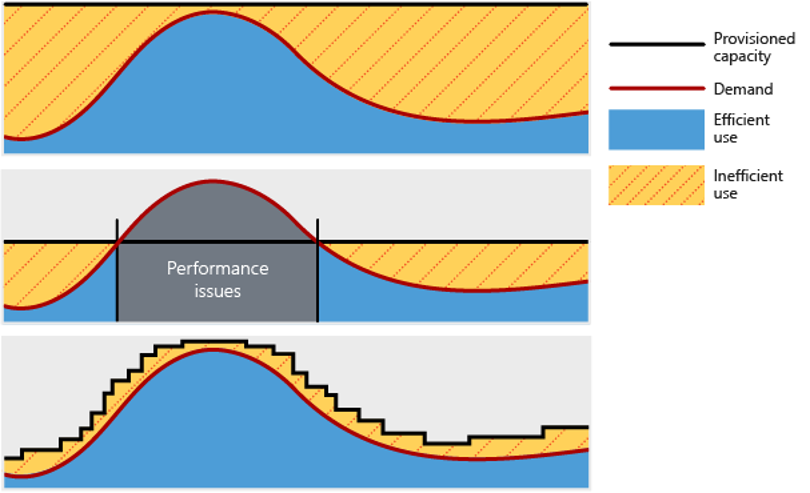
Ensure that the application can scale out instead of scaling up and evaluate the multi-geo deployment and the needed changes for scaling as independent units.
Improving the performance of your application can have a cost impact that you will need to calculate.
Level 2 - Backing services, Application Design
On a secondary level, check out the backing services performance. The databases can also be monitored with several tools like the Query Performance Insight, Cosmos DB insights, etc. Analyze the slow queries and evaluate the need to create read replicas for high demanding tasks like reporting.
Check that the consistency requirements are in line with the business needs, as relaxing them can improve performance. Ensure that the application is caching data when possible and that the data is correctly indexed.
Review the application design for queuing, async processing, and background tasks are used when needed. Find out where chatty interactions happen between components and services.
Level 3 - Data sharing
Avoid the use of client affinity, check the partitioning and sharding and evaluate the use of a Shared-nothing architecture.
Resources
Checkpoint
- Performance bottlenecks identified.
- IaaS vs PaaS evaluation.
- Cost calculations for improving performance.
Now you can move to the next pillar: Operations