Predictions for HRES at 0.1 Degrees#
In this example, we will download IFS HRES analysis data at 0.1 degrees resolution for 11 May 2022 from the Research Data Archive and run Aurora on this data. We will use the version of Aurora that was fine-tuned on IFS HRES analysis at 0.1 degrees resolution.
Running this notebook requires additional Python packages. You can install these as follows:
pip install requests cfgrib matplotlib
Downloading the Data#
To start, we download the data from Research Data Archive.
from datetime import datetime
from pathlib import Path

import requests
import xarray as xr

# Data will be downloaded here.
download_path = Path("~/downloads/hres_0.1").expanduser()

# Day to download. This will download all times for that day.
date = datetime(2022, 5, 11)

# Each variable has a number associated with it. This is the number that will be used in
# the RDA request.
var_nums = {
    "2t": "167",  # 2m temperature
    "10u": "165",  # 10m u-component of wind
    "10v": "166",  # 10m v-component of wind
    "msl": "151",  # Mean sea level pressure
    "t": "130",  # Temperature
    "u": "131",  # u-component of wind (atmospheric)
    "v": "132",  # v-component of wind (atmospheric)
    "q": "133",  # Specific humidity (atmospheric)
    "z": "129",  # Geopotential
    "slt": "043",  # Soil type
    "lsm": "172",  # Land-sea mask
}

# Construct the URLs to download the data from.
downloads: dict[Path, str] = {}
for v in ["2t", "10u", "10v", "msl", "z", "slt", "lsm"]:
    downloads[download_path / date.strftime(f"surf_{v}_%Y-%m-%d.grib")] = (
        f"https://data.rda.ucar.edu/d113001/"
        f"ec.oper.an.sfc/{date.year}{date.month:02d}/ec.oper.an.sfc.128_{var_nums[v]}_{v}."
        f"regn1280sc.{date.year}{date.month:02d}{date.day:02d}.grb"
    )
for v in ["z", "t", "u", "v", "q"]:
    for hour in [0, 6, 12, 18]:
        prefix = "uv" if v in {"u", "v"} else "sc"
        downloads[download_path / date.strftime(f"atmos_{v}_%Y-%m-%d_{hour:02d}.grib")] = (
            f"https://data.rda.ucar.edu/d113001/"
            f"ec.oper.an.pl/{date.year}{date.month:02d}/ec.oper.an.pl.128_{var_nums[v]}_{v}."
            f"regn1280{prefix}.{date.year}{date.month:02d}{date.day:02d}{hour:02d}.grb"
        )

# Perform the downloads.
for target, source in downloads.items():
    if not target.exists():
        print(f"Downloading {source}")
        target.parent.mkdir(parents=True, exist_ok=True)
        response = requests.get(source)
        response.raise_for_status()
        with open(target, "wb") as f:
            f.write(response.content)
print("Downloads finished!")
Downloads finished!
Downloading the Static Variables#
For this model, we also need to include the correct static variables. We have made these available on HuggingFace. You can also use the static variables directly from RDA, but this requires adjustment of the normalisation statistics. See below.
from huggingface_hub import hf_hub_download

# Download the static variables from HuggingFace.
static_path = hf_hub_download(
    repo_id="microsoft/aurora",
    filename="aurora-0.1-static.pickle",
)
print("Static variables downloaded!")
Static variables downloaded!
Preparing a Batch#
We convert the downloaded data to an aurora.Batch, which is what the model requires.
import numpy as np
import torch

from aurora import Batch, Metadata

# Load these pressure levels.
levels = (1000, 925, 850, 700, 600, 500, 400, 300, 250, 200, 150, 100, 50)


def load_surf(v: str, v_in_file: str) -> torch.Tensor:
    """Load the downloaded surface-level or static variable `v` for hours 00 and 06."""
    ds = xr.open_dataset(download_path / date.strftime(f"surf_{v}_%Y-%m-%d.grib"), engine="cfgrib")
    data = ds[v_in_file].values[:2]  # Use hours 00 and 06.
    data = data[None]  # Insert a batch dimension.
    return torch.from_numpy(data)


def load_atmos(v: str) -> torch.Tensor:
    """Load the downloaded atmospheric variable `v` for hours 00 and 06."""
    ds_00 = xr.open_dataset(
        download_path / date.strftime(f"atmos_{v}_%Y-%m-%d_00.grib"), engine="cfgrib"
    )
    ds_06 = xr.open_dataset(
        download_path / date.strftime(f"atmos_{v}_%Y-%m-%d_06.grib"), engine="cfgrib"
    )
    # Select the right pressure levels.
    ds_00 = ds_00[v].sel(isobaricInhPa=list(levels))
    ds_06 = ds_06[v].sel(isobaricInhPa=list(levels))
    data = np.stack((ds_00.values, ds_06.values), axis=0)
    data = data[None]  # Insert a batch dimension.
    return torch.from_numpy(data)


# Extract the latitude and longitude from an arbitrary downloaded file.
ds = xr.open_dataset(next(iter(downloads.keys())), engine="cfgrib")

batch = Batch(
    surf_vars={
        "2t": load_surf("2t", "t2m"),
        "10u": load_surf("10u", "u10"),
        "10v": load_surf("10v", "v10"),
        "msl": load_surf("msl", "msl"),
    },
    # Set the static variables _after_ regridding. The static variables
    # downloaded from HuggingFace are already at the right resolution.
    static_vars={},
    atmos_vars={
        "t": load_atmos("t"),
        "u": load_atmos("u"),
        "v": load_atmos("v"),
        "q": load_atmos("q"),
        "z": load_atmos("z"),
    },
    metadata=Metadata(
        lat=torch.from_numpy(ds.latitude.values),
        lon=torch.from_numpy(ds.longitude.values),
        time=(date.replace(hour=6),),
        atmos_levels=levels,
    ),
)
import pickle

# Regrid the batch to 0.1 degrees resolution. Note that this is a convenience function
# which is not optimised for speed or accuracy. Use at your own risk!
batch = batch.regrid(res=0.1)

# Load the static variables.
with open(static_path, "rb") as f:
    static_vars = pickle.load(f)
batch.static_vars = {k: torch.from_numpy(v) for k, v in static_vars.items()}
Loading and Running the Model#
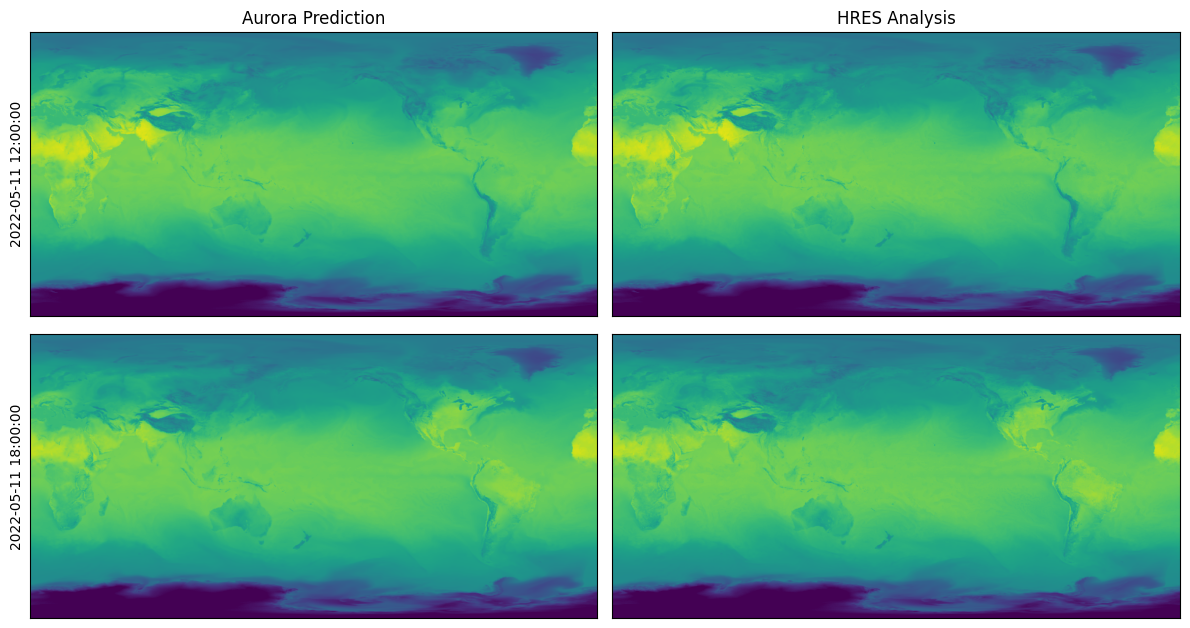
Finally, we are ready to load and run the model and visualise the predictions. We perform a roll-out for two steps, which produces predictions for hours 12:00 and 18:00.
The model can be run locally, or run on Azure AI Foundry. To run on Foundry, the environment variables FOUNDRY_ENDPOINT, FOUNDRY_TOKEN, and BLOB_URL_WITH_SAS need to be set. If you’re unsure on how to set environment variables, see here.
# Set to `False` to run locally and to `True` to run on Foundry.
run_on_foundry = False
if not run_on_foundry:
    from aurora import AuroraHighRes, rollout

    model = AuroraHighRes(
        # If did not use the static variables from HuggingFace, but manually downloaded
        # and regridded them, you'll need to use appropriate normalisation statistics.
        # See model description of the high-resolution model in the documentation.
        # surf_stats={"z": (-3.270407e03, 6.540335e04)},
    )
    model.load_checkpoint("microsoft/aurora", "aurora-0.1-finetuned.ckpt")

    model.eval()
    model = model.to("cuda")

    with torch.inference_mode():
        preds = [pred.to("cpu") for pred in rollout(model, batch, steps=2)]

    model = model.to("cpu")
if run_on_foundry:
    import logging
    import os
    import warnings

    from aurora.foundry import BlobStorageChannel, FoundryClient, submit

    # In this demo, we silence all warnings.
    warnings.filterwarnings("ignore")

    # But we do want to show what's happening under the hood!
    logging.basicConfig(level=logging.WARNING, format="%(asctime)s [%(levelname)s] %(message)s")
    logging.getLogger("aurora").setLevel(logging.INFO)

    foundry_client = FoundryClient(
        endpoint=os.environ["FOUNDRY_ENDPOINT"],
        token=os.environ["FOUNDRY_TOKEN"],
    )
    channel = BlobStorageChannel(os.environ["BLOB_URL_WITH_SAS"])

    predictions = list(
        submit(
            batch,
            model_name="aurora-0.1-finetuned",
            num_steps=2,
            foundry_client=foundry_client,
            channel=channel,
        )
    )
import matplotlib.pyplot as plt

truth = xr.open_dataset(download_path / date.strftime("surf_2t_%Y-%m-%d.grib"), engine="cfgrib")

fig, ax = plt.subplots(2, 2, figsize=(12, 6.5))

for i in range(ax.shape[0]):
    pred = preds[i]

    ax[i, 0].imshow(pred.surf_vars["2t"][0, 0].numpy() - 273.15, vmin=-50, vmax=50)
    ax[i, 0].set_ylabel(str(pred.metadata.time[0]))
    if i == 0:
        ax[i, 0].set_title("Aurora Prediction")
    ax[i, 0].set_xticks([])
    ax[i, 0].set_yticks([])

    ref = truth["t2m"][2 + i].values
    ax[i, 1].imshow(ref - 273.15, vmin=-50, vmax=50)
    if i == 0:
        ax[i, 1].set_title("HRES Analysis")
    ax[i, 1].set_xticks([])
    ax[i, 1].set_yticks([])

plt.tight_layout()