Architecture
The process of creating a chart is similar to that of compiling executable programs from source code. In compilation, there are two distinct phases: frontend and backend. These compilation phases use a generic representation known as an Abstract Syntax Tree (AST) to communicate the structural representation of the source code. The frontend turns source code into this abstract representation, and the backend turns this abstract representation into executable software.
The charting process is very similar. In charting, our notion of an AST comes from a Scenegraph specification based on Vega. Vega's scenegraph is a plain JavaScript object that is the result of binding a charting specification to user data. The scenegraph is then handled by rendering components to emit charts for users. The scenegraph specification is a useful abstraction that allows any number of frontend or backend compilers to be attached to the process, very much like how modern compilers work.
Architecture Diagram
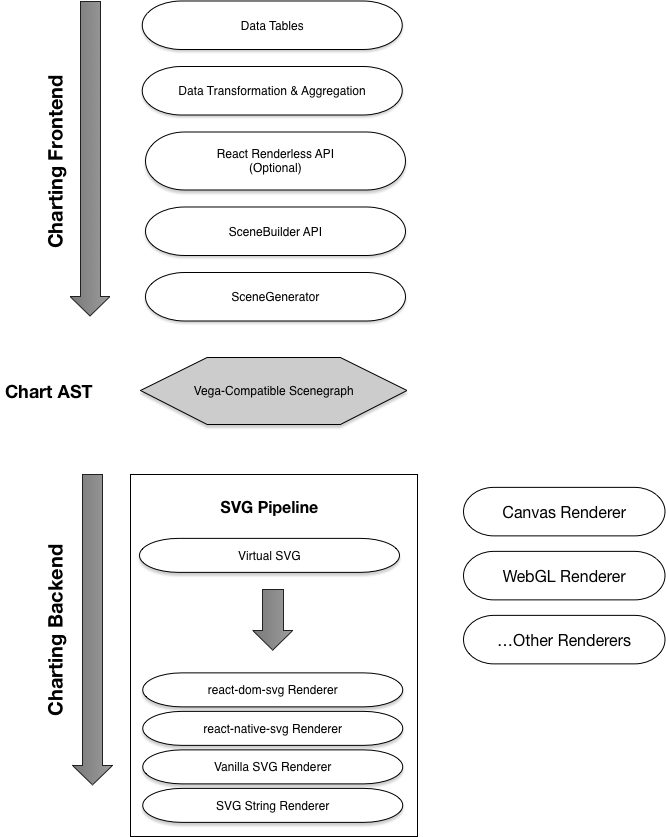
Frontend Charting Components
The front-end of our charting system is comprised of everything required to turn data into a Scenegraph. The frontend consists primarily of:
- A SceneBuilder API that is used to create scene specifications.
- A React component API that can be used to define scenes in React.
- A Scene Generator that binds a scene specification to user data and emits Scenegraph objects.
Backend Charting Components
The goal of the backend charting components is to translate the Scenegraph object into an output that is viewable by users. Our goal is to support several rendering options, from SVG and Canvas to WebGL.
Renderers
The current support for renderer output includes: