Introduction & Background
chart-parts is a flexible Grammar-of-Graphics designed for application developers.
In the seminal book The Grammar of Graphics, Leland Wilkinson envisioned a system of charting components and data-flow processes to support the generation of charts.
The vision of chart-parts is to implement a grammar of graphics in JavaScript in a flexible, architecture-agnostic way while dovetailing nicely with frameworks application developers use such as React. To date, implementations of the Grammar of Graphics have tended to exist as closed systems. While a closed system can be useful for certain categories of users, we believe that these systems should provide escape hatches and flexibility.
The Missing Abstraction
Charting is a common and complex task. Charting libraries are often implemented as taxonomies of charts, providing components such as BarChart, LineChart, AreaChart, or ScatterPlot to cover the most broadly used types of charts. When a developer wants to augment a chart with a modest graphic such as a mean line or an uncertainty band, or make a novel visualization, it's often necessary to eject out of the charting library and work directly with a 2D rendering API such as SVG, Canvas or WebGL. Additionally, charting libraries are often browser-dependent, which precludes the ability to abstractly describe charts independently of platform.
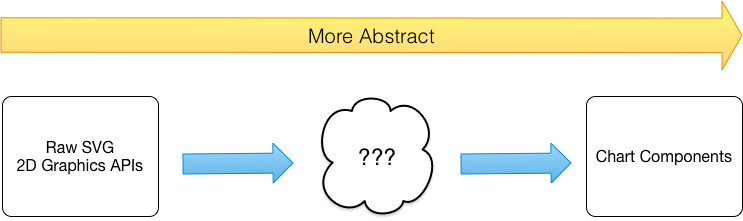
We believe that the notion of a Grammar of Graphics, sometimes referred to as mark-based visualization, has been proved in many contexts to be an elegant way to describe expressive, functional charts that are not as constrained by the charting library that is selected. Moreover, this level of abstraction is easier to develop software at than low-level graphics libraries, and is not coupled to any platform.
Key Concepts
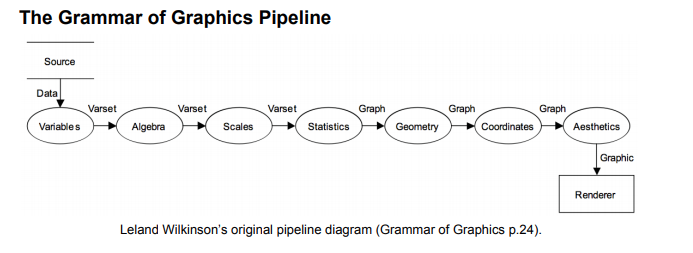
In The Grammar of Graphics, the author envisions a sequenced pipeline of steps that are common to creating charts: including data transformations, scale applications, mark binding, and rendering of marks and guides. Each of these steps is predicated on components existing to define these processes.
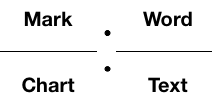
These systems are built on the analogy that graphical elements are to charting as words are to prose, and they are constructed of a "language" of fundamental charting elements. These charting elements are described at a higher level than raw graphics primitives.
- Marks are a key concept in chart-parts, and any system implementing a grammar-of-graphics. Marks are the visual building blocks of charts, such as rectangles, dots, and arcs.
- Scales are mathematical functions that allow us to translate values from a source domain into a target domain. These allow us to translate data into visually encoded values such as color or height.
- Axes are a common feature of charts that allow us to understand the encoding of a spatial dimension in the chart such as height or width.
- Legends are chart components that provide translation for data encodings that are non-spatial, such as color values.
- Data Transformations provide aggregation operations or visual processing to manipulate source data into a chartable form.
Existing Systems
Mark-based systems are common in data-visualization research, but are relatively rare in practice. The most notable implementations of these systems presently are Vega and it's descendants Vega-Lite and Altair.
These systems are excellent for certain use cases, but are often tightly coupled to a target rendering context (e.g. Browsers), and may be difficult to integrate with application code.