Key Concepts
In this section we will describe, at overview-level, the key concepts that are used to create charts using chart-parts. These concepts will likely be familiar to people with a background in data visualization, especially if they have used mark-based visualization systems before.
Scales
Scales are a construct that allow us to translate values from a source domain into a target domain. Practically, what this means is that we can translate values from our data into values that are shown to users, namely screen coordinates, colors, etc...
In chart-parts, our scales are based on d3 scales, and assume basic familiarity with how they operate.
Here are some resources regarding d3 scales that may be helpful:
- d3-scale GitHub repository
- d3-scale-chromatic GitHub repository
- Introducing d3-scale by Mike Bostock
Scale Types
These are the basic scale types supported by the system. More details about using and creating them can be found in the Client APIs documentation section.
- Quantitative: linear, log, pow, sequential, sqrt, time, utc
- Discrete: band, ordinal, point
In chart-parts, each created scale has a name. This allows us to reference the scale when we are defining mark encodings.
Defining Scales
// React API
<LinearScale name="y" domain="data.amount" range={Dimension.Height} nice zero />
// SceneBuilder API
linear('y')
.domain('data.amount')
.range(Dimension.Height)
.nice()
.zero(),Marks
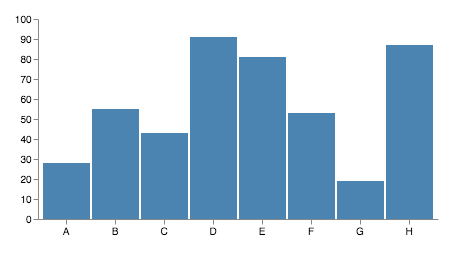
Marks are the fundamental building block, and visual unit of chart-parts, and any grammar-of-graphics.
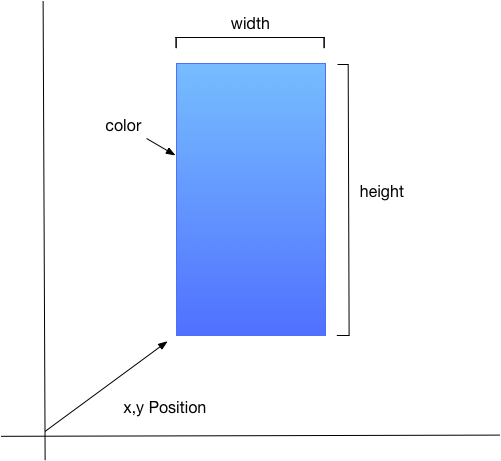
Mark Parameterization
Marks often have multiple parameters to describe how they appear. For example, to describe a rectangle, one needs at a minimum: (height, width, (x,y) position, and color).
Defining Marks
In our system, when we bind these parameters to our data, this is called an encoding. When we encode a parameter, we create an instance of the mark for each row in our data table, and parameterize the mark against that data context.
// React API
<Rect
  table="my-data"
  x={({ d, x }) => x(d.category)}
  height={({ d, y }) => y(d.amount)}
  y={0}
  width={30}
  fill="blue"
/>
// SceneBuilder API
rect()
.table('my-data')
.encode({
x: ({ d, x }) => x(d.category),
height: ({ d, y }) => y(d.amount),
y: 0,
width: 30,
fill: 'blue',
})In the above examples we specify an object where the keys are parameter names (e.g x, y, height, width, and fill) and the values are encoding functions.
Encoding functions have the following signature:
-
encode(ctx: MarkEncodingContext)
MarkEncodingContext Properties:
- d: The current datum (row) in the bound table that this mark is reflecting
- index: The index of the current row in its table
- view: The current available view-space
- [tableName] Tables are included in this context by name
- [scaleName] Scales are included in this context by name
Axes
Axes are a common feature of charts where we can understand the encoding of a dimension in the view-space. Our system provides the ability to create Axes with a chart orientation (Top, Bottom, Left, Right) that are bound to a scale. For more information on creating scales, see the Client API section.
Axes can be constructed with a variety of options, including tick and label parameterization.
Defining Axes
// React API
<Axis orient={AxisOrientation.Bottom} scale="x" />
// SceneBuilder API
axis('x', AxisOrientation.Bottom),View Nesting
A common task in charting is to divide the view-space into separate sub-charts. There are a variety of reasons we may want to do this.
- Rendering different chart types in adjacent areas to focus on different aspects of the data
- Rendering a detail view and an overview to allow brush-selection of what's show in detail
- Data faceting and small-multiple views
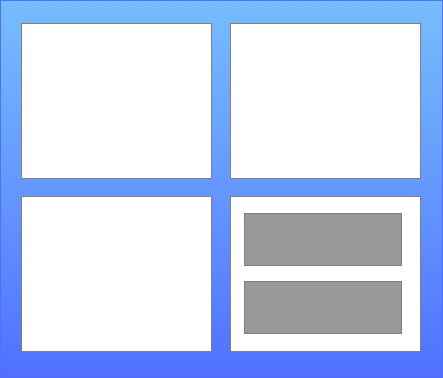
To support this, our view model supports the idea of recursively splitting view areas based on data-faceting or manual definition using the Group mark.
Group Marks
Group type marks are how we split views into sub-views. Each group instance provides a localized view-space to marks nested within it. Groups, like any other mark type, can be bound rows in a table or defined as singleton instances. When groups are data-bound they may optionally define a "facet" parameter to facet the source data table.
Singletons
Any mark be specified as a singleton by not providing a table or faceting option, in which case it is unbound to a data-table and emits only a single item.
group() /* no tabledefined */Faceting
Groups may specify a facet value that describes how to facet incoming data. In this case, the data is partitioned into a set of sub-tables, each representing a view of the source table, and one group item is emitted per each data partition. When faceting is used, the data partition is given a name and provided to child marks so that they can render based on the faceted view of the data the group provides.
// React API
<Group table="my-data" facet={{ name: 'my-data-facet', groupBy: 'category' }}>
  {/* ...children */}
</Group>
// SceneBuilder API
group()
.table('my-data')
.facet({
name: 'my-data-facet',
groupBy: 'category',
})Faceting Specification Object
- name: The name of the facet table to provide to child-marks.
- groupBy: A string describing a field to use as a groupBy key*, or a function that returns a groupBy key* for each row of the incoming data set. The partition key is used to separate the data rows into different partitions.
- transform: A function that accepts a partition of data and performs final transformation before providing it to children. Clients may use this to define aggregation, layout-transformations, or any other augmentation that is necessary for child marks to render. Default is an identity function.