Call Tree view
Overview
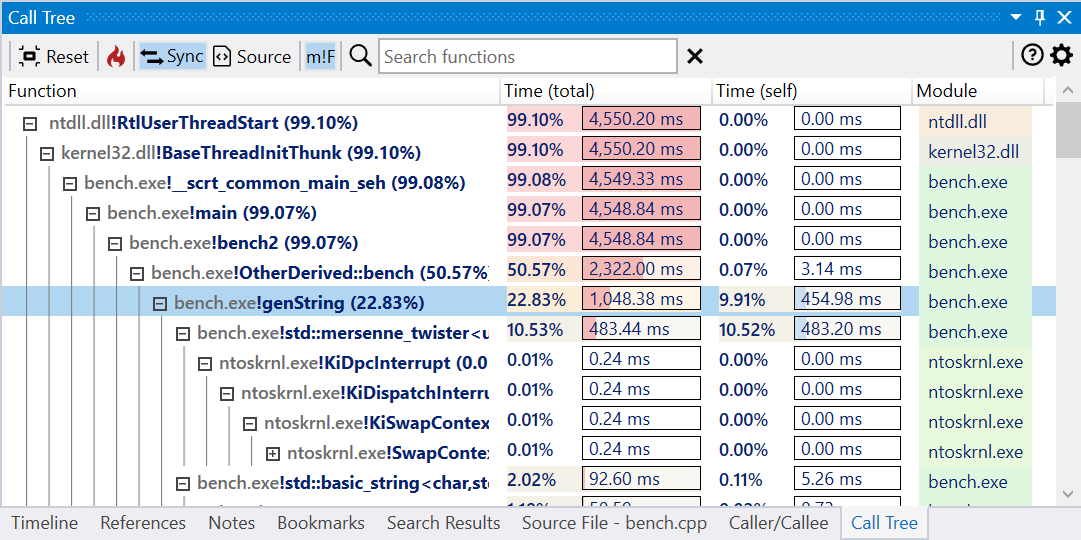
The Call Tree view displays the tree derived from combining the call stacks associated with all profile samples in the trace, with each node representing a unique instance of a function. The node's children represent the callees (called functions), and the parent is the caller function.
Total (inclusive) execution time is computed by accumulating the time of all samples with the instance in the call stack.
Self (exclusive) execution time is computed by subtracting the time spent in children nodes from the total execution time.
The view has two parts:
- a toolbar at the top, with action buttons and the Search input box.
- the tree list view displaying the call tree.
A function node has the demangled (undecorated) function name, optionally prepended with the module name, the total execution time percentage (relative to the entire trace), followed by total/self execution time and module columns.
Note
By default, several levels of the call path with the longest execution time is expanded. This can be configured in the Call Tree options panel.
The columns in all list views can be resized and reorder. The new layout is saved across sessions when closing the application.
Searching functions
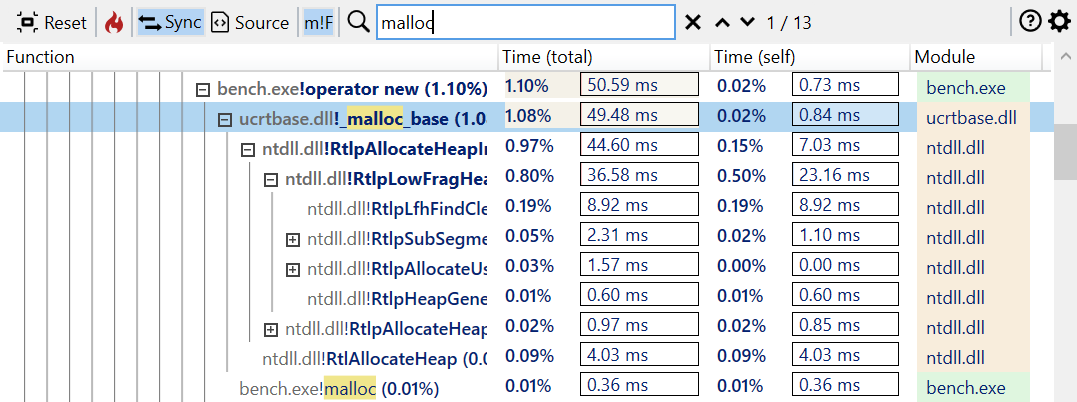
Use the search input box in the toolbar to search for functions with a specific name using a case-insensitive substring search. Matching nodes and function names are marked, and the up/down buttons on the right can be used to navigate between results. Press the Escape key to reset the search or the X button next to the input box.
View interaction
Toolbar
| Button | Description |
|---|---|
 |
Resets the view to the initial state. |
 |
Expands several levels of the the slowest path in the call tree. |
 |
If enabled, selecting a node also selects the associated function in the other profiling views. |
 |
If enabled, selecting a node also displays the associated function in the Source File view, with the source lines annotated with profiling data. |
 |
If enabled, display the module name before the function name in the nodes as module!function. |
| Search box | Search for nodes with a specific function name using a case-insensitive substring search. Press the Escape key to reset the search or the X button next to the input box. |
Mouse shortcuts
| Action | Description |
|---|---|
| Hover | Hovering over a node briefly displays a preview popup with the complete function name and total/self execution times. Clicking the Pin button or dragging the popup expands it into a panel equivalent to the Details panel. Multiple such panels can be kept open at the same time. |
| Click | Selects a function. If Sync is enabled in the toolbar, the function is also selected in the other panels. Displays the associated function in the Source File view if Source is enabled in the toolbar. |
| Double-click | Opens the Assembly view of the selected function in the active tab. |
| Ctrl+Double-click | Opens the Assembly view of the selected function in a new tab. |
| Shift+Double-click | Opens the Assembly view of the selected function in the active tab, with profile data filtered to include only the selected instance. |
| Ctrl+Shift+Double-click | Opens the Assembly view of the selected function in a new tab, with profile data filtered to include only the selected instance. |
| Right-click | Shows the context menu for the selected function. |
Keyboard shortcuts
| Keys | Description |
|---|---|
| Space | Expands (zooms-in) the pointed node to cover the view's width, adjusting child node widths accordingly. |
| Return | Opens the Assembly view of the selected function in the active tab. |
| Ctrl+Return | Opens the Assembly view of the selected function in a new tab. |
| Alt+Return | Opens a preview popup with the assembly of the selected function. Press the Escape key to close the popup. Multiple preview popups can be can be kept open at the same time. |
| Shift+Return | Opens the Assembly view of the selected function in the active tab, with profile data filtered to include only the selected instance. |
| Ctrl+Shift+Return | Opens the Assembly view of the selected function in a new tab, with profile data filtered to include only the selected instance. |
| Alt+Shift+Return | Opens a preview popup with the assembly of the selected function, with profile data filtered to include only the selected instance. |
| Ctrl+C | Copies to clipboard a HTML and Markdown table with a summary of the selected nodes. |
| Ctrl+Shift+C | Copies to clipboard the function names of the selected nodes. |
| Ctrl+Alt+C | Copies to clipboard the mangled/decorated function names of the selected nodes. |
| Ctrl+= | Expands several levels of the the slowest path of children of the selected function. |
| Ctrl+- | Collapses all children of the selected function. |
| Ctrl+0 Ctrl+R |
Resets the view to the initial state. |
| Left-arrow key | Collapses the children of the selected function and goes up one level. |
| Right-arrow key | Expands the children of the selected function and goes down one level. |
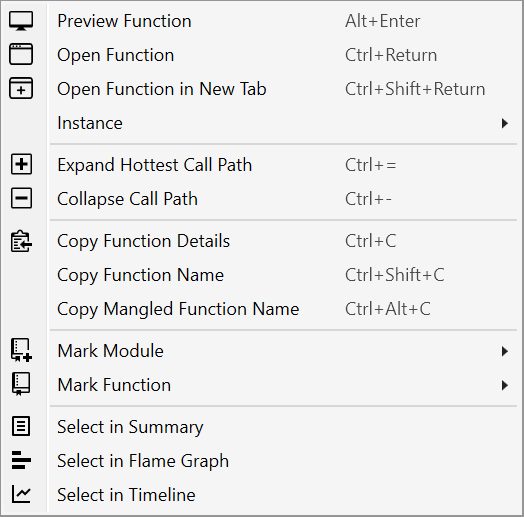
Right-click context menu
View options
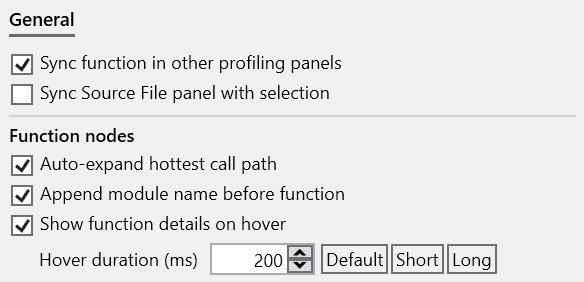
Click on the Gears icon in the top-right part of the view displays the options panel (alternatively, use the Call Tree tab in the application Settings window.).
The tabs below describe each page of the options panel:
Documentation in progress
- Marking nodes
- View options